BUILDING ROOF COMPONENT EXTRACTION FROM PANCHROMATIC SATELLITE
IMAGES USING A CLUSTERING-BASED METHOD
Tahmineh Partovi∗, Reza Bahmanyar∗,†, Thomas Krauß, Peter Reinartz
Remote Sensing Technology Institute (IMF), German Aerospace Center (DLR), Wessling, Germany
{tahmineh.partovi, gholamreza.bahmanyar, thomas.krauss, peter.reinartz}@dlr.de
Commission III, WG III/4
KEY WORDS:Pan-chromatic image, DSM, Roof Type Detection, Mask Refinement, Clustering
ABSTRACT:
Developing fully automatic systems is still an active research topic in 3D building model reconstruction. While a general solution to the building reconstruction problem relies on collecting and grouping the modeling cues (e.g., lines, corners, planes) from Digital Surface Model (DSM) data, failure in finding the cues due to noise in the DSM and the object complexities is a big challenge. In this paper, we introduce a clustering-based method for cue discovery from Pan-chromatic satellite images which reduces the dependencies of the reconstruction techniques on DSM data. Experimental results show that the proposed method is not only able to effectively refine building masks by discriminating building boundaries from nearby clutter, but also is able to determine the roof types (e.g., pitched, flat). The latter, allows to establish a reconstruction method to reduces the search effort and the failure probability regions in finding a particular cue by leading the system to an appropriate area.
1 INTRODUCTION
3D building models of urban areas are necessary for various ap-plications such as urban planning, network planning for mobile communication, and tourism information systems. Even though several methods have been introduced for 3D building model re-construction, developing fully automatic systems is still an active research topic. A general solution to the building reconstruction problem relies on collecting modeling cues (e.g., lines, corners, planes) from Digital Surface Model (DSM) data, and then group-ing them by considergroup-ing geometric topologies between the adja-cent cues. However, missing some of the cues due to noise in the DSM and the object complexities is a big difficulty to make this method perform automatically. To tackle this problem, integrat-ing DSM with an additional data such as 2D cadaster maps and optical image data has been shown to be helpful (Vosselman et al., 2001, Haala et al., 2007). Moreover, recovering the incomplete cues is an important post processing step. Data-driven-based re-construction has been demonstrated to provide promising results by extracting cues from either DSM data or the integration of DSM and optical Earth Observation (EO) image data (Haala et al., 2007). This method then reconstructs the 3D building models based on various conditions such as closeness, symmetry, and or-thogonality between the cues. Most of the previously introduced data-driven reconstruction methods use DSM obtained from Li-DAR data (Sohn et al., 2008, Tarsha-Kurdi et al., 2008). This data is usually dense with high signal to noise ratio. However, there are other sources of DSM data obtained, for example, by stereo matching of satellite images which suffer noise and arti-facts. The existing noise makes discovering meaningful patterns, based on the information from the neighboring points, very dif-ficult. For example, in some regions, the slopes of neighboring points in the same roof plane are significantly different. Figure 1 shows an example of this data, where (b) is the DSM of a sample scene of Munich city1represented in (a), which is generated us-ing Semi-Global Matchus-ing (SGM) method (Hirschmuller, 2008,
∗Corresponding authors.
†The author also affiliated by the Munich Aerospace Faculty, Munich. 1https://www.google.de/maps/
(a) Sample scene of Munich city
p
1p
2p
3(b) DSM generated using SGM
(c) Profilep1 (d) Profilep2 (e) Profilep3
Figure 1: DSM of a sample scene of city Munich and the pro-files of some building roofs for better interpretation of the DSM precision.
d’Angelo et al., 2008) from DigitalGlobes’ WorldView-2 data. In order to better representation of the DSM data, profiles of three regions (as depicted in the DSM image) are taken and shown in (c), (d), and (e). In these images the green lines are the origi-nal roof planes, where the representation of the planes by DSM data is demonstrated by red. According to the results, DSM pro-vides noisy representations of the roof planes. Previous results in deriving building outlines and ridge lines have demonstrated the potential for using these data to extract single buildings but they still exhibit several shortcomings due to the low quality of the DSM data (Sirmacek et al., 2012, Arefi and Reinartz, 2013, Partovi et al., 2013).
ex-lows integrating similar information over the entire scene using the local features extracted from an optical image. In our experi-ments, we use merely orthorectified panchromatic images. These images exhibit high spatial resolution and precise 2D geometry information. Experimental results show that various clusters not only discriminate building roofs from other image parts but also distinguish different roof types (e.g., pitched, flat). Determin-ing roof types helps buildDetermin-ing reconstruction methods to concen-trate on proper areas in finding specific cues. For example, they look for roof ridge lines only in the areas which are recognized as pitched roofs. This not only reduces the search and computation effort, but also reduces the rate of failure in detecting cues. More-over, our experiments show that the proposed method is able to discriminate the building boundaries from the nearby clutter. This can help to refine the building masks, used to discriminate build-ings from the reset of a scene, for building boundary regions. The performance of the proposed method is then assessed both qual-itatively and quantqual-itatively by comparing to a ground truth data. Results show that the method can effectively refine the building masks. Furthermore, it is able to recognize the pitched and flat roofs to a large extent.
Rest of the paper is organized as the following. Section 2 in-troduces k-means clustering. In section 3, the methodologies for refining building masks and determining roof types are explained. Section 4 provides the experimental results and discussions. Fi-nally, Section 5 concludes the paper.
2 K-MEANS CLUSTERING
Clustering is one of the main used methods for explorative data analysis in vast variety of applications such as machine learning, pattern recognition, and information retrieval. The main goal of clustering is to divide a set of pointsX ={x1, x2, ..., xn}into several groups in such a way that similar points are grouped in the same cluster.
K-means is one of the most popular clustering method in data mining. It aims to partition a given set of points intok(k≤n) clustersS={s1, s2, ..., sn}by assigning each point to the clus-ter with the nearest mean and minimizing the squared distances between the points and the means, for all thekclusters,
arg min
whereµi is the euclidean mean of the clustersi. Since in k-means the minimization is an NP-hard problem, heuristic algo-rithms such as iterative refinement technique (MacKay, 2003) are commonly employed to find a local optimum. Iterative refine-ment technique alternates betweenassignmentandupdatesteps. In each iterationt, in the assignment step, each point is assigned to the cluster with the smallest squared euclidean distance mean, as the following,
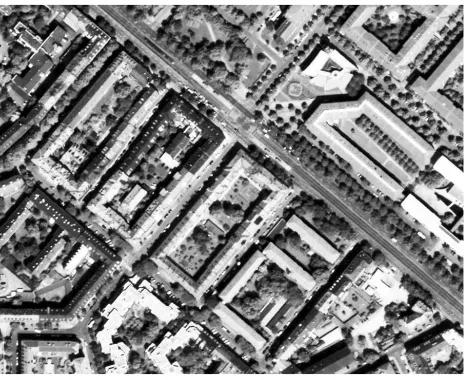
Figure 2: High resolution Pan-chromatic imageI
Considering the point assignments, in the update step, new means are computed for the clusters as follows,
µ(it+1)=
The convergence is occurred when there is no more change in the assignments.
3 METHODOLOGY
In this section, refining the building masks and distinguishing the roof types in merely orthorectified panchromatic images using k-means clustering is explained. In order to process an image, it is described, first by a set of its important and descriptive features from various aspects such as pixel intensities, texture, geomet-rical structures. To this end, various feature extraction methods (e.g., IntHist, WLD, SIFT) are applied to every pixel of the im-age. Then k-means is applied to the extracted feature vectors. The idea is that clustering integrates information from the entire image to group similar regions together.
3.1 Building mask refinement
In satellite image analysis, based on applications, an image can be decomposed into foreground and background. In roof modeling, for example, the focused objects are the buildings. Therefore, discriminating the buildings from background components such as shadows and vegetations, so-called building mask generation, is usually performed before extracting the roof components. To create a mask, first, the ground level objects are discriminated from the higher level ones by computing the normalized Dig-ital Surface Model (nDSM) according to (Weidner and Foerst-ner, 1995). Then the buildings are extracted from the surround-ing patterns and clutter by applysurround-ing Advanced Rule-based Fuzzy Spectral Classification to the image followed by height thresh-olding (Krauss et al., 2012). The obtained mask usually provides rough building boundaries. Moreover, usually some patterns and objects such as shadows and trees are considered as building ele-ments due to their similar characteristics or heights.
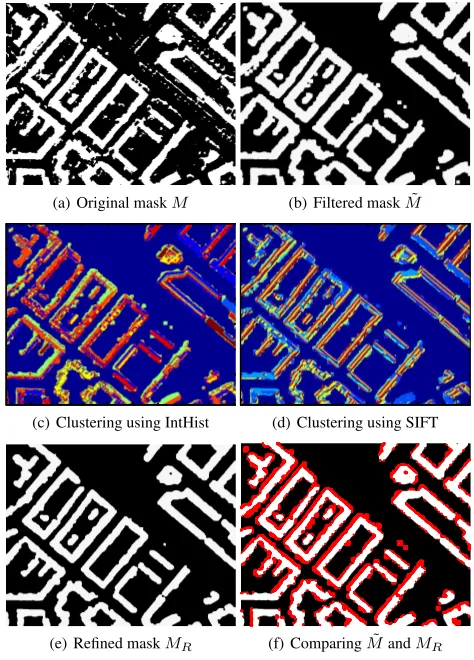
(a) Original maskM (b) Filtered maskM˜
100 200 300 400 500 600 700
(c) Clustering using IntHist
100 200 300 400 500 600 700
(d) Clustering using SIFT
(e) Refined maskMR (f) ComparingM˜andMR
Figure 3: Refining the maskM for the high resolution imageI by employing morphological filtering and clustering. The refined maskMRrepresents finer details of the building boundaries.
using the disc shape structure elementSwith a sufficient large radius is applied to the maskM to remove small particles from the foreground,M˜ =M◦S. Figure 3 (b) indicates that opening provides a more clear representation of the building boundaries; however, the resulting building edges are usually uncertain due to lack of high resolution information during opening. More-over, applying the structure element causes coarse edges which increases the uncertainty. In order to smooth down the edges and to decrease the uncertainty by using detailed information derived from the Pan-chromatic data, in the next step, a clustering method (e.g., k-means) is applied to the imageI for the building areas. To this end, the pixel intensity and the geometry features of the pixels are extracted using IntHist and SIFT methods. K-means is then employed to cluster the extracted features. While for IntHist features, clustering represents illumination diversities caused by changes in the reflection characteristics and angles of the sur-faces, SIFT clusters depict directions and intensities of various edges and corners over the structures based on the illumination gradients. Figure 3 (c) and (d) show the groupings of IntHist and SIFT features into 10 clusters, respectively. In order to refine the building mask, the SIFT and the IntHist clusters which rep-resent the building edges are intersected. More precisely, IntHist clusters provide precise and fine information about the intensity change due to the small probe size of the feature descriptors. This makes IntHist descriptors on the one hand suitable for detecting the building edges, but on the other hand, sensitive to the illumi-nation change. For example, some building edges can be faded in the neighboring patterns and clutter such as the building shad-ows. In order to compensate this problem, SIFT features are used which are more stable against illumination change due to using larger probe and gradient information. SIFT clusters can provide
(a) (b)
(c) (d)
Figure 4: Comparing the boundary depictions of sample regions of the imageIusing the given maskM (blue), the filtered mask
˜
M(red), and the refined maskMR(green).
coarse information about the edges and their elongations. There-fore, combining IntHist clusters with SIFT ones allows searching for the precise building edges in more correct and certain regions. Then by removing the clusters which by both features determined as edge regions, the non-building patterns are disconnected from the building parts as small objects. These particles are then re-moved by applying connected component thresholding and mor-phological opening to achieve the final refined maskMR. Fig-ure 3 (e) shows the refined mask and FigFig-ure 3 (f) demonstrates the refinement evolution of the building edges fromM˜ toMR, where the red parts depict the edges before refinement. In or-der to provide better impression of the mask refinement, the three masks (M,M˜, andMR) are mapped on sample parts of the im-ageIin Figure 4. As the results show, mask refinement helps to achieve better localization of the building boundaries.
3.2 Determining building roof types
High resolution satellite images allow us to asses the human made structures with details. For example, in roof modeling, one can distinguish different roof types such as flat, hip, and gable based on their components such as number of planes and roof pitches. A flat roof, for example, consists of one flat plane while a hip roof is a composition of three pitched planes.
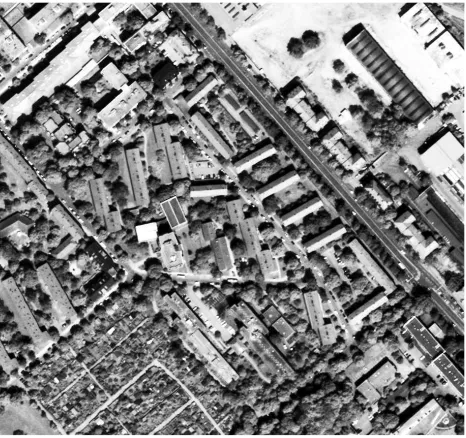
Figure 6: High resolution Pan-chromatic imageJ
Image Image size GSD
I 720×907 50cm
J 852×915 50cm
Table 1: The specifications of the used image samples of Munich city, the images’ sizes and Ground Sampling Distance (GSD).
In a next step, a more detailed exploration of pitched roofs can be performed to discriminate the gable and hip roofs. Determining the roof types leads to look for a particular component of each roof type in an appropriate region e.g., ridge lines in pitched roof areas.
4 RESULTS AND DISCUSSION
The proposed method has been applied to panchromatic images of DigitalGlobe’s WorldView-2 for two sample regions of Mu-nich city. Figure 2 and 6 show these samples, while their specifi-cations are mentioned in Table 1.
4.1 Feature descriptors
In our experiments, we take advantage of four feature extraction methods, namely IntHist, WLD, SIFT, and HOG. IntHist is a method to discover the intensity features of images as local vec-tors of pixel values. The size of each feature vector depends on the number of neighbors considered by local window around each pixel, which in our experiment is 25. WLD (Chen et al., 2010) is a feature descriptor proposed to represent textural patterns of images. It performs based on Orientation, the gradient orienta-tion of each pixel x, and Differential Excitaorienta-tion, the intensity of a pixel x divided by the difference between the intensity of the pixel x and those of its neighbors. The size of the WLD feature vectors in our experiments is 144. SIFT (Lowe, 1999) is a method to extract local geometry-based information of an image such as edges and corners. The size of each SIFT feature vector is 128. HOG (Dalal and Triggs, 2005) is a technique proposed to extract gradient features of a given image by counting occurrences of gradient orientations in localized portions of the image. Size of each feature vector is 81 in our experiments.
(a) (b)
Figure 7: Theoriginalmask (a) and therefined(b) masked using the proposed method.
4.2 Building mask refinement
In order to evaluate the proposed mask refinement method, it is applied to high resolution Pan-chromatic imagesI and J and their corresponding masks. The original masks and the refined ones are shown in Figure 3 and 7. As the results show the pro-posed method not only removes the small patterns which usually are not part of buildings, but also refines the building edges. In order to evaluate the accuracies of the masks quantitatively, the original, filtered, and refined mask are compared to the reference building outlines (footprints), provided by Munich Department of Environment and Health, of the buildings according to the perfor-mance measures introduced in (Sohn et al., 2009). To this end, the difference between the binary maps of the masks and the footprint is measured pixel by pixel. The results are then used to compute four error types, namely True Positive (TP), True Negative (TN), False Positive (FP), and False Negative (FN). In evaluating the accuracies of the masks the errors are defined as the pixels which are determined as building by both the mask and footprint (TP), non-building by both the mask and footprint (TN), building only by the footprint (FP), and building only by the mask (FN). Using the computed error types, the correctness and the quality of the masks are computed as:
Correctness= N(T P)
N(T P) +N(F P), (4)
Quality= N(T P)
N(T P) +N(F P) +N(F N), (5)
whereN(.) denotes the number of pixels which are assigned to one of the four error types. While Correctness measures the building detection performance of the masks, Quality provides an overall performance measure of the masks by considering both building detection and boundary delineation. Table 2 shows the Correctness and Quality of the original, filtered, and refined masks for the images I and J. As the results show for the both images, morphological filtering does not improve the correctness of the masks. In other words, the building detection is not improved due to increasing the uncertainty, especially in building edges, caused by not using high resolution Pan-chromatic images and the coarse edges resulted by applying the structure element during morpho-logical opening. However, using the features extracted from high resolution Pan-chromatic images lead to decreasing the uncer-tainty by not only refining the edges but also by removing most of the small errors at the building edges. Therefore, the refinement method significantly improves both the correctness and quality of the masks.
4.3 Detecting pitched and flat roofs
im-(a)
100
200
300
400
500
600
700
(b)
100
200
300
400
500
600
700
(c)
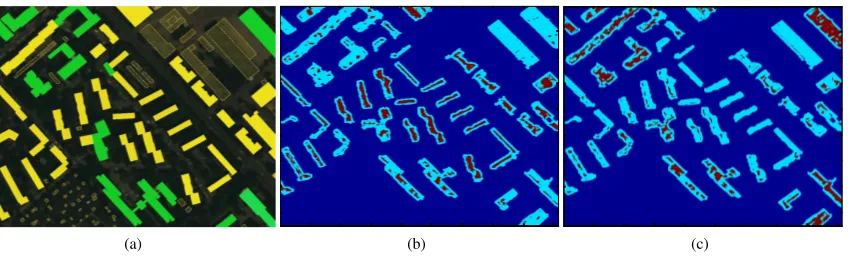
Figure 5: The ground truth (a), and demonstration of the areas in imageIdetected aspitched(b) andflat(c) roofs. In the ground truth pitched and flat roofs are depicted byyellowandgreen, respectively
Image Performance measure Original mask (M) Filtered mask (M˜) Refined mask (MR)
I Correctness (%) 71.28 71.83 80.81
Quality (%) 63.45 65.12 70.98
J Correctness (%) 71.07 70.86 82.48
Quality (%) 54.72 57.26 62.32
Table 2: Correctness and Quality measures of the original, filtered, and refined masks in detecting the boundaries of the buildings in imagesIandJ.
ages, WLD-HOG (explained in Section 3.2) feature descriptors are performed to extract their descriptive textural and gradient features. To determine buildings’ roof types, k-means is applied to the feature descriptors. The representative clusters of each roof type are then selected manually. In order to make use of knowl-edge transfers between scenes, the clusters obtained from image Iare used to initialize k-means for imageJ. Experimental re-sults show that the clusters which are selected as representatives of each type in imageI mostly represent the type in image J too. This allows enriching the representative clusters (features) by learning from various scenes to generalize the learned model in a future work. Figure 8 shows the ground truth as well as the detected pitched and flat roof areas in imageJ. In Figure 8 (b), for example, the areas in the building mask which have been rec-ognized to contain pitched roof features are depicted in red. Com-paring to the ground truth, most of the pitched roofs have been detected correctly; however, in some regions they are missed due to either ambiguity of the extracted features (e.g., the roofs slopes are very small), or occurring new features which have not been seen in the previous experiment (clustering is initialized by the clusters obtained from imageI).
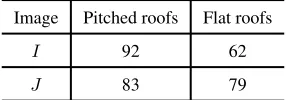
In order to assess the performance of the proposed method in detecting roof types quantitatively, the Quality measure (Equa-tion 5) is used, where the detected areas are compared to the ground truth. The four error types are then derived, for exam-pled for the pitched roof detection, by counting the number of pitched building blocks which are correctly distinguished (TP), the non-pitched blocks which are detected to be pitched (FP), and the pitched blocks which are not detected (FN). Table 3 shows the quantitative performance assessment of the proposed method. According to the results, the proposed method detected the roof types correctly in both sample images to a large extent. More-over, the higher performance in detecting pitched roofs shows the higher ability of the used feature descriptors in extracting repre-sentative features of the pitched roofs. The detected areas can further be used by building reconstruction methods to look for relevant cues in appropriate regions. This not only decrease the search and computation effort, but also decrease the failure in
Image Pitched roofs Flat roofs
I 92 62
J 83 79
Table 3: The Quality measure (%) of the clustering method in categorizing the buildings into pitched and flat roofs for imagesI andJ.
finding detail components. For example, systems can discard flat roof areas when they search for roofs’ ridge lines.
5 CONCLUSIONS AND FUTURE WORK
In this paper, we introduce a clustering-based method for cue dis-covery from Pan-chromatic satellite images to reduce the depen-dencies of the building reconstruction techniques on DSM data. The proposed method clusters various local features of the im-ages to find the representative features by integrate similar infor-mation over the entire scene. Experimental result show that the proposed method is able to refine building masks by discriminat-ing builddiscriminat-ing boundaries from nearby clutter. Moreover, it is able to determine roof types (e.g., pitched, flat) by detecting represen-tative features of each roof type. This reduces the search effort and failure of building reconstruction methods in finding a par-ticular cue by leading them to search in appropriate regions.
(a)
700
800
(b)
700
800
(c)
Figure 8: The ground truth (a), and demonstration of the areas in imageJdetected aspitched(b) andflat(c) roofs. In the ground truth pitched and flat roofs are depicted byyellowandgreen, respectively.
REFERENCES
Arefi, H. and Reinartz, P., 2013. Building reconstruction using DSM and Orthorectified images. Remote Sensing 5(4), pp. 1681– 1703.
Chen, J., Shan, S., He, C., Zhao, G., Pietikainen, M., Chen, X. and Gao, W., 2010. WLD: A robust local image descriptor. Pat-tern Analysis and Machine Intelligence, IEEE Transactions on 32, pp. 1705 –1720.
Dalal, N. and Triggs, B., 2005. Histograms of oriented gradients for human detection. In: Computer Vision and Pattern Recogni-tion, 2005. CVPR 2005. IEEE Computer Society Conference on, Vol. 1, pp. 886–893 vol. 1.
d’Angelo, P., Lehner, M., Krauss, T., Hoja, D. and Reinartz, P., 2008. Towards automated dem generation from high resolution stereo satellite images. IAPRS XXXVII (B4), pp. 1137–1342.
Haala, N., Becker, S. and Kada, M., 2007. Cell decomposition for building model generation at different scales. In: Urban Remote Sensing Joint Event, 2007, pp. 1–6.
Hirschmuller, H., 2008. Stereo processing by semiglobal match-ing and mutual information. IEEE Trans. Pattern Anal. Mach. Intell. 30(2), pp. 328–341.
Krauss, T., Sirmacek, B., Arefi, H. and Reinartz, P., 2012. Fusing stereo and multispectral data from worldview-2 for urban mod-eling. In: Proc. SPIE Defense, Security and Sensing, Vol. 8390, pp. 83901X–83901X–15.
Lowe, D., 1999. Object recognition from local scale-invariant features. In: Computer Vision, 1999. The Proceedings of the Seventh IEEE International Conference on, Vol. 2, pp. 1150 – 1157.
MacKay, D., 2003. Information Theory, Inference and Learning Algorithms. Cambridge University Press.
Partovi, T., Arefi, H. and Reinartz, T. K. P., 2013. Automatic model selection for 3d reconstruction of buildings from satellite imagery. IAPRS Vol. XL-1/W, pp. 315–320.
Sirmacek, B., Taubenbock, H., Reinartz, P. and Ehlers, M., 2012. Performance evaluation for 3-d city model generation of six dif-ferent DSMs from air- and spaceborne sensors. Selected Topics in Applied Earth Observations and Remote Sensing, IEEE Jour-nal of 5(1), pp. 59–70.
Sohn, G., Huang, X. and Tao, V., 2008. Using a binary space par-titioning tree for reconstructing polyhedral building models from airborne lidar data. Photogrammetric Engineering and Remote Sensing.
Sohn, G., Huang, X. and Tao, V., 2009. A Data-Driven Method for Modeling 3D Building Objects Using a Binary Space Parti-tioning Tree. CRC Presss.
Tarsha-Kurdi, F., Landes, T. and Grussenmeyer, P., 2008. Ex-tended ransac algorithm for automatic detection of building roof planes from lidar data. The Photogrammetric Journal of Finland pp. 97–109.
Vosselman, G., Dijkman, E., Reconstruction, K. W. B., Altime-try, L. and Transform, H., 2001. 3d building model reconstruction from point clouds and ground plans. Int. Arch. of Photogramme-try and Remote Sensing pp. 37–43.
Vosselman, G., Gorte, B. G. H., Sithole, G. and Rabbani, T., 2004. Recognising structure in laser scanner point clouds 1.