Ž .
Atmospheric Research 52 2000 241–260
www.elsevier.comrlocateratmos
Incorporation of aerosol particles between 25 and
850 nm into cloud elements: measurements with a
new complementary sampling system
Alfons Schwarzenboeck
), Jost Heintzenberg, Stephan Mertes
Institut fur Tropospharenforschung Permoserstr. 15, 04318 Leipzig, Germany¨ ¨Received 10 December 1998; received in revised form 7 July 1999; accepted 28 August 1999
Abstract
The interpretation of the physico-chemical processes in clouds is facilitated by segregating in
Ž .
situ cloud elements from their carrier gas and small particles interstitial aerosol . Thus, the present study focuses on the quantitative phase segregation of interstitial air from cloud phase by two complementary samplers with microphysical on-line analysis of the separated phases. An
Ž .
improved counterflow virtual impactor CVI was developed for the collection and subsequent evaporation of the condensed phase, releasing dissolved gaseous material and residual particles. This sampler operates in the size range of few micrometers up to 50 mm in cloud element diameter and is matched by an interstitial Round Jet Impactor sampling the gas phase with interstitial particles. Calibrations of both samplers verified the calculated cut sizes D50of 4, 5, and 6mm and quantified the slope of the collection efficiency curves. Until this study no direct CVI measurements of the residual particle sizes far below the diameter of 0.1mm were available. For
Ž .
the first time a CVI was connected to a Differential Mobility Particle Sizer DMPS scanning between 25 nm and 850 nm, thus, including the entire Aitken mode in the residual size analysis. Cloud studies on the Puy de Dome, France, revealed residual particle sizes including Aitken modeˆ
Ždiameter D-100 nm and accumulation mode D. Ž )100 nm . A major feature of the CVI data is.
expressed by the fact that despite incomplete incorporation of accumulation mode particles in cloud elements there are contributions of particles with diameters smaller than 0.1 mm to the number of residual particles. Cloud entrainment from height levels above the maximum supersatu-ration as wells as the size-dependent chemical composition of the aerosol population most likely produced the S-shaped size-dependent partitioning of residual particles. Compared to earlier
)Corresponding author. Tel.:q49-3412352537; e-mail: [email protected]
0169-8095r00r$ - see front matterq2000 Elsevier Science B.V. All rights reserved.
Ž .
studies the 50% partitioning diameters dropped significantly below 100 nm to roughly 70 nm.
q2000 Elsevier Science B.V. All rights reserved.
Ž .
Keywords: Phase partitioning in clouds; CCN cloud condensation nuclei ; Nucleation scavenging; Counter-Ž .
flow virtual impactor CVI
1. Introduction
A cloud is a complex system composed of three phases: gases, solid material, and liquids. In clouds, gases and aerosol particles can dissolve or become suspended inron hydrometeors which themselves have polydisperse size distributions, ranging from micrometers to millimeters in diameter. Particles that activate at a given supersaturation
Ž .
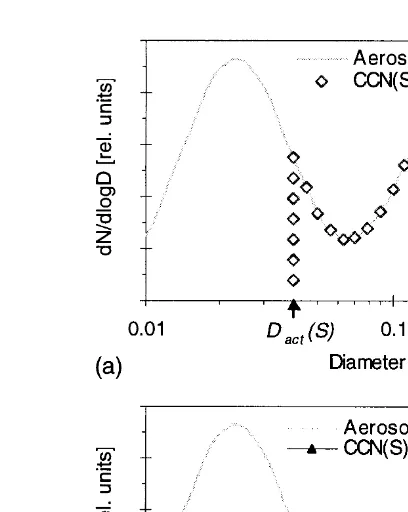
S of water vapor are denoted as cloud condensation nuclei CCN S . It has frequently
been assumed that most of the submicrometer mass is incorporated into cloud water
Že.g., Hegg, 1983 . Besides coarse mode aerosol diameter. Ž )1mm , the accumulation.
Ž . Ž .
mode aerosol 0.1–1 mm is the predominant source of CCN S and contributes significantly to the content of dissociated species such as sulfate, ammonium, and
Ž .
hydrogen ions in hydrometeors Charlson et al., 1983 . This is conceivable in the simplest case of an aerosol population with uniform chemical composition where all
Ž . Ž
particles above a diameter Dact S become activated as a function of supersaturation cf.
.
Fig. 1a . However, for aerosol populations where the chemical composition is
size-de-Ž .
pendent the CCN S concentration is a more complicated function of the particle
Ž . Ž
diameter D cf. Fig. 1b and even smaller particles may become activated adapted from
Ž . .
Seinfeld and Pandis 1998 , adding an arbitrary but reasonable x-axis . A size-dependent state of mixture of soluble and insoluble material will further complicate this picture
ŽHeintzenberg and Covert, 1990 ..
Thus, in the past years, the determination of the scavenging fraction as a function of
Ž .
particle size has been addressed in a number of studies. Noone et al. 1992b measured for a polluted ground fog near Bologna, Italy that aerosol particles between 0.4–0.7mm in diameter activated to form droplets. For a mountain site in central Sweden
Heintzen-Ž . Ž .
berg et al. 1989 found residual sizes between 0.08–1.6 mm. Hallberg et al. 1994 reported of particle diameters where 50% of the particles are incorporated in the cloud
Ž .
phase D50 % of 0.11mm to 0.31mm for the Kleiner Feldberg, Germany. Martinsson et
Ž .
al. 1997 reported D50 % in the range of 0.11–0.17 mm with the Droplet Aerosol
Ž . Ž .
Analyzer DAA for the Great Dun Fell GDF , Great Britain, and values of 0.096mm
Ž .
to 0.15mm during a subsequent GDF campaign Martinsson et al., 1999 .
Typical in-cloud size distributions of the interstitial aerosol as well as size spectra of cloud droplets and ice crystals are shown in Fig. 2. The interstitial size distributions of uniform as well as of size-dependent chemical compositions are derived from Fig. 1a,b.
Ž .
Droplet spectrum and crystal sizes were adapted from Arends et al. 1994 and
Ž .
Harrington et al. 1996 , respectively. These ‘‘typical’’ cloud size distributions were chosen in order to outline the objectives and experimental approach in the present study of complementary sampling and analysis of interstitial and cloud phase with a Round Jet
Ž . Ž .
( )
A. Schwarzenboeck et al.rAtmospheric Research 52 2000 241–260 243
Ž . Ž .
Fig. 1. CCN S for a uniform chemical composition a of the aerosol population with particle activation
Ž . Ž .
diameter Dact S and for a multi-component aerosol population with size-dependent chemical composition b . Ž .
Adapted from Seinfeld and Pandis 1998 .
schematically the case of a cloud where a CVI should operate at a lower cut size in the range of few microns to sample the entire number concentration of hydrometeors. However, up to now 6.78 mm was the lowest cut size for a ground-based CVI where
Ž .
Fig. 2. Interstitial particle size distributions derived from Fig. 1 of uniform chemical composition and
Ž .
Ž .
calibration evidence is available Anderson et al., 1993 . Anderson et al. constructed a mini-CVI with minimum cut-size due to a variety of improvements compared to earlier
Ž .
CVI designs Ogren et al., 1985; Noone et al., 1988 and due to a superior dry calibration method having superior reliability than a former wet calibration method
ŽNoone et al., 1988 . Reported cut sizes in the range of 4–6. mm of ground-based CVIs
Ž .
used in campaigns during late Eighties and early Nineties e.g., Noone et al., 1992b were based on model estimates rather than experimental calibrations.
A further advancement of this study, besides the development of an improved CVI,
Ž .
was the coupling of the CVI to a Differential Mobility Analyzer DMA for direct residual size measurements including the entire Aitken mode range. In earlier studies, optical particle spectrometers were interfaced to CVIs that performed at lower detection
Ž .
limits )100 nm e.g., Noone et al., 1992b; Hallberg et al., 1994 , and in a single
Ž .
experiment down to 80 nm Heintzenberg et al., 1989 . In the main part of the study, two cloud events will be presented, showing the combined data of the two samplers, with novel results of small activated particles in moderately polluted airmasses.
2. Experimental approach for studying cloud processes
One major task for the understanding of cloud processes is to determine the phase partitioning of volatile, non-volatile, soluble and insoluble material between the
intersti-Ž .
tial phase and the cloud phase liquid and ice phase . There are three frequently used approaches to study in-cloud processes:
1. Comparison of the concentration of species X in cloud water with that in pre-cloud air.
2. Comparison of the cloud water concentration of species X to that present as non-activated aerosols in the interstitial air.
3. Comparison of the concentration of species X in the interstitial aerosol to that in pre-cloud air.
The experimental approach used in this study is represented by item 2. Items 1 and 3 have been pursued in studies elsewhere. For example, according to the third approach,
Ž .
Hallberg et al. 1994 derived the scavenging efficiency on Kleiner Feldberg comparing pre-cloud aerosol to in-cloud interstitial aerosol in a single point measurement. This approach is subject to errors with respect to the temporal variation of the aerosol
Ž .
population. Comparison of below-cloud to in-cloud post-cloud, respectively aerosol as
Ž . Ž .
performed, e.g., during Great Dun Fell GDF field campaigns Choularton et al., 1997 were conducted as two point measurements. The GDF, however, does not necessarily compare the same air-parcel, e.g., due to entrainment from layers above the sampling point. The non-identity of pre-cloud with in-cloud air parcel is indeed of no concern for
Ž . Ž .
our set-up, as it is for a setup according to methods 1 and 3 .
For a detailed analysis of hydrometeors, the major question is how to extract the particulate and dissolved material for subsequent analysis. This kind of airborne collection of hydrometeors is accomplished by a CVI. It has the advantage of sampling
Ž .
( )
A. Schwarzenboeck et al.rAtmospheric Research 52 2000 241–260 245
2.1. Instrumentation
Ž .
CVI and Round Jet Impactor RJI presented in this study were designed as the
Ž .
central instruments of the Cloud Ice Mountain Experiment CIME and installed in a horizontally oriented wind tunnel at the Observatoire du Physique du Globe de Cler-mont-Ferrand on top of the Puy de Dome, France. The CVI has been developed to
ˆ
Ž .
sample cloud elements droplets andror crystals larger than a certain aerodynamic size
Ž .
while rejecting the interstitial aerosol Ogren et al., 1985 . The CVI cut size D50 is defined as the diameter with 50% collection efficiency. For a ground-based CVI, a wind tunnel is needed to accelerate the cloudy air for the inertial separation. By varying wind tunnel velocity and CVI counterflow D50 can be controlled within a certain size range.
Ž .
Up to now, 6.78mm Anderson et al., 1993 was the lowest cut size for a ground-based
Ž .
CVI where calibration evidence is available Noone et al., 1988; Anderson et al., 1993 . Along with the CVI, an interstitial phase RJI was designed for an upper cut size that closely complements the sampling characteristics of the CVI. This conventional im-pactor consists of a single aerosol jet impinging upon a flat porous impaction plate. Particles larger than the cut size of the impactor slip across the streamlines and impact on the plate while smaller particles follow the streamlines curving around the impaction plate.
Thus, within this study, the only criterion of phase specification in terms of interstitial aerosol and cloud droplet plus ice crystals is the operational definition of the aerody-namic size of a particle or cloud element that is collected with the respective sampler.
Ž .
Identical sensors cf. Fig. 3 were connected to CVI and RJI, as there are DMPS
Ž
scanning between 25 and 850 nm, Condensation Particle Counters CPC 3760A;
.
Thermosystems, St. Paul, MN, USA for fast concentration measurements, and Lyman-a
Ž .
hygrometers detecting liquid water content LWC . In addition, an airborne-type Particle
Ž .
Volume Monitor PVM-A; Gerber Scientific, Reston, VA, USA was installed in the
Puy de Dome wind tunnel next to the CVI to check the CVI measurements of LWC and
ˆ
volume mean droplet diameter DVM D. The latter quantity is related to the effective diameter Deff of the PVM-A.
2.2. Calibration of the samplers
Ž .
The CVI calibration method presented in Anderson et al. 1993 , using hollow glass
Ž .
beads Polysciences, Warrington, PA; catalogue NR. 19823 to avoid evaporation losses,
Ž .
was utilized in this study. A polydispersion nominal sizes between 2–20 mm of glass
Ž .
beads was either drawn through the plumbing of the passive flows switched off CVI to create a reference size distribution, or was size-selected by the operational CVI. In either case the resulting size distribution was measured with an Aerodynamic Particle Sizer
ŽAPS-3310, Thermosystems, St. Paul, MN, USA . Division of the operational by the.
reference size distribution then yielded the collection efficiency. The same calibration principle holds for the RJI, where the reference size distribution was measured by a dummy version of the RJI without impaction plate. The operational runs of the RJI were performed with an oil-coated impaction plate. The RJI transmits small sizes while the larger particles pass through the CVI. Although calibrated cut sizes for RJIs agree well with the theory, the RJI was subjected to the dry calibration method as a cross-check of its performance.
Ž
During the CVI calibrations, the air velocity in the high speed wind tunnel 225, 200,
y1. Ž y1.
175, and 150 m s as well as the CVI counterflow 0.5, 1, and 3 l min were varied.
Ž
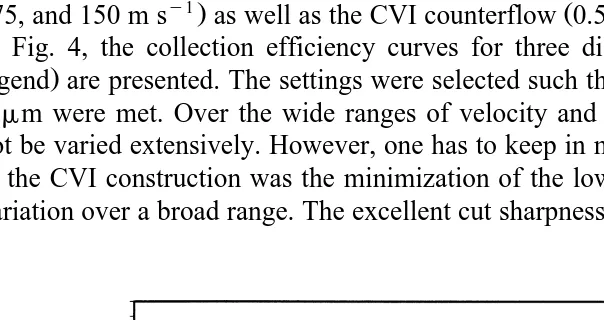
In Fig. 4, the collection efficiency curves for three different settings denoted in the
.
legend are presented. The settings were selected such that cut sizes of 4mm, 5mm and 6mm were met. Over the wide ranges of velocity and counterflow settings D50 could not be varied extensively. However, one has to keep in mind that the overall design goal in the CVI construction was the minimization of the lower cut size and not the cut size variation over a broad range. The excellent cut sharpness is demonstrated by the fact that
( )
A. Schwarzenboeck et al.rAtmospheric Research 52 2000 241–260 247
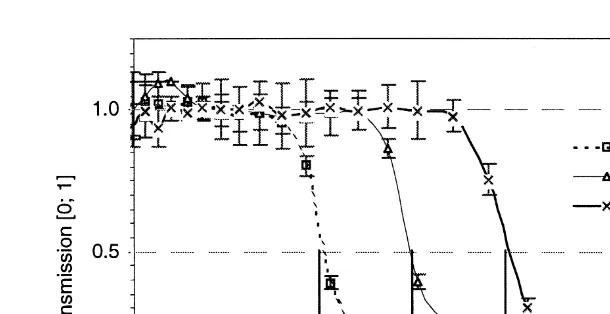
Fig. 5. Experimental transmission efficiencies and 50% cut-off diameters of the RJI for 4, 5, 6mm cut size nozzles. Error bars are one standard deviation above and below the average.
for each setting the collection efficiency increased from 10% to 90% within a size range in the cloud element diameter of less than 2mm.
Ž
Inertial impactors have been studied extensively using numerical methods e.g.,
.
Marple and Willeke, 1976; Rader and Marple, 1985; Willeke and Baron, 1993 . Disregarding bounce-off of particles, an impactor efficiency curve can be determined with as high an accuracy from theoretical analysis as from experimental calibration. Rao
Ž1975 carried out a detailed experimental study to determine the degree of impaction.
plate bounce-off from several types of impaction surfaces. It was concluded that an oil-coated plate yields almost 100% efficiency of the theoretical collection curve. The three calibrated collection efficiency curves for the 4 mm, 5 mm and 6 mm impactor nozzles are presented in Fig. 5. The modeled 50% cut-off diameters were clearly met, whereas bounce-off effects of particles larger than the cut-off could not be totally avoided. The latter fact is seen in the flattening of the transmission efficiency curves towards larger sizes.
3. Measurements on Puy de Dome
ˆ
In October 1996, prior to the CIME, the present CVI was tested at the ECN
ŽNetherlands Energy Research Foundation cloud chamber with a Forward Scattering.
Ž .
Spectrometer Probe FSSP . Comparison of LWC derived from both devices as well as number concentrations of residuals and droplets were in good agreement within devia-tions less than 10%.
During the subsequent CIME pre-campaign in December 1996 and January 1997 on the Puy de Dome, the ambient air ahead of the CVI was accelerated up to 150 m s
ˆ
y1,causing short-term peak supersaturations up to 150%. The integral growth effect,
Ž
.
decreasing rapidly with size . The only device to check the CVI performance in the pre-campaign was the airborne PVM-A that was operated next to the samplers in the
Ž
large wind tunnel. In this way a total of six separate cloud events duration between 4 to
.
14 h were sampled by CVI and PVM-A. The temperatures during events a2 to a6
were observed in the range from 08C to 48C, whereas event a1 was observed aty68C
toy78C. Thus, the PVM-A is most likely influenced during eventa1 by the ice phase
Ž .
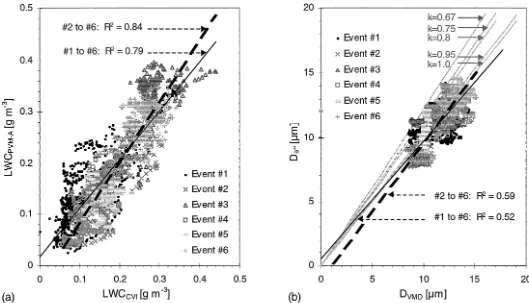
fraction. Wendisch et al. 1998 pointed out the fact that measurements of LWC carried out with five PVMs in parallel deviated significantly. Thus, the good correlation
Ž . Ž .
between LWC and LWC cf. Fig. 6a for cloud event a1 a2, respectively
PV M-A CVI
througha6 demonstrates representative liquid mass collection by the CVI. Regression
lines are added to the data, where each data point represents a 1-min average. Another point that may affect the comparison of CVI and PVM-A is a slightly different size range of detection. While the CVI collects 5 to 50 mm particles, the PVM-A collects particles between 2 and 70mm. Lower and upper size limits are 50% collection points.
Ž
Besides measuring LWC, the PVM-A gives the effective diameter Gerber et al.,
.
In this study, Deff is related to the volume-averaged droplet diameter DVMD
1
6LWC 3
DVM Ds
ž
/
Ž .
2prWNDrop
derived from LWCCV I and number concentration NCVI, where NCVI is assumed to equal
Ž .
NDrop. It is suggested in Gerber 1996 that a suitable parameterization for the effective diameter is standard deviation of a lognormal distribution fitted to the droplet spectrum. Gerber
Ž .
reported k values of 0.75 and 0.95 for a light drizzle stratocumulus Sc cloud.
Ž . Ž . Ž .
Referring to Eq. 3 , Martin et al. 1994 distinguished maritime ks0.8 from
Ž . Ž .
continental ks0.67 cloud cases. Others e.g., Bower and Choularton, 1992 gave
Ž .
values of ks1 Sc clouds . Due to the fact that DVM D follows from measurements of LWCCV I and NCVI, error propagation deteriorates the correlation of the calculated
Ž .
DVM D vs. the measured Deff cf. Fig. 6b . Parameterization lines of the effective
Ž Ž . Ž .
()
A.
Schwarzenboeck
et
al.
r
Atmospheric
Research
52
2000
241
–
260
249
Ž . Ž .
Fig. 6. Correlation of PVM-A- and CVI-derived LWC measurements a and PVM-A-derived Deff correlated to CVI related DVMD b . Linear regression lines with
2 Ž .
on the cloud element spectrum. Assuming variations in b within cloud durations of 4 to 14 h, the variance in CVI derived DVM D compared to the PVM-A measured Deff can be partly explained even within a single cloud. Within the experimental uncertainties of the instruments and by the comparison of DVM D to D , we can derive representativeeff
values for total number and total mass of cloud elements from the CVI.
A wide range of cloud conditions was observed during the time period from December 1996, to January 1997. For the two cloud events discussed below the
Ž .
variability of pre-, post-, as well as in-cloud residual plus interstitial particle aerosol number concentrations within 10 h of measurements is in the range of 900–1300 cmy3
Ž700–1050 cmy3, respectively . Short time fluctuations of up to. "150-250 cmy3 occur
Ž
on time scales of 2–20 min and are superimposed by the large-scale trend time scale of
.
several hours . The variability of residual particle sizes incorporated in cloud droplets
Ž .
will be demonstrated in terms of the size-dependent partitioning fractions FN D of
residual particles over the sum of residual plus interstitial particles. The chosen experimental set-up continuously monitors the partitioning from simultaneous interstitial and residual data, thus becoming largely independent of temporal variations in the aerosol population. At first, the cloud event from December 6 will be discussed, thereafter, the event on December 4. The order in time was reversed in order to begin with the less complex cloud event.
3.1. Cloud eÕent of Dec. 6, 1996
The cloud event on December 6 was of orographic nature. Winds were moderate with air masses approaching from southern directions. A short microphysical summary of the cloud is given in Table 1. Ice crystals were not present due to the shallow vertical extent of the clouds and temperatures in the range of 274.5 to 275.5 K at the sampling site
Ž1460 m a.s.l. . Number concentrations N. RJI and NCVI in both samplers were anti-corre-lated. The low value of LWCCV I is typical for an orographic cloud on Puy de Dome.
ˆ
The integral partitioning number fraction FN of CVI-collected residual particles is small while the respective partitioning volume fraction FV is high due to the largely incorporated accumulation mode. Both fractions were derived from DMPS measure-ments in the range of 25 to 850 nm:
NCV I VCVI
FNs and FVs
Ž .
4NCV IqNRJI VCVIqVRJI
Ž .
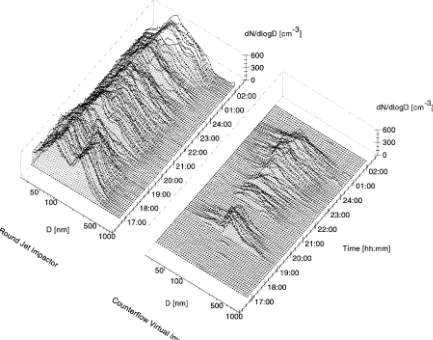
Size distributions over the whole lifetime of the cloud cf. Fig. 7 are shown in 5-min intervals. During pre- and in-cloud conditions aerosol spectra including Aitken mode
Table 1
Microphysical parameters for the orographic cloud event on 961206
y3 y3 y3
Ž . Ž . Ž . Ž .
NRJ I cm NCVI cm FN FV LWCCVI mg m DVMD mm
a a
500–1000 F300 0.17 –0.45 0.40 –0.88 F150 9–11
a
()
A.
Schwarzenboeck
et
al.
r
Atmospheric
Research
52
2000
241
–
260
251
ŽD-100 nm and accumulation mode D. Ž )100 nm were observed. Non-zero residual. Ž
size distributions indicate the presence of the cloud with cloud elements larger 5mm in
.
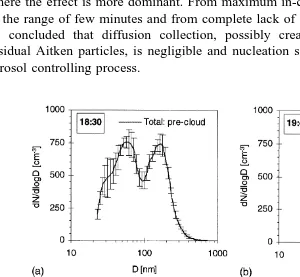
diameter . The accumulation mode that was incorporated to a large fraction into cloud droplets returned to the reservoir of the interstitial sampler after cloud dissipation. Fig.
Ž . Ž .
8a–d presents four time periods of pre-cloud 18:30 , in-cloud 19:45, 23:00 , and
Ž .
post-cloud 01:30 size scans. In order to reduce statistical uncertainties in the DMPS
Ž .
data the distributions were averaged over 20 min equivalent to four DMPS scans . The pronounced bimodal shape of the pre-cloud aerosol largely disappeared after cloud dissolution. This change is based on the temporal development of the air mass. Aerosol residence time in the orographic cloud was typically in the order of a few minutes. The two in-cloud averages predominantly show accumulation mode particles incorporated in
Ž
the cloud elements. The very small fraction of incorporated Aitken particles D-100
.
nm is not neglected but will be discussed in connection with the following cloud event where the effect is more dominant. From maximum in-cloud lifetimes of cloud droplets in the range of few minutes and from complete lack of smallest residual particles it can be concluded that diffusion collection, possibly creating additional post-nucleation residual Aitken particles, is negligible and nucleation scavenging was the predominant aerosol controlling process.
Ž .
Fig. 8. DMPS number size distributions averaged over 20 min for the cloud event on 961206 for a pre-cloud
( )
A. Schwarzenboeck et al.rAtmospheric Research 52 2000 241–260 253
In Fig. 9a,b the incorporation of aerosol particles in cloud elements is illustrated in
Ž .
terms of the size-dependent partitioning number fraction FN D . Both in-cloud averages
Ž19:45 and 23:00 show an S-shaped size dependency comparable to observations in.
Ž .
earlier studies Noone et al., 1992b; Hallberg et al., 1994 . The 50% partitioning
Ž .
diameter fulfilling FN D s0.5 is about 140 nm for both fractions. Error bars in the
Ž .
curves for FN D show the standard deviation below and above the 20-min average
values.
3.2. Cloud eÕent of Dec. 4, 1996
The meteorological situation on December 04, 1996 showed a broad cloud passage over France in connection with an occluding frontal system of a cyclone over the North Sea. The observed non-precipitating cloud event on December 4 was part of the warm front undulating from Southwest to Northeast of France, consisting of moderately polluted air masses. The cloud was characterized by strong winds, again from southern directions, such that sampling from crosswinds with sampling losses of hydrometeors
Žcf. Noone et al., 1992a did not affect the sampling due to north–south orientation of. Ž .
the rigid PDD wind tunnel .
The temperature was between 276 and 278 K at the site. The presence of the ice phase throughout the stratocumulus layer can most likely be excluded. Cloud
microphys-Ž .
ical properties cf. Table 2 were characterized by higher NCV I and maximum LWCCVI
Žthree times the maximum LWCCV I compared to the orographic cloud on December 06,
.
1996 . The total number and volume partitioning fractions FN and FV were similar to those presented for December 6.
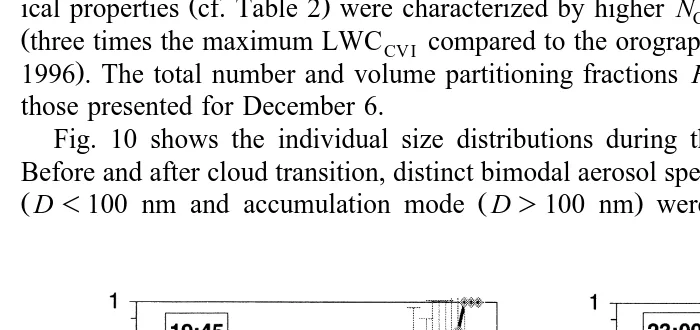
Fig. 10 shows the individual size distributions during the evolution of the cloud. Before and after cloud transition, distinct bimodal aerosol spectra including Aitken mode
ŽD-100 nm and accumulation mode ŽD)100 nm were observed. For four time.
Ž . Ž . Ž .
Fig. 9. Averaged in-cloud partitioning fractions FN D at 19:45 a and 23:00 b on 961206. Error bars
Table 2
Microphysical parameters for the frontal non-precipitating cloud event on 961204
y3 y3 y3
Ž . Ž . Ž . Ž .
NRJ I cm NCVI cm FN FV LWCCVI mg m DVMD mm
a a
500–1000 F500 0.16 –0.55 0.40 –0.92 F450 11–13
a
LWC s50 mg my3. CV I
Ž . Ž .
periods, Fig. 11a–d gives 20-min averages of pre-cloud 13:00 , in-cloud 15:00, 18:00 ,
Ž . Ž . Ž
and post-cloud 20:30 size distributions of the interstitial RJI data and residual CVI
.
data particles. In addition, for the in-cloud size scans the sum of CVI plus RJI sampled size distributions is shown. The pronounced bimodal shape was retained after cloud dissipation but shows a slightly broader spectrum before cloud formation, particularly in the accumulation mode. This change is due to the possible temporal development of the aerosol size distribution outside this frontal cloud. The possibility of precipitation further upwind of the site may also have lead to the slight depletion of accumulation mode particles. In the cloud at 15:00 a large fraction of the accumulation mode appeared as residual particles while the Aitken mode largely remained in the interstitial phase. At 18:00, however, a number fraction of 37% of the Aitken mode was found in the residual particles of the evaporated cloud elements. To answer the question why a fraction of Aitken mode aerosol is incorporated into cloud elements while the accumulation mode did not completely become activated subsequently few simple scenarios based on equilibrium considerations are presented.
In a scenario of a size-dependent chemical composition of the aerosol population the Aitken mode with predominantly water-soluble particulate matter could grow beyond 5 mm, while a less hygroscopic fraction with less soluble matter in the accumulation mode may not activate. One may propose a scenario with an externally mixed aerosol
Ž .
population comprised of NH4 2SO4 and insoluble soot particles. Necessary peak
Ž . Ž .
supersaturations Kohler, 1926 to activate NH
¨
4 2SO4 particles of 30 or 40 nm in diameter are 1% and 0.7%, respectively. These high supersaturations on the Puy deŽ .
Dome may be realistic, according to recent modeling results Flossmann, 1998 with the
ˆ
ŽDEtailed SCAvenging and Microphysical Model DESCAM Flossmann et al., 1985,
.
1987 .
Cloud dynamic processes produce regions of significantly different supersaturations. Then different aerosol particles statistically experience different maximum supersatura-tions Smax inside the cloud. This will lead to a fractional activation of Aitken sizes while
Ž
a fraction of the accumulation mode sizes will not become activated Kaufman and
.
Tanre, 1994 .
´
Furthermore, a size-dependent chemical composition may create differences in the non-equilibrium kinetic effects leading to limited growth before droplet activation
Ž .
occurs. Chuang et al. 1997 showed that, e.g., a decrease in accommodation coefficients due to an organic coating in the small accumulation mode possibly allows a fraction of
Ž .
()
A.
Schwarzenboeck
et
al.
r
Atmospheric
Research
52
2000
241
–
260
255
Ž .
Fig. 11. DMPS number size distributions averaged over 20 min for the cloud event on 961204 for a
Ž . Ž . Ž . Ž . Ž .
pre-cloud 13:00 , b, c in-cloud 15:00, 18:00 , and d post-cloud 20:30 .
Finally, entrainment from airmasses above the level of maximum supersaturation can never be ruled out when the orography is an operative process in cloud formation as on Puy de Dome. In particular, entrainment might be the most significant contribution to
ˆ
explain the flattening of scavenging efficiencies towards larger particle sizes.
Lifetimes of cloud droplets in the stratocumulus cloud layer are estimated to be in the order of an hour. The main evidence that diffusion collection did not contribute to the residual number concentration came from the CVI data itself. Whereas in a first time
Ž .
window 15:00–15:45 small residuals were more or less absent, considerable numbers
Ž .
of Aitken mode residuals appear in a subsequent time window 15:45–16:30 . While on average CWC increased from 0.27 to 0.39 g my3 and residual number concentration
from 310 to 410 a cmy3, the mean volume droplet radius stayed constant around
( )
A. Schwarzenboeck et al.rAtmospheric Research 52 2000 241–260 257
Fig. 12. Hourly wind data of December 4th, 1996 from the Meteo France station Orcines le Puy de Dome. Theˆ
vertical line at 15:45 denotes the transition between the two time windows discussed in the text.
particles, 17% of 40 nm particles, and 26% of 30 nm particles are collected due to diffusion. Since such small particles are not seen during the first time window presumably in-cloud lifetimes were shorter, or more likely, Aitken mode particles after diffusion collection do not appear as secondary residual particles due to their solubility. Assuming similar in-cloud lifetimes and Aitken mode solubility for both time windows, we can exclude diffusion collection as the process leading to the observed small residual particles.
Meteorological data of Dec. 4th were supplied by Meteo France on an hourly base for the station Orcines le Puy de Dome. This mountain station is located on the summit very
ˆ
Ž . Ž . Ž .
Fig. 13. Averaged in-cloud partitioning fractions FN D at 15:00 a and 18:00 b on 961204. Error bars
close to our measurement site. From time window one to time window two the
Ž .
horizontal wind speed cf. Fig. 12 of air arriving at the meteorological station significantly increased by a factor of 2 to 2.5. As the airmass approaches the Puy de Dome the steep orography produces an updraft that linearly corresponds with the
ˆ
horizontal velocity. Since the updraft velocity scales with maximum supersaturations
Ž .
reached in the cloud Rogers and Yau, 1989; Pruppacher and Klett, 1997 the averaged activation diameter significantly dropped by several tens of nanometers as we proceed from time window one to time window two. Thus, we can claim nucleation scavenging as the factual process to explain Aitken mode residual particles within this cloud.
Ž .
Again, both in-cloud averages 15:00, 18:00 show an S-shaped partitioning fraction
Žcf. Fig. 13a,b . At 15:00, mostly accumulation mode particles were incorporated in.
cloud elements and the 50% partitioning diameter is at 115 nm. Around 18:00 it dropped to approximately 70 nm due to the additional activation of a significant fraction of the Aitken mode aerosol particles, a value which is lower than in previous reports for the investigated type of clouds.
4. Summary and conclusions
This work reports of a development of tools for the study of in-cloud partitioning and their field performance with real-time recording of microphysical quantities in the interstitial as well as the liquid phase. In a first step an optimized ground-based CVI was developed with a low cut size for a ground-based CVI. Along with this CVI, an interstitial phase RJI was designed for an upper cut size that closely matches the sampling characteristics of the CVI. Calibrations of both samplers verified the calculated lower cut sizes D50 at 4 mm, 5 mm, and 6 mm with excellent cut sharpness. The collection efficiencies increased from 10% to 90% within size ranges of less than 2mm.
Ž
For the first time a CVI was connected to a DMPS scanning between 25 nm and 850
.
nm to include the entire Aitken mode in the size measurements of residuals released from hydrometeors after evaporation.
During field measurements on the Puy de Dome, CVI measurements were checked
ˆ
by an airborne PVM-A. It could be concluded that there were no sampling artifacts, in particular no cloud element break-ups inside the CVI at the chosen wind tunnel velocities up to 150 m sy1. In most of the cloud events the accumulation mode
ŽD)100 nm disappeared to a large extent from the interstitial reservoir so that even.
Ž .
Aitken mode particles D-100 nm were found in the residual particles of the evaporated cloud elements. Excluding residual number contribution from collection scavenging, the dominant process to create small residuals was assumed to be nucleation scavenging. Residual size spectra demonstrated the significant role of CCNs far below 100 nm that cannot be neglected in cloud activation in clean to moderately polluted environments within high supersaturations. Fifty percent partitioning diameters down to 70 nm in diameter were found.
( )
A. Schwarzenboeck et al.rAtmospheric Research 52 2000 241–260 259
performance will be extended in future work coupling double or triple CVIs to mass
Ž .
spectrometry and electron microscopy for ice nuclei IN characterization.
Acknowledgements
Ž
The present study was supported by the European Commission contract number:
Ž . .
ENV4-CT95-0012 DG12-DTEE ; Cloud Ice Mountain Experiment .
References
Anderson, T.L., Charlson, R.J., Covert, D.S., 1993. Calibration of a counterflow virtual impactor at aerodynamic diameters from 1 to 15mm. Aerosol Sci. Technol. 19, 317–329.
Arends, B.G., Kos, G.P.A., Maser, R., Schell, D., Wobrock, W., Winkler, P., Ogren, J.A., Noone, K.J., Hallberg, A., Svenningsson, I.B., Wiedensohler, A., Hansson, H.-C., Berner, A., Solly, I., Kruisz, C., 1994. Microphysics of clouds at Kleiner Feldberg. J. Atmos. Chem. 19, 59–85.
Bigg, E.K., 1986. Discrepancies between observation and prediction of concentrations of cloud condensation nuclei. Atmos. Res. 20, 82–86.
Bower, K.N., Choularton, T.W., 1992. A parameterization of the effective radius of ice free clouds for use in global climate models. Atmos. Res. 27, 305–339.
Charlson, R.J., Vong, R., Hegg, D.A., 1983. The sources of sulfate in precipitation: 2. Sensitivity to chemical variables. J. Geophys. Res. 88, 1375–1377.
Choularton, T.W. et al., 1997. The Great Dun Fell cloud experiment 1993: an overview. Atmos. Environ. 31, 2393–2405.
Chuang, P.Y., Charlson, R.J., Seinfeld, J.H., 1997. Kinetic limitations on droplet formation in clouds. Nature 390, 594–596.
Flossmann, A.I., 1998. Personal communication. Laboratoire de Meteorologie Physique, Clermont-Ferrand,´ ´
France.
Flossmann, A.I., Hall, W.D., Pruppacher, H.R., 1985. A theoretical study of the wet removal of atmospheric pollutants: Part I. The redistribution of aerosol particles captured through nucleation and impaction scavenging by growing cloud drops. J. Atmos. Sci. 42, 583–606.
Flossmann, A.I., Pruppacher, H.R., Topalian, J.H., 1987. A theoretical study of the wet removal of
Ž .
atmospheric pollutants: Part II. The uptake and redistribution of NH4 2SO4 particles and SO2 gas simultaneously scavenged by growing cloud drops. J. Atmos. Sci. 44, 2912–2923.
Gerber, H., 1996. Microphysics of marine stratocumulus clouds with two drizzle modes. J. Atmos. Sci. 53, 1649–1662.
Gerber, H., Arends, B.G., Ackerman, A.S., 1994. New microphysics sensor for aircraft use. Atmos. Res. 31, 235–252.
Hallberg, A., Noone, K.J., Ogren, J.A., Svenningsson, I.B., Flossmann, A.I., Wiedensohler, A., Hansson, H.-C., Heintzenberg, J., Anderson, T., Arends, B., Maser, R., 1994. Phase partitioning of aerosol particles in clouds at Kleiner Feldberg. J. Atmos. Chem. 19, 107–127.
Harrington, J.Y., Meyers, M.P., Walko, R.L., Cotton, W.R., 1996. Parameterization of ice crystal conversion processes due to vapor deposition for mesoscale models using double-moment basis functions: Part I. Basic formulation and parcel model results. J. Atmos. Sci. 52, 4344–4366.
Hegg, D.A., 1983. The sources of sulfate in precipitation: 1. Parameterization scheme and physical sensitivi-ties. J. Geophys. Res. 88, 1368–1374.
Heintzenberg, J., Covert, D.S., 1990. On the distribution of physical and chemical particle properties in the atmospheric aerosol. J. Atmos. Chem. 10, 383–397.
Heintzenberg, J., Ogren, J.A., Noone, K.J., Gardneus, L., 1989. The size distribution of submicrometer¨
Kaufman, Y.J., Tanre, D., 1994. Effect of variations in supersaturation on the formation of cloud condensation´
nuclei. Nature 369, 45–48.
Kohler, H., 1926. Zur thermodynamik der kondensation an hygroskopischen kernen und bemerkungen uber¨ ¨
Ž .
das zusammenflieben der tropfen. Medd. Met. Hydr. Anst. Stockholm 3 8 .
Ž .
Marple, V.A., Willeke, K., 1976. Inertial impactor: theory, design and use. In: Liu, B.Y.H. Ed. , Fine Particles, Aerosol Generation, Measurement, Sampling, and Analysis. Academic Press, pp. 411–446. Martin, G.M., Johnson, D.W., Spice, A., 1994. The measurement and parameterization of effective radius of
droplets in warm stratocumulus clouds. J. Atmos. Sci. 51, 1823–1842.
Martinsson, B., Cederfeldt, S.-I., Svenningsson, B., Frank, G., Hannson, H.-C., Swietlicki, E., Wiedensohler, A., Wendisch, M., Gallagher, M.W., Colvile, R.N., Beswick, K.M., Choularton, T.W., Bower, K.N., 1997. Experimental determination of the connection between cloud droplet size and its dry residue size. Atmos. Environ. 31, 2477–2490.
Martinsson, B., Frank, G., Cederfeldt, S.-I., Swietlicki, E., Berg, O., Zhou, J., Bower, K.N., Bradbury, C., Birmili, W., Stratmann, F., Wendisch, M., Wiedensohler, A., Yuskiewicz, B., 1999. Droplet nucleation and growth in orographic clouds in relation to the aerosol population. Atmos. Res. 50, 289–315.
Noone, K.J., Charlson, R.J., Covert, D.S., Ogren, J.A., Heintzenberg, J., 1988. Design and calibration of a counterflow virtual impactor for sampling of atmospheric fog and cloud droplets. Aerosol Sci. Technol. 8, 235–244.
Noone, K.J., Hansson, H.-C., Mallant, R.K.A.M., 1992a. Droplet sampling from crosswinds: an inlet efficiency calibration. J. Aerosol Sci. 23, 153–164.
Noone, K.J., Ogren, J.A., Hallberg, A., Heintzenberg, J., Strom, J., Hansson, H.-C., Svenningsson, I.B.,¨
Wiedensohler, A., Fuzzi, S., Facchini, M.C., Arends, B.G., Berner, A., 1992b. Changes in aerosol size-and phase distributions due to physical size-and chemical processes in fog. Tellus 44B, 489–504.
Ogren, J.A., Heintzenberg, J., Charlson, R.J., 1985. In situ sampling of clouds with a droplet to aerosol converter. Geophys. Res. Lett. 12, 121–123.
Pruppacher, H.R., Klett, J.D., 1997. Microphysics of cloud and precipitation. D. Reidel, Dordrecht, 954 p. Rader, D.J., Marple, V.A., 1985. Effect of ultra-Stokesian drag and particle interception on impaction
characteristics. Aerosol Sci. Technol. 4, 141–156.
Rao, A.K., 1975. An experimental study of inertial impactors. PhD dissertation, Univ. of Minnesota, Minneapolis.
Rogers, R.R., Yau, M.K., 1989. A short course in cloud physics. Pergamon, New York, 293 pp.
Seinfeld, J.H., Pandis, S.N., 1998. Atmospheric chemistry and physics. From air pollution to climate change. Wiley, New York, 1326 pp.
Wendisch, M., Mertes, S., Heintzenberg, J., Wiedensohler, A., Schell, D., Wobrock, W., Frank, G., Martinsson, B.G., Fuzzi, S., Orsi, G., Kos, G., Berner, A., 1998. Drop size distribution and LWC in Po valley fog. Contrib. Atmos. Phys. 71, 87–100.