COMPARISON OF A FIXED-WING AND MULTI-ROTOR UAV FOR
ENVIRONMENTAL MAPPING APPLICATIONS: A CASE STUDY
M. A. Boon a b*, A. P. Drijfhout c S. Tesfamichael d
a Department of Zoology University of Johannesburg, PO Box 524 Auckland Park, 2006. b Kite Aerial Imagery (Pty) Ltd, 1422 Topaas Street, Waverley, 0186, South Africa - [email protected]
c United Drone Holdings (Pty) Ltd, South Africa - [email protected]
d Department of Geography, Environmental Management and Energy Studies University of Johannesburg Auckland Park, - [email protected]
Commission VI, WG VI/4
KEY WORDS: UAV, fixed-wing, multi-rotor, photogrammetry, environmental mapping, orthoimage, DSM
ABSTRACT:
The advent and evolution of Unmanned Aerial Vehicles (UAVs) and photogrammetric techniques has provided the possibility for on-demand high-resolution environmental mapping. Orthoimages and three dimensional products such as Digital Surface Models (DSMs) are derived from the UAV imagery which is amongst the most important spatial information tools for environmental planning. The two main types of UAVs in the commercial market are fixed-wing and multi-rotor. Both have their advantages and disadvantages including their suitability for certain applications. Fixed-wing UAVs normally have longer flight endurance capabilities while multi-rotors can provide for stable image capturing and easy vertical take-off and landing. Therefore, the objective of this study is to assess the performance of a fixed-wing versus a multi-rotor UAV for environmental mapping applications by conducting a specific case study.
The aerial mapping of the Cors-Air model aircraft field which includes a wetland ecosystem was undertaken on the same day with a Skywalker fixed-wing UAV and a Raven X8 multi-rotor UAV equipped with similar sensor specifications (digital RGB camera) under the same weather conditions. We compared the derived datasets by applying the DTMs for basic environmental mapping purposes such as slope and contour mapping including utilising the orthoimages for identification of anthropogenic disturbances. The ground spatial resolution obtained was slightly higher for the multi-rotor probably due to a slower flight speed and more images. The results in terms of the overall precision of the data was noticeably less accurate for the fixed-wing. In contrast, orthoimages derived from the two systems showed small variations. The multi-rotor imagery provided better representation of vegetation although the fixed-wing data was sufficient for the identification of environmental factors such as anthropogenic disturbances. Differences were observed utilising the respective DTMs for the mapping of the wetland slope and contour mapping including the representation of hydrological features within the wetland. Factors such as cost, maintenance and flight time is in favour of the Skywalker fixed-wing. The multi-rotor on the other hand is more favourable in terms of data accuracy including for precision environmental planning purposes although the quality of the data of the fixed-wing is satisfactory for most environmental mapping applications.
* Corresponding author
1. INTRODUCTION
A variety of Unmanned Aerial Vehicle (UAV) systems have become available in the recent years. The two most common types include fixed-wing and multi-rotor. Both with their advantages and disadvantages. Multi-rotors is easy to fly, take-off including landing and they can easily perform autonomous flights (Thamm et al., 2015). The multi-rotor flight time capability and therefore the area of coverage is however a limitation (Cai et al., 2014). Fixed-wing UAVs on the other hand have very good flight endurance and can cover large areas in one flight. They however require a suitable landing area including some skill by the pilot to land them softly to avoid damage to the craft and sensors. These state-of-the-art systems evolved at a considerable pace over the last years (Shahbazi et al., 2014). Off-the-shelf low cost equipment (Fritz et al., 2013) with sophisticated computer vision, robotics and geomatic engineering is available that can provide centimeter-level
resolution and accuracy products generated with low cost digital cameras (Colmina and Molina, 2014). The ability of UAVs to fly low with appropriate sensors provides the opportunity to complete scale-appropriate measurements in fine spatial resolution (Anderson and Gaston, 2013) and therefore make them ideal tools for environmental mapping.
Unmanned Aerial Vehicles were applied successfully for a variety of environmental/scientific applications which include for example ecological applications (Anderson and Gatson 2013, Mulero-Pázmány et al., 2015), topographical studies (Lucieer et al., 2013, Gonçalves and Hernriques 2015), geomorphology and hydrology (Flener et al., 2013, Hugenholtz et al., 2013, Javernick et al., 2014, Ouédraogo et al., 2014, Stöcker et al., 2015), vegetation (Dandois and Ellis, 2013, Zweig et al., 2015) and erosion (D’ Oleire-Oltmanns et al., 2012).
Tahar (2015) studied the use of a multi-rotor for slope mapping at different altitudes and reported accurate results even at relatively high altitudes. Coveney et al. (2017) used a Swinglet CAM delta wing platform to generate digital elevation models and orthoimagery for environmental applications. They specifically assessed the data accuracy and the potential for river flood risk modelling. They achieved accurate UAV data using adequate ground control points (GCPs) and derived good flood risk maps from the digital elevation models.
In previous studies we showed that UAV derived orthophotos, point clouds and digital surface models (DSMs) could significantly enhance environmental studies through the extraction of relevant information from these imagery (Boon et al., 2016a) and that these imagery could be used for rapid and accurate mapping of wetlands (Boon et al., 2016b). In this study, we evaluate the performance of a fixed-wing UAV versus a multi-rotor UAV for environmental mapping applications.
2. STUDY AREA
The study area is located on the Kameelzynkraal farm to the east of Pretoria in the Kungwini Local Municipal area, Gauteng Province, South Africa. The area includes a channelled valley-bottom wetland system (Figure 2). The total size of the study area was 17 ha although the actual UAV survey area included an area of approximately 50 ha. Large sections of the study area was transformed from its original benchmark condition due to various anthropogenic impacts within and upstream of the study area.
3. MATERIALS AND METHODS
The methodology can be divided into three phases as discussed in sections 3.1 to 3.3.
3.1 Site preparation, UAV systems and flight planning
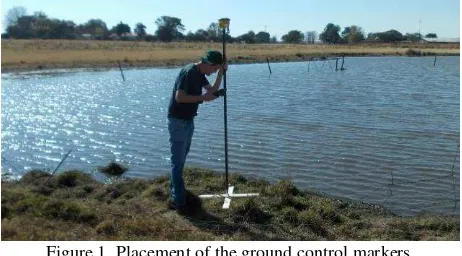
GCPs were positioned at the boundaries of the wetland including next to the watercourse (Figures 1 and 2) at different elevations (20 GCPs spread over the 17 ha area) using a Trimble (SPS985 GNSS GPS) survey system which had a differential horizontal accuracy and vertical accuracies within 0.25 and 0.5 m, respectively. The ground control markers consisted of 70 cm diameter white wooden crosses that were fixed to the ground with pegs. Two check points (CPs) that comprised of fixed land marks within the study area were further identified for verification of the positional and height accuracy of the derived UAV data (Figure 2).
A Skywalker fixed-wing UAV and an AKS Raven X8 multi-megapixels digital camera with a 16mm fixed lens was used on both UAVs. The camera settings and image properties for the fixed-wing and the multi-rotor was slightly different as shown in Table 1.
Figure 1. Placement of the ground control markers.
Figure 2. Ground control markers, checkpoints and position of the wetland.
Figure 3. The Skywalker fixed-wing UAV and the AKS Raven X8 multi-rotor UAV.
The UAV flight lines were calculated with Mission Planner software for the fixed-wing UAV and with DJI Ground Station software for the multi-rotor. The flight lines were spaced between 60-70 m apart which equated to an 80% forward overlap and a 60% side overlap for the fixed-wing and for the multi-rotor. The flying altitude determined for both UAV surveys was just over 200 m above ground level (AGL). The camera took a photograph every 2 s, triggered by the on-board flight controller on the multi-rotor UAV while the photos were triggered by distance on the fixed-wing UAV. No pre-calibration was performed on the camera. Automatic camera calibration was performed by PhotoScan as part of the image
Table 1. Camera settings and image properties The International Archives of the Photogrammetry, Remote Sensing and Spatial Information Sciences, Volume XLII-2/W6, 2017
Item Skywalker Raven UAV type fixed-wing multi-rotor
Motor 2820 920 kV 4014 400 kV
Environmental crash-float (epofoam) – 1 lipo battery
Difficult to retrieve/ 2 lipo batteries Table 2. Comparison of the two UAV setups
3.2 Data acquisition and 3D point cloud generation
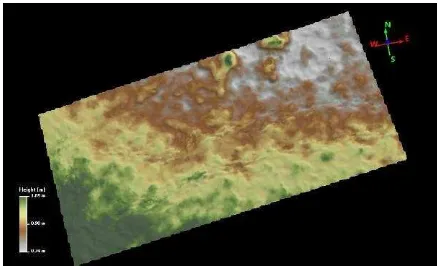
The UAV images were collected on an early summer morning in October 2016. One flight was required for the fixed-wing while two flights were required for the multi-rotor to cover the study area. The flights were undertaken in autopilot mode through the use of the ground station application with a live radio link which allowed real-time position information. The fixed-wing flight started at approximately 07h18 and lasted about 8.5 minutes to cover the study area. The multi-rotor flights started at approximately 07h56 with the total flight lasting about 8 minutes. The flights were undertaken in sunny weather conditions just after the early morning mist cleared-up. Table 3 provides details of the weather conditions.
Weather Sunny skies
The images taken were visually assessed on the basis of quality, viewing angle including overlap in order to remove any blurred and under- or over- exposed images before processing and analysis. The completely automated computer vision Structure from Motion (SfM) pipeline provided by Agisoft PhotoScan Professional Version 1.2 software package was used for 3D point cloud generation. The images and the text file with the GPS information were loaded into PhotoScan and the alignment completed using the reference pair selection option for the fixed-wing. The multi-rotor images did not include any GPS information and therefore a generic pair selection option was used. Sparse point clouds was created through this initial bundle adjustment. The GCPs and checkpoints determined with the Trimble were then imported into PhotoScan.
The images in these models were used to identify the 20 GCPs and recompute bundle adjustments to achieve geometrical precision and georeferencing accuracy. Two GCPs were left out completely of the processing chain for multi-rotor due to the indication of higher error in these particular GCPs in the pre-processing phase. The two checkpoints were also identified from the images but excluded from the bundle adjustment. Dense point clouds set to high reconstruction quality was then built and the depth filtering was set to mild. The automatic division of all the points into two classes - ground points and the rest was then performed. The ground points were then exported as a digital terrain model (DTM) removing all aspects that are above ground such as the buildings and vegetation. The final results were exported in various formats including point clouds (ASPRS LAS), orthophotos (GeoTIFF) and surface models (GeoTIFF elevation).
3.3 Analysis, data classification and interpretation
The data acquisition and quality (accuracy) was assessed for the images, orthophoto and 3D model generation. This step of the methodology further included analysis and interpretation of the UAV products. The derived datasets were compared by applying them to basic environmental mapping purposes such as slope and contour mapping including for verification of vegetation and anthropogenic disturbances such as erosion gullies.
4. RESULTS AND DISCUSSION
4.1 Data acquisition
Approximately 110 photographs were captured by the fixed-wing setup and used for the 3D point cloud generation while 184 photographs were captured by the multi-rotor but only 162 thereof used for the 3D point cloud generation. Figure 4 shows details of the initial camera positions for the different setups in relation to the position of the area of interest. Figure 5 depicts the camera positions including the amount of image overlap. The on-board triggering of the camera on the multi-rotor was at a much faster rate than with the fixed-wing which resulted in more images in the former case. This resulted in higher image overlap rate with the multirotor than with the fixed-wing; approximately 80% for the multi-rotor and 60% for the fixed-wing. This together with images that were not georeferenced led to a longer image processing time for the multi-rotor images in order to built the dense point cloud and derive an orthoimage and DSM.
a b
Figure 4. Details of the initial camera positions for the different setups (a) fixed-wing, (b) multi-rotor. Note the study area
(white polygon).
a
b
Figure 5. Camera positions and image overlaps. (a) fixed-wing (b) multi-rotor. The legend on the right represents the number
of images in which a point appears.
4.2 Data quality (accuracy)
We achieved significantly lower accuracies including ground spatial resolution in this study compared to previous UAV aerial surveys at the same study area where we achieved accuracies of up to 0.018m utilising a multi-rotor (Boon et al., 2016b). The results of the geometric accuracy in terms of root mean squared error (RMSE) of the data based on the 20 GCPs were 2 m for the total error and 2 m for the vertical (Z) error for the fixed-wing, and 0.20 m for the total and 0.13 m for the vertical (Z) error for the multi-rotor. Table 4 provides a summary of the errors (GCPs and CPs). Figure 6 shows the RMSE for the GCPs and the CPs. The most noticeable observation is that the total error is significantly higher for the fixed-wing compared to the multi-rotor which is mainly due to the high Z error in the fixed-wing data. The reason for the high Z error is possibly due to low image quality and too long exposure times because of the higher flight speeds. The GCP and CP error results of the multi-rotor is within a similar trend (range) except for the CP Z and the total error.
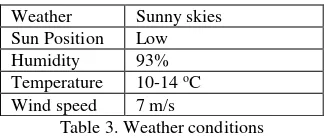
The identification of the GCPs was difficult in locations where they blended in with dry grass or other vegetation which had a similar colour (Figure 7).This could be a major contribution in less accurate data for both of the datasets. The accurate identification of the landmark CPs was problematic in both the fixed-wing and multi-rotor.
G
CP
Error (m) Skywalker fixed-wing
Raven multi-rotor
X 0.031 0.09
Y 0.074 0.11
Vertical (Z) 2 0.13
Total 2 0.20
CP
X 0.09 0.10
Y 0.05 0.20
Vertical (Z) 2.11 0.40
Total 2.11 0.46
Table 4. RMSE for the ground control and check points.
Figure 6. Graph of the RMSE (m) for the GCPs and CPs
a
b
Figure 7. Identification of GCPs (a) fixed-wing, (b) multi-rotor
4.3 Data analysis and interpretation
The ground spatial resolution of the multi-rotor data was slightly higher; 0.0529 m compared to 0.0537m obtained for the fixed-wing. Table 5 provides a comparison of the products derived from the UAV imagery.
UAV products
Skywalker fixed-wing
Raven multi-rotor
Point density 0.028/m² 0.030/m²
Orthoimage 0.054 m 0.053 m
DPC and
DSM 0.062 m 0.0565 m
Table 5. Summary of the UAV derived products
Visual analysis and comparison of the derived orthoimages indicate definite differences between the respective datasets. The multi-rotor orthoimage was slightly brighter in certain locations while the fixed-wing was brighter in other locations. Possibilities could be due to the slightly different time of the flights and also the use of different exposure settings. The multi-rotor imagery yielded a better representation of features such as the GCPs (Figure 7) including features such as trees (vegetation). Figure 8 shows vegetation (Acacia spp) where the
fixed-wing imagery (a) shows some deformities while in the multi-rotor imagery (b) the tree is well represented. These deformities can be attributed to either tree movement because of wind or too high exposure time on the fixed-wing camera.
a
b
Figure 8. Representation of vegetation in the (a) fixed-wing and (b) multi-rotor imagery.
Information about hydrological features such as erosion gullies was well represented in both datasets although there was still major differences between the two datasets. We clipped a small section of the DSMs that represent the head of an erosion gully including a small section of the gully channel itself. The visual comparison of the two datasets (Figure 9) clearly show the difference in elevation including small difference in the representation of the erosion gully.
Figure 10 indicates the difference between the two erosion gully datasets where we subtracted the fixed-wing DSM from the multi-rotor DSM. A vertical difference ranging from 0.74 m to 1.05 m is visible between the two datasets. A profile plot trough the head of the erosion gully further provides insight into the differences. Differences in the gully profile can also be noted; the fixed-wing DSM has a deeper and flatter gully base compared to the multi-rotor DSM that is more irregular (Figure 11). Knowing that the fixed-wing data have high Z (vertical) errors, the indication is that the multi-rotor representation of the erosion gully is more accurate. Shadows might have played a role although the particular gully is flat and open and face towards the east from where the sun was illuminating during the survey times.
a
b
Figure 9. Fixed-wing (a) compared to multi-rotor (b) gully DTM. Note the red lines that indicate the position of the gully
profile.
Figure 10. Difference between fixed-wing and multi-rotor gully DTM
Figure 11. Difference profile plot
Slope is an important factor in environmental planning. In wetland planning, the calculation of the slope (longitudinal profile) assist with determination of the terrain/landscape and hydrological integrity such as the vulnerability of a particular wetland to erosion.
Figure 12. Slope path used for computation of slope
We determined and compared the average wetland slope from the UAV derived DTMs for the fixed-wing and the multirotor. Figure 12 depicts the slope path that was used to compute the slope on the multi-rotor DTM.
The fixed-wing data indicate that the altitude of the study area ranged from 1564.5 to 1545 m.a.m.s.l. This equates to a height difference of 19.5 m from the head to the toe of the wetland which calculates to a slope of 1.7%. Altitude of the study area using the multi-rotor data ranged from 1560.5 to 1543 m.a.m.s.l. This equates to a height difference of 17.5 m from the head to the toe of the wetland which calculates to a slope of 1.59%. The height information differed with exactly 2 m between the two UAVs; this difference is equivalent to height error of data derived from the fixed-wing. Figure 13 shows the differences of the slope determination results.
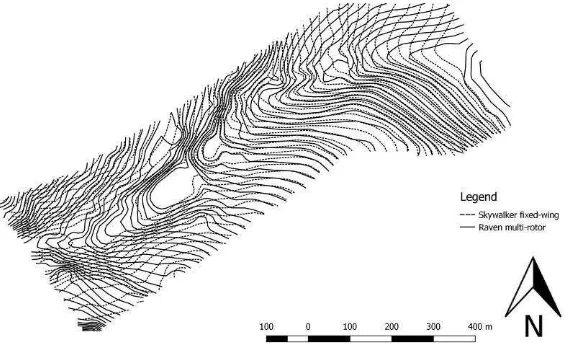
Good contour data is valuable for environmental planning. In wetland studies it assist with determination of the geomorphic setting of a specific wetland. Contours supply information about cross-sectional characteristics of a watercourse. Contour data are also valuable for environmental rehabilitation purposes. We derived 0.5 m contours from both the fixed-wing and the multi-rotor DTMs. The two contour datasets were similar although there were certain distinct differences (Figure 14). The fixed-wing contours is evener and indicating a shallower valley while the fixed-wing contour data indicate smaller profile changes and a more defined valley. With both contour datasets it is possible to determine profile changes including the position of the watercourse and the direction of flow.
Figure 13. Fixed-wing and multi-rotor slope determination.
Figure 14. Contour lines derived from the fixed-wing and multi-rotor data.
5. CONCLUSION
We compared the Skywalker fixed-wing and the Raven multi-rotor performance for environmental mapping purposes. The flights were undertaken on the same day equipped with the same sensor under the same weather conditions flying at a similar altitude of over 200 m. The performances of datasets derived from the two UAVs were compared. We further applied both datasets for the determination of specific environmental factors that included vegetation mapping, gully erosion characterization, and wetland slope and contours.
The results in terms of the overall precision of the datasets was not satisfactory especially comparing it to previous flight campaigns. Although the results were noticeably less accurate for Skywalker fixed-wing the following general lessons was learned for both UAV setups:
(i) Accuracies of the surveys were compromised due to early in the morning flights. Flights in the middle of the day when the position of the sun is higher result in less shadows in the data and also benefit from high amount of the sun’s illumination under clear sky conditions.
(ii) The placement of the GCPs and the CPs should be improved by ensuring, for example, that GCPs do not blend in with vegetation. The use of a grid formation when placing GCPs is advised. Instead of using landmarks for CPs we recommend using conventional markers the same as one would do when placing GCPs.
(iii) A flying altitude of below 150 m is advised for environmental mapping purposes to enhance the representation of features such as vegetation and erosion gullies in the imagery.
(iv) The self-calibration method for calibrating the camera prior to the flight should be investigated to improve the quality of the data.
(v) The camera settings such as the exposure should be standardised to achieve repeatable and comparable results.
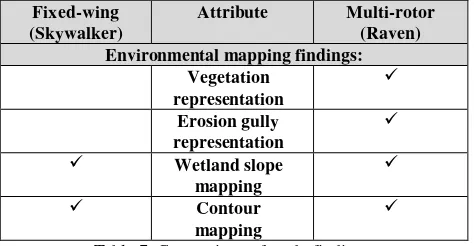
Variations were observed between the two datasets. Overall, the multi-rotor data was more accurate and better represented environmental features. Nevertheless, the basic identification and estimation of environmental impacts from the fixed-wing data was still satisfactory. Factors such as cost, maintenance and flight time favour the use of fixed-wing (Skywalker) while the multi-rotor (Raven) is more favourable if accuracy of environmental planning is the target of interest. For other applications not assessed in this study like close proximity inspections and when more detailed data is required for smaller areas to enhance land surveying, a multirotor will definitely be more suitable. We conclude by a simple comparison of our study findings (a tick indicate that it is more favourable):
Fixed-wing
Table 7. Comparison of study findings
ACKNOWLEDGEMENTS
We would like to thank United Drone Holdings (PTY) Ltd who provided the equipment and resources to complete the surveying for this project including for partially funding the conference attendance. University of Johannesburg (UJ) Department of Geography, Environmental Management and Energy Studies for partially funding the conference attendance.
REFERENCES
Anderson, K., and Gaston, K.J., 2013. Lightweight unmanned aerial vehicles will revolutionize spatial ecology. Frontiers in
Ecology and the Environment, 11(3), pp. 138–146.
Boon, M.A., Greenfield, R. and Tesfamichael, S., 2016. Wetland Assessment using Unmanned Aerial Vehicle (UAV) Photogrammetry. International Archives of the Photogrammetry, Remote Sensing and Spatial Information Sciences, 41, pp. 781-788.
Boon, M.A., Greenfield, R., and Tesfamichael, S., 2016. Unmanned Aerial Vehicle (UAV) photogrammetry produces accurate high-resolution orthophotos, point clouds and surface models for mapping wetlands. South African Journal of
Geomatics, 5(2), pp. 186-200
Cai G., Dias J., and Seneviratne, L., 2014. A survey of small-scale unmanned aerial vehicles: Recent advances and future development trends. Unmanned Systems 2, 02, pp.175-199, 2(02), 175-199.
Colomina, I., and Molina, P., 2014. Unmanned aerial systems for photogrammetry and remote sensing: A review. ISPRS
Journal of Photogrammetry and Remote Sensing, 92, pp. 79-97.
Coveney, S., and Roberts, K., 2017. Lightweight UAV digital elevation models and orthoimagery for environmental applications: data accuracy evaluation and potential for river flood risk modelling. International Journal of Remote Sensing,
38(8-10), pp. 3159-3180.
Dandois, J. P., and Ellis, E. C., 2013. High spatial resolution three-dimensional mapping of vegetation spectral dynamics using computer vision. Remote Sensing of Environment, 136,
pp. 259-276.
d'Oleire-Oltmanns, S., Marzolff, I., Peter, K. D., and Ries, J. B., 2012. Unmanned aerial vehicle (UAV) for monitoring soil erosion in Morocco. Remote Sensing, 4(11), pp. 3390-3416.
Gonçalves, J.A., and Hernriques, R., 2015. UAV photogrammetry for topographic monitoring of coastal areas. The International Archives of the Photogrammetry, Remote Sensing and Spatial Information Sciences, Volume XLII-2/W6, 2017
ISPRS Journal of Photogrammetry and Remote Sensing, 104,
pp. 101-111.
Flener, C., Vaaja, M., Jaakkola, A., Krooks, A., Kaatinen, H., KukKo, A., Kasvi, E., Hyyppa, H., Hyyppa, J., and Alho, P., 2013. Seamless Mapping of River Channels at High Resolution Using Mobile LiDAR and UAV-Photography. Remote Sens, 5, pp.6382-6407.
Fritz, A., Kattenborn, T., and Koch, B., 2013. UAV-based photogrammetric point clouds—Tree stem mapping in open stands in comparison to terrestrial laser scanner point clouds.
International Archives of the Photogrammetry, Remote Sensing
and Spatial Information Sciences, 40, pp. 141-146.
Hugenholtz, C.H., Whitehead, K., Brown, O.W., Barchyn, T.E., Moorman, B.J., LeCliar, A., Riddell, K., and Hamilton, T., 2013. Geomorphological mapping with a small unmanned aircraft system (sUAS): Feature detection and accuracy assessment of a photogrammetrically-derived terrain model.
Geomorphology, 194, pp. 16-24.
Javernick, L., Brasington, J., and Caruso, B., 2014. Modeling the topography of shallow braided rivers using Structure-from-Motion photogrammetry. Geomorphology, 213, pp. 166-182.
Lucieer, A., Turner, D., King, D., and Robinson, S., 2013. Using an Unmanned Aerial Vehicle (UAV) to capture micro- topography of Antarctic moss beds. International Journal of
Applied Earth Observation and Geoinformation, 27, pp. 53-62.
Mulero‐Pázmány, M., Barasona, J. Á., Acevedo, P., Vicente, J., & Negro, J. J., 2015. Unmanned aircraft systems complement biologging in spatial ecology studies. Ecology and evolution,
5(21), pp. 4808-4818.
Ouédraogo, M., Degré, A., Debouche, C., and Lisein, J., 2014. The evaluation of unmanned aerial system-based photogrammetry and terrestrial laser scanning to generate DEMs of agricultural watersheds. Geomorphology, 214, pp.
229-355
Shahbazi, M., Théau, J., and Ménard, P., 2014. Recent applications of unmanned aerial imagery in natural resource management. GIScience & Remote Sensing, 2014, pp. 1-27
Stöcker, C., Eltner, A., and Karrasch, P., 2015. Measuring gullies by synergetic application of UAV and close range photogrammetry – A case study from Andalusia, Spain. Catena,
132, pp.1-11
Tahar, K. N., 2015. Multi rotor uav at different altitudes for slope mapping studies. The International Archives of Photogrammetry, Remote Sensing and Spatial Information Sciences, 40, pp. 9-16.
Thamm, H. P., Brieger, N., Neitzke, K. P., Meyer, M., Jansen, R., & Mönninghof, M., 2015. SONGBIRD-an innovative UAS combining the advantages of fixed wing and multi rotor UAS.
International Archives of the Photogrammetry, Remote Sensing & Spatial Information Sciences, 40, pp. 345-249
Zweig, C.L., Burgess, M.A., Pecival, H.F., and Kitchens, W.M., 2015. Use of Unmanned Aircraft Systems to Delineate Fine- Scale Wetland Vegetation Communities. Wetlands, 35,
pp.303-309.