IDENTIFICATION OF A ROBUST LICHEN INDEX FOR THE DECONVOLUTION OF
LICHEN AND ROCK MIXTURES USING PATTERN SEARCH ALGORITHM
(CASE STUDY: GREENLAND)
S. Salehi a, b *, M. Karami a, R. Fensholt a
a
Department of Geosciences and Natural Resource Management, University Of Copenhagen - (sara.salehi, moka, rf)@ign.ku.dk b
Department of Petrology and Economic Geology, Geological Survey of Denmark and Greenland, Copenhagen, Denmark - [email protected]
Special Sessions, SpS16 - EARSeL
KEY WORDS: Hyperspectral Remote Sensing, Mineral Exploration, Geological Mapping, Spectral Mixture Analysis, Spectrometry, Lichen
ABSTRACT:
Lichens are the dominant autotrophs of polar and subpolar ecosystems commonly encrust the rock outcrops. Spectral mixing of lichens and bare rock can shift diagnostic spectral features of materials of interest thus leading to misinterpretation and false positives if mapping is done based on perfect spectral matching methodologies. Therefore, the ability to distinguish the lichen coverage from rock and decomposing a mixed pixel into a collection of pure reflectance spectra, can improve the applicability of hyperspectral methods for mineral exploration. The objective of this study is to propose a robust lichen index that can be used to estimate lichen coverage, regardless of the mineral composition of the underlying rocks. The performance of three index structures of ratio, normalized ratio and subtraction have been investigated using synthetic linear mixtures of pure rock and lichen spectra with prescribed mixing ratios. Laboratory spectroscopic data are obtained from lichen covered samples collected from Karrat, Liverpool Land, and Sisimiut regions in Greenland. The spectra are then resampled to Hyperspectral Mapper (HyMAP) resolution, in order to further investigate the functionality of the indices for the airborne platform. In both resolutions, a Pattern Search (PS) algorithm is used to identify the optimal band wavelengths and bandwidths for the lichen index. The results of our band optimization procedure revealed that the ratio between R894-1246 and R1110 explains most of the variability in the hyperspectral data at the original laboratory resolution (R2=0.769). However, the normalized index incorporating R1106-1121 and R904-1251 yields the best results for the HyMAP resolution (R2=0.765).
1. INTRODUCTION
Lithological mapping using remote sensing depends, in part, on the identification of rock types by their spectral characteristics. The potential for rock type and mineral identification benefits from an understanding of the way in which surface processes modify those spectral characteristics. One of the important factors which merit consideration is the presence of organic growth, such as lichens on the rock surface.
Lichens can be found from arctic and subarctic to tropical regions and are particularly well adapted to extreme environmental conditions. In arctic regions of the world, lichen cover can be so extensive that only a small portion of the rock's surface is exposed. Consequently, any acquired imagery and the related brightness values represent some unknown combination of rock and biologic material. More specifically, the spectrum of a lichen covered rock surface can be significantly different from the spectrum of bare rock, depending on the spectral contrast between the lichen and the rock substrate. The presence of lichen can increase, decrease or have little effect on the spectral reflectance of the rock surface (Satterwhite et al., 1985).
Much of the existing knowledge on the reflectance spectra of lichens corresponds to the spectral resolution of multispectral airborne and spaceborne imaging systems such as Landsat MSS and TM sensors (Ager and Milton, 1987; Leverington and Moon, 2012) and Airborne Thematic Mapper (ATM) (Grebby et al., 2014). Evidently, more information is potentially
available from high-resolution spectra of hyperspectral imagery. Hyperspectral remote sensing systems are becoming more readily available, increasing the ability to map different land-cover units through end-member and spectral unmixing analyses (Rogge et al., 2006; Rogge et al., 2007; Sheng et al., 2015). Such high resolution dataset provides more flexibility for optimal selection of wavebands for discriminating between different land-cover types and lichens (Laakso et al., 2015). However, rather limited hyperspectral data are currently available for studies of arctic and subarctic lichens. The first major data set was published by Rivard and Arvidson (1992), who conducted field observations over the range 450 to 2400 nm to obtain in situ spectra of different exposed lithologic units. The survey included measurements of gneiss, granite, anorthosite, and amphibolite rocks on the west coast of Greenland. Their research illustrated that the spectra of bare amphibolite and tonalite substrates were significantly altered by lichen cover as they were rather flat and featureless. Rollin et al. (1994) investigated the influence of weathering and lichen cover on the reflectance spectra of granitic rocks over visible and infrared wavelengths. They concluded that all the lichen affected spectra showed identical diagnostic absorption features in the shortwave infrared region (SWIR). They further suggested that these features, which were found to occur only in the spectra of lichen covered surfaces, were potentially useful for lichen identification by spectral measurements from satellite or airborne sensors.
lichen effects and to minimize their effect by mapping varying lichen abundances on rock exposures. Ager and Milton (1987) suggested band ratios of TM3:TM4 and TM5:TM2 from laboratory modelling to minimize lichen effects in TM images.
Bechtel et al. (2002) suggested a set of spectral indices to discriminate lichens and a set of spectral indices to guide the selection of a single lichen end-member for use in the Spectral Mixture Analysis (SMA) of rock and lichen. Discrimination of different lichen species was conducted by using ratios of reflectance at 400/685 and 773/685 nm. An index using the band ratios 2132/2198 and 2232/2198 nm showed the similarity of lichen spectra in the SWIR and a distinguishing feature between rocks with hydroxide bearing minerals and lichens. However, it was emphasized that not all lichen species is likely to be distinguished using this approach as the study was based on a limited number of lichen samples (three grey – black crustose species). It was concluded that a much larger number of lichen samples, from various study sites, should be measured and compared using the ratio of reflectance at 400/685 nm against 773/685 nm to evaluate the ability to separate lichens by species at these wavelengths.
A recent study carried out by Li et al. (2015) showed that rock substrates covered by lichens are characterized by multiple lichen related absorption and reflection features. They demonstrated that lichen growth is one of the major factors controlling spectra of Tenerife lava surfaces and therefore tested several spectral indices to estimate lichen coverage at both site and spot scales. Their focus was in particular on the increase in reflectance from 680 to 1320 nm and the decreases from 1660 to 1725 nm and from 2230 to 2300 nm and their results showed that indices using 1660 and 1725 nm generally performed better. They further discussed that 2230 and 2300 nm have a very strong correlation with the lichen coverage but the use of wavelengths in the SWIR region from remotely sensed platforms is overshadowed by the high sensitivity to varying atmospheric conditions. As normalization helps to minimize the effects of variable illumination conditions and no differences between the ratio and normalized difference indices using 1660 and 1725 nm was observed in their study, they concluded that a normalized difference index using 1660 and 1725 nm is better in characterizing the relationship between spectral signatures of lava surfaces and surface lichen coverage. The lichen index was then applied to Hyperion imagery of their study area for mapping lichen coverage on lava surfaces.
This study was motivated by the fact that the presence of lichens may affect the interpretation of mineralogy. Deconvolution of the effect of spectral mixing of rocks and lichens through spectral unmixing methodologies is thus an essential step for improving the applicability of hyperspectral methods for mineral exploration. Our objective is to identify a robust lichen index for the deconvolution of lichen and rock mixtures using a pattern search algorithm (PS). We have selected the 350–2500 nm spectral range because of its relevance to many current hyperspectral remote sensing systems and that much of the analysis of hyperspectral data for geological application is based upon the detection and identification of important OH features that occur in minerals within this range. The results of this study are expected to have a significant implication for the analysis of satellite or airborne remote sensing imagery. The proposed infrared ratios applied to the analysis of hyperspectral data can provide a simple means to reduce the effect of varying lichen abundances covering rock exposures. Such information is vital to the interpretation of remote sensing data acquired in areas having abundant
lichen-covered outcrops. In this context, changes induced by different percentage of lichen cover in the spectra shape of common rock forming minerals have been simulated using laboratory spectroscopic data obtained from lichen covered samples collected from Karrat, Liverpool Land and Sisimiut areas in Greenland. Synthetic linear mixtures of pure rock and lichen spectra with prescribed mixing ratios are then examined in order to investigate the performance of three index structures of ratio, normalized ratio and subtraction. Location and width of absorption features are parameters that were examined during this study for both laboratory spectroscopic resolution and HyMAP resolution.
2. STUDY AREA
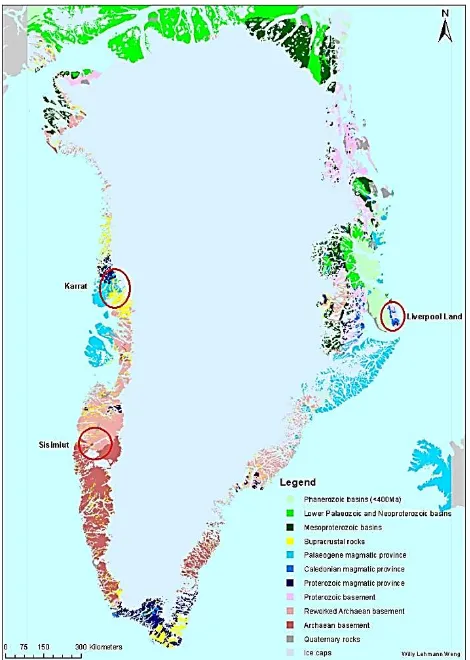
Greenland is the largest island in the world, surface of which is covered by about 80 per cent of the Inland Ice. The largest part of the ice-free area is made up of crystalline rocks of the Precambrian shield. The land surface of Greenland is a glaciated terrain, often with pronounced topography in places displaying alpine landforms with partial ice and snow cover. The action of glaciers and ice sheets during and since the Quaternary glaciations resulted in extensive areas of well exposed rocks. However, the well exposed geology is to a variable extent covered by the crusts of lichens which complicate the spectral mapping of the minerals and lithologies. For the purpose of this study lichen bearing rock samples were collected from Liverpool Land (Central East), Karrat (Central West), and Sisimiut (South West) areas in Greenland.
The geology of central East Greenland is dominated by the N–S orientated Caledonian Fold Belt formed by the collision between Laurentia and Baltica 465–400 million years ago (Higgins et al., 2004). Liverpool Land forms a c. 3500 km2 horst of Caledonian crystalline rocks separated from the post-Caledonian Jameson Land sedimentary basin to the west by a major N–S-oriented fault zone. The crystalline complex of North Liverpool Land is composed of Precambrian, marble bearing metamorphic rocks and granites–quartz-monzonites of Caledonian or Neoproterozoic age belonging mainly to the Hagar Bjerg thrust sheet (Coe and Cheeney, 1972). The Monzonite sample studied in this paper has been collected from this region.
The Karrat group in west Greenland comprises three main formations i.e. the Mârmorilik, Qeqertarssuaq, and Nukavsak formations (St-Onge et al., 2009). The Qeqertarssuaq Formation is a metasedimentary sequence consisting of semipelitic to pelitic schist, quartzite, and quartzitic schist (Escher and Pulvertaft, 1976). This area has been selected to collect the quartzite sample (Figure 1).
Figure 1. Geology Map of Greenland at scale 1:500.000 and the Locations of the Collected Samples
3. METHODOLOGY 3.1 Laboratory Spectral Measurements
All spectral measurements were made with a FieldSpec®3 HiRes (hereafter referred to ASD) Spectroradiometer that records 2151 channels within the 350-2500 nm wavelength range with a spectral resolution of 3 nm @ 700 nm, 8.5 nm @ 1400 nm, 6.5 nm @ 2100 nm and a sampling interval of 1.4 nm @ 350-1050 nm and 2 nm @ 1000-2500 nm.
All measurements were conducted using a contact probe device which contains its own light source. Use of a contact probe provides consistent illumination conditions during data acquisition and ensures measuring the spectra of pure patches of lichen species. Radiance values were converted to reflectance values by calculating the ratio of the radiance of the sample to the radiance of a 99% reflective reference panel (Spectralon, SRT-99-050, Labsphere, North Sutton, NH, USA) under the same illumination and viewing conditions (Bruegge et al., 1993). Dark current and white reference measurements were repeated for each rock sample. Each spectrum acquired in laboratory consists of 25 individual measurements recorded consecutively and averaged by the ASD instrument.
Two sets of measurements were collected from lichen-free weathered surfaces of each rock sample and from lichens on weathered surfaces. The first set of measurements was collected from 5 lichen-free, weathered surfaces of each sample. The second set of measurements was acquired from lichens of
different colours to account for possible inter-species spectral variation for each sample. The measured surface in each case is approximately 10 mm determined by the diameter of the contact probe. These measurements were used to generate synthetic mixtures (Section 3.2), and subsequently identify the optimal band wavelengths and bandwidths for the lichen index (Section 3.3).
3.2 Modelling the Impact of Lichen on the Spectra of the Rock Substrate Using Synthetic Linear Mixture Analysis Due to the presence of lichen cover at length scales of a meter or greater, the majority of pixels in the remotely sensed imagery will encompass mixtures of bare rock/soil and lichen. To quantify the effects of sub-pixel lichen cover on the spectra of the lithologies, and assess its impact on remotely sensed mapping, synthetic reflectance spectra were generated by mixing the representative spectra of the lithologies with the spectra of common lichen types using a spectral mixing technique. The principle of spectral (un)mixing is that the resulting spectrum for an image pixel containing a mixture of several distinct materials will be a linear combination of their signatures (Kruse et al., 1993). The assumption of linear mixture of lichens and rock substrate is reliable as lichens prevent transmission of light to the underlying rock substrate (Ager and Milton, 1987; Bechtel et al., 2002).
ASD spectral measurements of the lichen-covered surfaces were averaged separately for each rock type, to create a single spectral representation of lichen for specific rock substrates (Śr), (Figure 2). The same procedure was repeated for each rock type to produce a representation of the lichen-free weathered surfaces (Sr). These averaged spectra were then used to generate
linear spectral mixtures of lichen and rock for each substrate with 1% intervals:
Rb = fSrb + (1- f)Śrb (1)
Where Srb = reflectance spectrum of rock type r at band b Śrb = reflectance spectrum of lichen type r at band b f = relative proportion of lichen
Subject to:
f ∈ {0.01, 0.02, 0.03, …, 0.99, 1} (2)
3.3 Lichen Spectra Characteristic
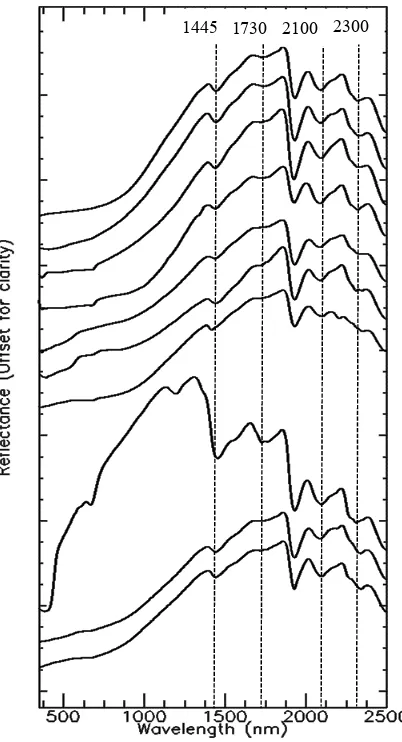
Lichen reflectance increases steadily in the range 700-1400 nm and remains high at longer wavelengths (Figure 2). This steady increase is distinctly different from the reflectance curve of vascular plants, characterized by an abrupt increase from the visible to the near infrared and decreases slowly from 800 to 1300 nm (Ager and Milton, 1987).
Figure 2. The averaged ASD spectral measurements used as representation of pure lichen spectra
3.3.1 Optimization of Lichen Index: In order to estimate the lichen coverage, the performance of three different index formulations is analysed:
����'()*= �)-.)/ − �)1.)2 (3)
����34*56= 789:8; 78<:8=
(4)
����>63?=
789:8;.78<:8= 789:8;@78<:8=
(5)
Where Rb1-b2 and Rb3-b4 are the average reflectance of the
spectral mixture from band b1 to b2 and from band b3 to b4, respectively. Figure 3 depicts two of the samples used for analysis, one with a 0.68 fraction of lichen, and the other without any lichen. In this case and given the b1 to b4 values, a simple INDXratio can be calculated for each spectrum by
averaging the reflectance from 894 to 1247 nm, and dividing this value by the reflectance in 1111 nm.
Figure 3. Schematic representation of the averaging concept used for index calculations
Our aim is to find band wavelengths [b1, b2, b3, b4] in a way that INDX can be used for estimation of the corresponding f for the spectra. However, since we know that the values of INDX
might also need rescaling to directly estimate f— which always has a value between 0 and 1— we introduce rescaling coefficients p1 and p2 as well:
����'()*= �-. �)-.)/− �)1.)2 + �/ (6)
����34*56= �-. 789:8; 78<:8=
+ �/ (7)
����>63?= �-. 789:8;.78<:8=
789:8;@78<:8= + �/ (8)
We generated a total number of 1010 mixed spectra from various rock types and with known f values (section 3.2). These samples are used as training and validation datasets to find the optimal values for b1, b2, b3, b4, p1, and p2, in a way that the
Root Mean Squared Error (RSME) in estimating the respective f
is minimized. The objective function for such optimization problem can thus be written as:
minZ()1,)2,)3,)4,J1,J2)=
(LM.NOPQM)2 R
MS1
O (9)
Subject to:
i = {1, 2,…, N} (10)
b2 ≥ b1 (11)
b4 ≥ b3 (12)
350 ≤ b1, b2, b3, b4 ≤ 2500 (13)
Where Z = RMSE of the lichen fraction estimation to be minimized
fi = expected lichen fraction for each sample i
INDXi = lichen fraction estimate for sample i which
can be calculated based on INDXsubt, INDXratio, or
INDXnorm
Indices b1 b2 b3 b4 p1 p2 R2 RMSE
INDXsubt 894 1237 1116 1117 -35.7486 0.0038 0.7455 0.1472
INDXratio 894 1247 1110 1110 -9.4092 9.4481 0.7696 0.14
INDXnorm 883 1258 1114 1114 -16.8114 0.0505 0.7666 0.1409
Table 1. Optimized band wavelengths and scaling coefficients for three different indices (original resolution)
Indices b1 b2 b3 b4 p1 p2 R2 RMSE
INDXsubt 0.92 1.208 1.106 1.121 -36.2673 -0.0032 0.736 0.1496
INDXratio 0.846 1.208 0.983 1.251 -4.7257 4.7187 0.726 0.1525
INDXnorm 1.106 1.121 0.904 1.251 19.9579 0.0552 0.765 0.1413
Table 2. Optimized band wavelengths and scaling coefficients for three different indices (HyMAP resolution)
Obviously, the optimal parameter values would be different for
INDXsubt, INDXratio, and INDXnorm and the optimization
procedure is run separately for each formulation, and the results are compared.
The optimization problem described above cannot be solved though gradient-based methods as Z is a discrete, nonlinear function. Here, we used a direct search approach, namely Pattern Search algorithm (PS), to find the optimal parameter values. PS is a sequential search procedure for finding the optimal value of nonlinear functions with nonlinear constraints for which the gradients of the function and the constraints are either unknown or unreliable (Kolda et al., 2003). The search starts with a local exploration in small steps in the multi- dimensional space around the starting point, called mesh. If the exploration is successful in finding a more optimal function value, the exploration process continues from around the newly found location; if it fails the step-size is reduced. The process of search continues until the algorithm reaches its termination conditions (Li and Rahman, 1990). The termination conditions for the algorithm can be a certain threshold on the size of the steps, or the number of iterations, whichever occurs first. There are a number of implementations of the pattern search algorithm available through MATLAB’s pattern search solver. The two search algorithms used in this study are generalized pattern search (GPS) algorithm as the poll method, and the mesh adaptive search (MADS) algorithm as the complete search method.
4. RESULTS AND DISCUSSION 4.1 Laboratory Spectroscopic Resolution
The band wavelengths and scaling coefficients are identified by PS. Table 1 presents the optimized coefficients for each function structure, along with the coefficient of determination (R2) and RMSE of the estimated lichen fractions. The estimation errors as well as the approximate wavelengths of the bands for the three indices are found to be very similar for the indices. The most significant difference between the three is observed for the optimized scaling coefficients p1 and p2.
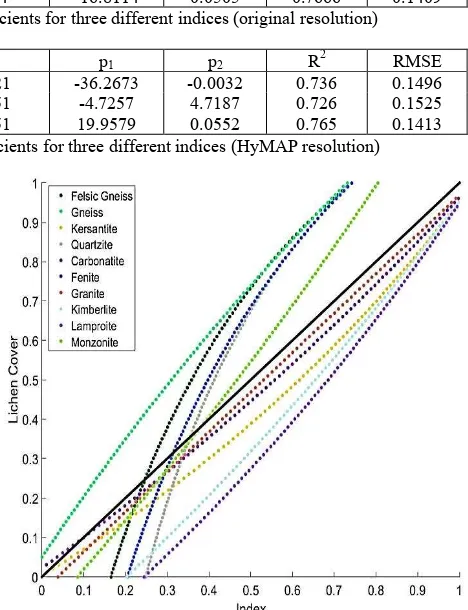
Figure 3 illustrates the validation of the optimized INDXratio
through a linear regression between the expected lichen fractions and the indices calculated from the spectra (n=1010,
R2=0.7695, RMSE=0.14). The optimization algorithm has been relatively successful in concentrating the data-points associated with various rock-types and with different lichen cover fractions around the 1:1 line, thus establishing a fairly linear relationship between the proposed index and the lichen coverage.
Figure 3. The linear fit between the optimized INDXratio and the
expected f values.
With regards to the deficiencies of the index, the lichen cover is underestimated for felsic gneiss, gneiss, quartzite, and fenite for mixture ratios of more than 0.3 (Figure 3). Nonetheless, it must be kept in mind that given the different spectral responses of various rock types, a trade-off is expected between the robustness of the index in terms of its applicability irrespective of the substrate composition on one hand, and the performance for the deconvolution of specific mixtures on the other. By narrowing the training dataset to a limited number of rock types, the algorithm can be allowed to converge around the specific wavelengths that are sensitive to the presence of lichen on a given rock surface. However, this will result in the loss of sensitivity, or false estimates for the remaining rock types.
4.2 Comparison with HyMAP Resolution
Synthetic spectral mixing analysis enables the theoretical effects of lichen on the spectra of the lithologies to be studied. The relevance of the modelled effects above with respect to those in the HyMAP resolution was determined by computing the response of the spectra-derived band ratio, normalized ratio and subtraction for each lithology.
modification in Eq. 13 based on HyMAP band wavelengths. The optimized coefficients and the goodness of fit are presented in Table 2, with INDXnorm showing slightly better results when
compared to INDXsubt and INDXratio. Overall, the RMSE values
for the three indices are not substantially different compared to those of the original-resolution dataset in Table 1.
5. CONCLUSIONS
The potential for lithological mapping in arctic terrains will benefit from high spectral resolution offered by imaging spectrometry systems. However, interpretation of such data will also require analysis of subpixel mixture of rock and lichen elements. Different percentage of lichen coverage can mask and/or shift the diagnostic spectral features of materials of interest causing erroneous rock type classification. This study elucidates the impact of lichen cover on spectral recognition of the lithologies through synthetic linear spectral mixing analysis. The aim of the study was to identify spectral indices that can directly reflect the mixture ratio of the rock and lichen in hyperspectral data. To achieve this, a number of index structures were prescribed to an optimization algorithm, which was tasked to find the best values for the location of the bands along the reflectance spectra (350-2500 nm).
The results of this study have important implications for the geological analysis of airborne/spaceborne hyperspectral data where rock encrusting lichens partially obscure exposed bedrock.
The proposed indices proved to be robust to the type of the substrate rock and were all able to estimate the lichen coverage with acceptable, albeit varying, levels of error. Although the indices could be further optimized to estimate the lichen coverage fractions for specific rock lithologies with higher accuracy levels, the proposed indices are remarkable in the fact that their performance is independent of the type of the substrate rocks.
Furthermore, the proposed methodology for the index optimization has the advantage of not requiring a priori
knowledge about the exact effects of lichens—or any other substance—on the reflectance of the mixtures. Instead, this information is implicitly extracted, via an automated trial and error process. Therefore, besides the lichen-covered rocks, this technique can be beneficial for identification of sensitive bands and indices for deconvolution of any mixture spectra, whether laboratory experiments. Remote Sensing of Environment, 82(2-3), pp. 389-396.
Bruegge, C., Stiegman, A., Rainen, R., and Springsteen, A., 1993. Use of Spectralon as a diffuse reflectance standard for in-flight calibration of earth-orbiting sensors. Optical Engineering, 32, pp. 805-814.
Coe, K., and Cheeney, R.F., 1972. Preliminary results of mapping in Liverpool Land, East Greenland. Report no. 48, pp. 7-20, Grønlands Geologiske Undersøgelse.
Escher, A., and Pulvertaft, T.C.R., 1976. Rinkian mobile belt of West Greenland. In: Escher, A., and Watt, W.S., (eds): Geology of Greenland. Geological Survey of Greenland, Copenhagen, pp. 104–119. architecture of the East Greenland Caledonides 72°–75°N.
Journal of the Geological Society (London), 161(6), pp. 1009-1026.
Jensen, S.M., Hansen, H., Secher, K., Steenfelt, A., Schjøth, F., and Rasmussen, T.M., 2002. Kimberlites and other ultramafic alkaline rocks in the Sisimiut-Kangerlussuaq region, southern West Greenland. Geology of Greenland Survey Bulletin, 191, pp. 57-66.
Jensen, S.M., Secher, K., Rasmussen, T.M., Tukiainen, T., Krebs, J.D., and Schjøth, F., 2003. Distribution and magnetic signatures of kimberlitic rocks in the Sarfartoq region, southern West Greenland. 8th International Kimberlite Conference, Victoria, British Columbia, Canada, Poster.
Kruse, F.A., Lefkoff, A.B., Boardman, J.W., Heidebrecht, K.B., Shapiro, A.T., Barloon, P.J., Goetz, A.F.H., 1993. The Spectral Image-Processing System (SIPS)—Interactive visualization and analysis of imaging spectrometer data. Remote Sensing of Environment, 44(2-3), 145–163.
Kolda, T.G., Lewis, R.M., and Torczon V., 2003. Optimization by direct search: new perspectives on some classical and modern methods. SIAM Review, 45, pp. 385–482
Laakso, K., Rivard, B., Peter, J., White, H., Maloley, M., Harris, J., and Rogge, D., 2015. Application of airborne, laboratory and field hyperspectral methods to mineral exploration in the Canadian Arctic: recognition and characterization of volcanogenic massive sulfide-associated hydrothermal alteration in the Izok Lake deposit area, Nunavut, Canada. Economic Geology, 110, pp. 925-941.
Larsen, L.M., and Rex, D.C., 1992. A review of the 2500 Ma span of alkaline-ultramafic, potassic and carbonatite magmatism in West Greenland. Lithos, 28(3-6), pp. 367- 402.
Leverington, D.W., and Moon, W.M., 2012. Landsat-TM-Based Discrimination of Lithological Units Associated with the Purtuniq Ophiolite, Quebec, Canada. Remote Sensing, 4(5), pp. 1208.
Li, C., and Rahman, A., 1990. Three-phase induction motor design optimization using the modified Hooke-Jeeves method.
Electric Machines and Power Systems, 18(1), pp. 1-12.
Characteristics of Lava Surfaces: Field Spectrometry of Basaltic Lava Flows on Tenerife, Canary Islands, Spain. Remote Sensing, 7(12), pp. 16986-17012.
Rees, W.G., Tutubalina, O.V., and Golubeva, E.I., 2004. Reflectance spectra of subarctic lichens between 400 and 2400 nm. Remote Sensing of Environment, 90(3), pp. 281-292.
Rivard, B., and Arvidson, R.E., 1992. Utility of imaging spectrometry for lithologic mapping in Greenland.
Photogrammetric Engineering and Remote Sensing, 58(7), pp. 945-949.
Rogge, D.M., Rivard, B., Zhang, J., and Feng, J., 2006. Iterative Spectral Unmixing for Optimizing Per-Pixel Endmember Sets.
IEEE Transactions on Geoscience and Remote Sensing, 44(12), pp. 3725.
Rogge, D.M., Rivard, B., Zhang, J., Sanchez, A., Harris, J., and Feng, J., 2007. Integration of spatial-spectral information for the improved extraction of endmembers. Remote Sensing of Environment, 110(3), pp. 287-303.
Rollin, E.M., Milton, E.J., and Roche, P., 1994. The Influence of Weathering and Lichen Cover on the Reflectance Spectra of Granitic Rocks. Remote Sensing of Environment, 50, pp. 194-199.
Satterwhite, M.B., Henley, J.P., and Carney, J.M., 1985. Effects of lichens on the reflectance spectra of Granitic rock surfaces.
Remote Sensing of Environment, 18(2), pp. 105-112.
Sheng, G., Zongyu, Y., Kaichang, D., and Jinnian, W., 2015. Mineral abundances and different levels of alteration around Mawrth Vallis, Mars. Geoscience Frontiers, 6(5), pp. 741-758.