POOR TEXTURAL IMAGE MATCHING BASED ON GRAPH THEORY
Shiyu Chena*, Xiuxiao Yuana, b, Wei Yuana,c, Yang Caia
a School of Remote Sensing and Information Engineering, Wuhan University, Wuhan 430079, China - (csy_hy, yuanxx) @whu.edu.cn, [email protected]
b Collaborative Innovation Center for Geospatial Technology, Wuhan 430079, China - [email protected] cCenter for Spatial Information Science, University of Tokyo, Kashiwa 277-8568, Japan - [email protected]
Commission III, WG III/5
KEY WORDS: Poor Textural Image, Image Matching, Graph Matching, Affinity Tensor, Power Iteration Algorithm
ABSTRACT:
Image matching lies at the heart of photogrammetry and computer vision. For poor textural images, the matching result is affected by low contrast, repetitive patterns, discontinuity or occlusion, few or homogeneous textures. Recently, graph matching became popular for its integration of geometric and radiometric information. Focused on poor textural image matching problem, it is proposed an edge-weight strategy to improve graph matching algorithm. A series of experiments have been conducted including 4 typical landscapes: Forest, desert, farmland, and urban areas. And it is experimentally found that our new algorithm achieves better performance. Compared to SIFT, doubled corresponding points were acquired, and the overall recall rate reached up to 68%, which verifies the feasibility and effectiveness of the algorithm.
1. INTRODUCTION
Poor textural image matching is a challenging task in computer vision, digital photogrammetry and remote sensing field (Hartmann, 2015). Conventional radiometry-based algorithms are effective and robust when encountered with rich textural images. However, the matching result is commonly less than satisfactory when dealing with poor textural images, which requires manual intervention and hinders systematic automation. Image matching algorithms can be divided into two types. One is based on radiometric information. For instance, normalized cross correlation (NCC) (Gonzalez, 1992), scale invariant feature transformation (SIFT) (Lowe, 2004), distinctive order based self-similarity (DOBSS) (Sedaghat, 2015) are typical radiometry-based. These approach will fail in the presence of ambiguities such as repeated patterns, textures, or non-discriminative local appearance (Krystian, 2005). Modern algorithms now tend to utilize geometric information to guide the search for correspondence, such as semi-global matching (SGM) (Heiko, 2008), patch-based multi-view stereos (PMVS) (Furukawa, 2007), multiphoto geometrically constrained matching (MPGC) (Li, 2006) etc. In these kind of algorithms interest points are matched under the constraints of geometric relations, their essenc is dual decomposition (Komodakis, 2007), to break down the main problem into smaller problems. Through iterative process all small problems converged to the same or similar solutions. However, focus on poor textural images matching,few research were conducted. Wu (Wu, 2012)
obtained the dense matching point cloud by the combination of point and line features, under the premise of the known image orientation elements. Zickler (Zickler, 2007) took the advantage of PCA-SIFT (Ke, 2004) in highly deformable scene to guide object recognition.
Texture homogeneity always appears as low local contrast. The
*Corresponding author
intensity-based algorithms are vulnerable to noise interference; therefore, the matching success rate is low. When using feature-based algorithm, not enough feature point can be obtained as well. For texture repeatability, both intensity-based and feature-based algorithm are prone to cause erroneous matches. Also, the texture discontinuity and occlusion leads to distortion of image, even for genuine corresponding points, their feature descriptors often differ greatly. Generally, the homogeneity and repeatability can have severe impact on matching result. In this instance, we draw on graph theory (Chung, 1997; Livi, 2013) for making the match results global optimized in geometry and radiometry, by integrating geometry and radiometry information in a high order tensor (Abraham, 2012) and reach the best assignment matrix via power iteration algorithm (De, 2000). Image matching problem can be well defined as graph matching problem. Given a set of feature points, the points can be represented by graph node and graph edges encode the relationships between two points. And the problem transforms into finding the correspondences of nodes between two graphs. At present, graph matching mainly have 3 kinds of geometric constraints: unitary constraint,pairwise constraint and triplet
by each triple nodes between two graph. And by using triplet constraint, the description can be affine invariant. But, when raw data contains numerous gross errors, the methods mentioned above perform poorly. For this purpose, it is proposed an edge-weight strategy to improve graph matching algorithm to obtain well distributed and highly reliable matching points.
2. METHODOLOGY AND WORKFLOW
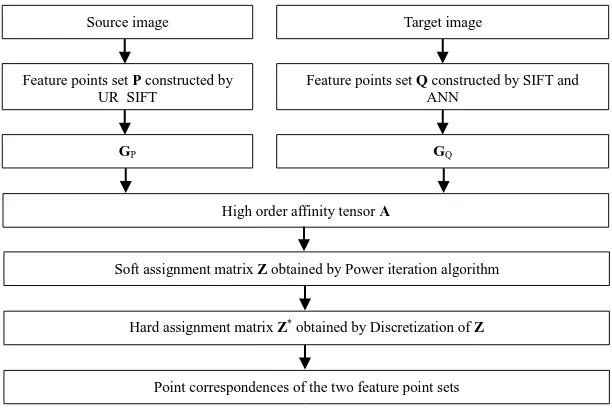
In this paper, an improved graph matching algorithm is proposed. In order to reducing the ambiguities and improve matching reliability, both radiometric and geometric information are synthetically utilized by an edge-weight strategy. The approach proceeds as follows: first, a feature point set P is computed using the UR-SIFT (Sedaghat, 2011) algorithm (uniform robust scale
invariant feature transform), which extracts the uniformly distributed feature points in the source image, and the SIFT feature points are obtained by a lower contrast threshold in target image. Then the ANN (Indyk, 1998) (approximate nearest neighbor) algorithm is adopted to estimate k tie points in target image corresponding to every single feature point in source image, obtaining a potential tie points set (denoted as Q). Next, graph
G
PandG
Qare constructed by P and Q respectively, and the edge weighted high order affinity tensor A of the two graphs can be built simultaneously. At last, the Power iterationalgorithm is applied to find the tensor’s leading vector, which is
also the nodes assignment matrix Z of the two graphs, thereby the correspondences of the feature points can be constructed.
Figure 1 The workflow of graph based image matching
As can be seen from the Figure 1,the key steps of the running
process are : UR-SIFT and SIFT features extraction, affinity tensor A construction, soft assignment matrix Z acquisition, and the discretization of Z to obtain hard assignment matrix Z*. In this section, it focuses on the Construction of feature point sets and edge weighted HOGM algorithm.
2.1 Construction of feature point sets
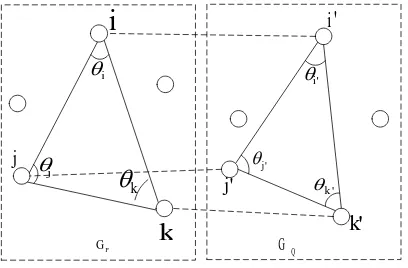
For using geometric constraints in matching, well-distributed feature points are needed. As shown in Figure 2, the proposed algorithm employs interior angles of triangle as the geometric constraint. It can be expressed concisely as follows. Suppose that feature point pairs
(
i
,
i
'
),
(
j
,
j
'
),
(
k
,
k
'
)
are corresponding points, then the two triangles (denote byT
i,Pj,kandT
iQ,'j,'k'), constructed by the feature points extracted in source image and target image respectively, are approximate similar triangles (also been called matched triangles). But if any two vertices ofT
i,Pj,k are too close, slight distance variations would change the interiorangles of the triangle violently. In this situation, the matched triangles may not be similar triangles. Besides, the triangle constraint become valid in a small region, because two central projection image patches take at different locations with the same scene are local similarity transformation, so the distance between any two vertices of the triangle should not be too long. In addition, in many applications such as aerial triangulation and remote sensing imagery registration, only small amount of tie points are needed, which would better be uniformly distributed. To obtain well-distributed, stable and quantity controllable features, UR-SIFT algorithm is adopted in source image, meanwhile, SIFT with lower contrast threshold is adopted in target image to guarantee feature repeatability.
Suppose the feature point set P contains
n
Pfeature points, then every single feature point in P can find k (k should be greater than 2) potential correspondences in target image, all these potential correspondences form the feature point set Q, which containsn
Qfeature points. Until now, the point set P and Q are constructed.Source image
Feature points set P constructed by UR_SIFT
Target image
Feature points set Q constructed by SIFT and ANN
GP GQ
High order affinity tensor A
Soft assignment matrix Z obtained by Power iteration algorithm
Hard assignment matrix Z* obtained by Discretization of Z
Figure 2 Geometry constraint based on similar triangles
2.2 Edge weighted HOGM
The essence of image matching is mapping two feature sets. Graphs(donated as
G
PandG
Q) can be constructed by given point set P&Q. Graph nodes represent the attributes of the feature points such as gray level and locations, while the graph edges encode their spatial relations such as distances, angles and so on. So the mapping can be cast as the correspondences of the nodes of two graphs, this is the very solution of graph matching. However, the graph matching result is vulnerable to outliers. In this paper, it introduces an edge weighted high order graph matching algorithm to improve matching results when confronted with vast scale of false candidates (outliers). For simplicity, the order of the tensor is restricted to 3.The 3-oder tensor is given by
2
= triplet similarity measure'
As illustrated in Figure 1, the triangle descriptor is constructed by the interior angles of the triangle, this is,
)
solution of formula (2)1
Z
= hard assignment matrixA
encodes the relationships and attributes of feature points, *Z
expresses the correspondences of the graph nodes. It is noteworthy that 1-order, 2-order and 3-oder graph matching can interconvert to each other in some trivial cases (more details challenge in real-world graph matching problems is to tolerance the numerous outliers arising in typical visual tasks such as image matching and object recognition, sometimes the outliers are more than inliers and that is hard to distinguish inliers from outliers due to clutters. This lead graph matching to local optima and erroneous image matching results. To tackle real-world image matching tasks, it is proposed an edge weighted high order tensor graph matching algorithm.In formula (1), if numerous outliers present in both feature point sets, then the 3-order affinity tensor may contain irrelevant information produced by outliers, so the 3-order affinity tensor
Aequals to a correct affinity tensor
A
~
, which produced by point sets have no outliers, plus a turbulent tensorΔAcreated by point sets have no inliers and noiseA
A
A
~
Δ
(3) Noise is neglected because it has less impact on graph matching than outliers. The main idea of reining the outliers is increasingPower iteration of 3-order tensor is the solution to (2)
K J
K J
I
I
J
K
Z
Z
Z
I
,
3
(
,
,
)
,
(4)Where
I
,
J
,
K
= the shorthand of index pairs)
'
,
(
),
'
,
(
),
'
,
(
i
i
j
j
k
k
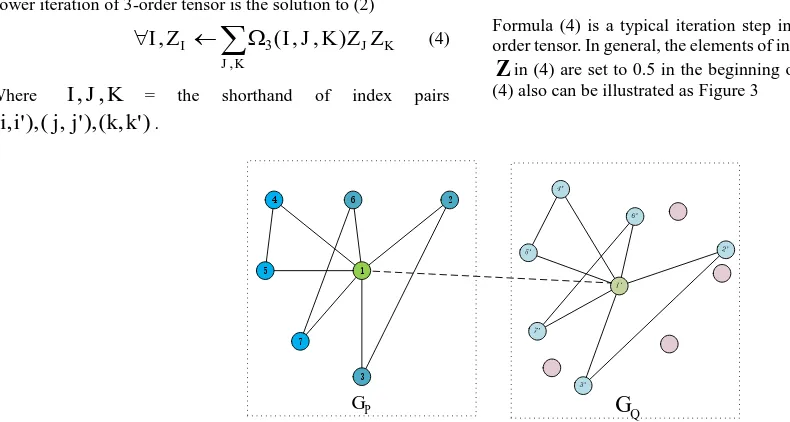
.Formula (4) is a typical iteration step in power iteration of 3-order tensor. In general, the elements of initial assignment matrix
Z
in (4) are set to 0.5 in the beginning of power iteration, and (4) also can be illustrated as Figure 3Figure 3 sketch of power iteration in the perspective of nodes, the pink circles are outliers As can be seen in Figure 3, the relationship(whether they are
matched pair or not) of
V
1 inG
P andV
1' inG
Q is determined by the triangles which have one common vertex in each graph(For example, the value of soft assignment matrix elementZ
1,1'is partial determined by the sum of similarity of trianglesT
1,P2,3 andT
1'Q,2',3' ,T
1,4,5P andT
1'Q,4',5' ,T
1,3,7P andQ
T
1',3'7' etc.), i.e. the assignment relationship is determined bythe opposite sides of the common vertex. So in graph matching, the critical factor is edges in graph. Formula (4) also can be modified into another form
K
K J
I
Z
I
J
K
Z
Z
J
I
,
,
3(
,
,
)
(5)As can be seen in formula (5),the relationship of edges are
determined by graph nodes, and it is more straightforward in Figure 4
Figure 4 sketch of power iteration in the perspective of edges, the pink circles are outliers
As shown in Figure 4, similarly to node perspective, the assignment relationship of two edges are determined by triangles which have one common edge in each graph (for example, the assignment relationship of
E
1,2P andE
1'Q,2'are partial determined by the sum of node similarityV
3andV
3',V
4andV
4' etc.). If there is no prior information of the nodes affinity, then the nodes from two graphs are half-matched, that is to say every element inZ
is set to 0.5. So the edge similarity can be defined as
K
K J I J
I
c
c
c
s
,0
.
5
3(
,
,
)
(6)Formula (6) can be justified by qualitative analysis. If the edge P
j i
E
, and edgeE
i'P,j' are markedly different, then the probability thatT
i,j,kandT
i,'j,'k'are similar triangles is very low, on the other hand, ifT
i,j,k andT
i,'j,'k' are similar triangles, then the edgeE
iP,j and edgeE
i'P,j' are much the same. So the edge similarity can be treated as a weighted factor when constructing 3-oder tensors4
7
6 2
3 5
P
G
G
Q1
P
G
Q
G
3 4
6
5
7
2
}
n
= the counter which equals to)
w
is the balanced weighted factor of unitary similarity measure and triplet similarity measure:2
dof
=the triplet similarityGiven that two edges from different graphs are matched, then triangles include the two edges have high probability of similarity, thus the tensor elements related to the edges should be increased, otherwise they should be decreased because triangles contain outliers may have smaller similarity. By using of edge weighted strategy,
A
~
is increased indirectly, and thus robust to outliers. The elements of tensor A can be constructed by (8), then (2) can be solved by HOGM (more details please refer to (Duchenne, 2009)), and the hard assignment matrix Z* ofP
G
and
G
Q can be obtained by greedy algorithm, so as to the matched result of feature point sets P and Q.3. EXPERIMENTS RESULTS
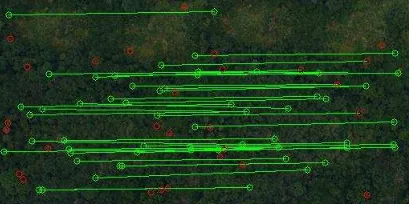
This section presents evaluation on the proposed EW-HOGM algorithm, three typical poor textural images are used to verify the robustness of the method. Figure 5 illustrates the matching results:
(a) Woodsy aerial image matching result
(b) Dessert aerial image matching result
(c) Urban aerial image matching result Figure 5 Typical poor textural image matching with
EW-HOGM (the circles represent the outliers)
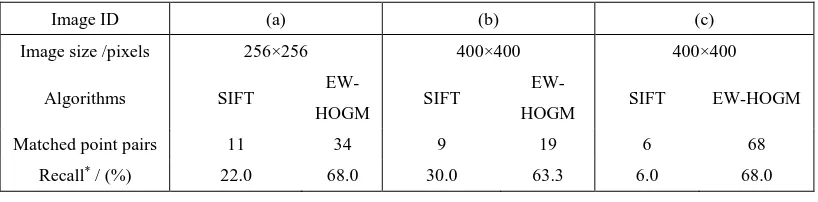
Image ID (a) (b) (c)
Image size /pixels 256×256 400×400 400×400
Algorithms SIFT
EW-HOGM SIFT
EW-HOGM SIFT EW-HOGM
Matched point pairs 11 34 9 19 6 68
Recall* / (%) 22.0 68.0 30.0 63.3 6.0 68.0
Table 1 Comparisons of SIFT and EW-HOGM (* 100%
# #
spondences totalCorre
ches correctMat
recall )
The experimental results demonstrate that EW-HOGM performs better than SIFT in poor textural image matching, especially in matching recall rate. EW-HOGM can obtain much more matching points than SIFT. In woodsy aerial images and desert aerial images, the matched point numbers of EW-HOGM are two times greater than SIFT, and in urban aerial images it is ten times more. Although the recall rates of SIFT in rich textural images are better, however, as can be seen from table 1, the recall rate of SIFT in poor textural image matching is less than 30.0%, the EW-HOGM reach to about 70% mainly owes to both geometric and radiometric information are integrated utilized via affinity 3-order tensor. Meanwhile, the distribution of the matched points is better than SIFT.
4. CONCLUSIONS
It is proposed a graph based algorithm that integrates both geometry and radiometry together to address the poor textural image matching problems. In the algorithm, an edge weighted high order graph matching method are applied, and it improves the matched points number and recall rate. The experiments of typical poor textural image matching results shows that the proposed algorithm performs better than SIFT. Because of the tolerance of outliers, this algorithm can also be employed in shape matching and 3D clouds registration where outliers are massive, besides, this framework can also be applied in gross error detection if it is proper modified.
ACKNOWLEDGEMENTS
This work has been supported by the National Key Developing Program for Basic Sciences of China (Grant No. 2012CB719902) and National Natural Science Foundation of China (Grant No. 41371432).
REFERENCES
Abraham R, Marsden J E, Ratiu T., 2012. Manifolds, tensor analysis, and applications. Springer Science & Business Media, New York, USA, pp.413-421.
Chung F R K., 1997. Spectral graph theory. American Mathematical Soc., Providence, USA, pp. 6-12
De Lathauwer L, De Moor B, Vandewalle J., 2000. On the best rank-1 and rank-(r 1, r 2,..., rn) approximation of higher-order tensors. SIAM Journal on Matrix Analysis and Applications, 21(4), pp. 1324-1342.
Duchenne O, Bach F, Kweon I S, et al., 2011. A tensor-based algorithm for high-order graph matching. IEEE Transactions on Pattern Analysis and Machine Intelligence, 33(12), pp. 2383-2395.
Furukawa Y, Ponce J., 2010. Accurate, dense, and robust multiview stereopsis [J]. IEEE Transactions on Pattern Analysis and Machine Intelligence, 32(8), pp. 1362-1376.
Gold S, Rangarajan A., 1996. A Graduated Assignment Algorithm for Graph Matching. IEEE Transactions on Pattern Analysis & Machine Intelligence, 18(4), pp.377-388.
Gonzalez R C, Woods R E., 1992. Digital image processing. Addison-Wesley, New Jersey, USA, pp. 231-235.
Hartmann W, Havlena M, Schindler K., 2015. Recent developments in large-scale tie-point matching. ISPRS Journal of Photogrammetry and Remote Sensing.
Heiko H, 2008. Stereo Processing by Semiglobal Matching and Mutual Information. IEEE Transactions on Pattern Analysis & Machine Intelligence, 30(2), pp.328-341.
Indyk P, Motwani R., 1998. Approximate nearest neighbors: towards removing the curse of dimensionality. Proceedings of the thirtieth annual ACM symposium on Theory of computing. ACM, New York, USA, pp. 604-613.
Ke Y, Sukthankar R., 2004. PCA-SIFT: A More Distinctive Representation for Local Image Descriptors. Proceedings of Computer Vision and Pattern Recognition, 2, pp. II-506—II-513. Komodakis N, Paragios N, Tziritas G., 2007. MRF optimization via dual decomposition: Message-passing revisited. IEEE 11th International Conference on Computer Vision, Rio de Janeiro, Brazil, pp. 1-8.
Krystian M, Cordelia S., 2005. A performance evaluation of local descriptors. IEEE Transactions on Pattern Analysis & Machine Intelligence. 27(10), pp.1615-1630.
Leordeanu M, Hebert M., 2005. A spectral technique for correspondence problems using pairwise constraints. Proceedings of IEEE International Conference on Computer Vision. 2, pp.1482-1489.
Livi L, Rizzi A., 2013. The graph matching problem. Pattern Analysis and Applications, 16(3), pp. 253-283.
Cour T, Srinivasan P, Shi J., 2007. Balanced graph matching. Advances in Neural Information Processing Systems. MIT Press, Cambridge, USA, pp. 313-320.
Sedaghat A, Ebadi H., 2007. Distinctive Order Based Self-Similarity Descriptor for Multi-Sensor Remote Sensing Image Matching. Isprs Journal of Photogrammetry & Remote Sensing, 108, pp.62-71.
Sedaghat A, Mokhtarzade M, Ebadi H., 2011. Uniform Robust Scale-Invariant Feature Matching for Optical Remote Sensing Images. IEEE Transactions on Geoscience & Remote Sensing, 49(11), pp.4516-4527.
Wu B, Zhang Y, Zhu Q., 2012. Integrated Point and Edge Matching on Poor Textural Images Constrained by Self-Adaptive Triangulations. ISPRS Journal of Photogrammetry and Remote Sensing, 68(1), pp.40-55.
Zass R, Shashua A., 2008. Probabilistic graph and hypergraph matching. IEEE Conference on Computer Vision and Pattern Recognition, Anchorage, USA, pp.1-8.