RELATIONSHIP BETWEEN CLIMATE CHANGE IMPACT, MIGRATION AND
SOCIOECONOMIC DEVELOPMENT
Kyaw Sann Oo*
MGRP, Myanmar Peace Center, 11 Shwe Li Street, Kamayut Township, Yangon, Myanmar - [email protected]
ISPRS – UN-GGIM Forum
KEY WORDS: Migration, rural, agriculture, urban, climate change
ABSTRACT:
Geospatial data are available in raster and vector formats and some of them are available in open data form. The technique and tools to handle those data are also available in open source. Though it is free of charge, the knowledge to utilize those data is limited to non-educated in the specific field. The data and technology should be promoted to those levels to utilize in required fields with priceless in developing countries. Before utilize open data, which are required to verify with local knowledge to become usable information for the local people as priceless data resources. Developing country, which economic is based in agriculture, required more information about precise weather data and weather variation by the climate change impact for their socioeconomic development.
This study found that rural to urban migration occurs in the developing countries such agriculture based country likes Myanmar when the agriculture economic are affected by unpredictable impact by the climate change. The knowledge sharing using open data resources to non-educated local people is one of the curable solutions for the agriculture economy development in the country. Moreover, the study will find ways to reduce the rural to urban migration.
* Corresponding author
1. INTRODUCTION
Location based data are very useful considering migrant issues such as tracking the migrants, their occupied space and their density, survival environment and society, foods and incomes.
1.1 Problem
Migration is happen in rural areas of the developing countries where urban areas becoming development. It is important issue for Myanmar, since; the agricultural country is based on the manpower of rural pheasants. Proper migration management plan is required not to affect the rural agro-economy and socioeconomic.
1.2 Objective
The study will find the relationship between migration, the climate change impact and socioeconomic on rural social interaction with urban development.
2. METHODOLOGY
Geographic Information Systems (GIS) data are collected on the rural socialized spaces (settlement), then analysis it with the input of population and agriculture spaces, and compared nearby urban population.
The Google Earth Pro provide user interface to access very high resolution satellite imagery with priceless. In the study, settlement patches in the rural spaces are collected by online digitizing. In the methodology, the study assumed the settlement in Bago Region is as rural area which interacting with urbanized Yangon Region. Since the biggest commercial
city of Myanmar (Yangon) is neighbours in the southern of the Bago Region, the access for the migrants from rural area to Yangon is in excellent condition with three main parallel highways accesses. The main accesses are Yangon-Bago old Road which passes through eastern of the Bago Region, Yangon-Mandalay new Highway which passes through at the east of the central Bago Yoma and Yangon-Pyay Road passes through western of the Region along the Ayeyarwady River. Therefore, the study area has two settlement basins (Ayerwady basin and Sittaung basin) separated by the Bago Yoma mountain range. Those two separated settlement basins are joined at the Yangon. Since, the Bago Yoma is dense forest area, the settlements can be found along the rivers tributaries and along the road network in the basins’ fertile land.
2.1 Rural Population with Spatial Distribution
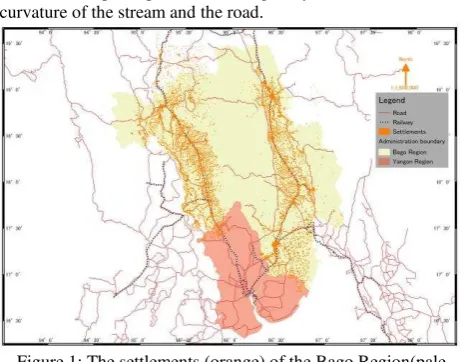
Bago region has (28) townships in (4) districts with the area of 39,404.4 km2 (Myanmar Census, 2014c). Human settlement spaces (villages and cities) in rural areas are collected geographically (Figure 1) by onscreen digitizing using QGIS open source software as spatial data. The total digitized settlement spaces are counted up to 5500 patches with various forms and patterns. The total area of the digitized settlement patches is 1572 km2. Base on digitized geospatial data, the administrative boundary area is 40,060 km2. Therefore, the total settlements percentage of the study area is 3.9% of total political boundary area of the Region. The population density (122 persons per km2) of the Bago Region is 17% of the Yangon Region (716 persons per km2). The distribution of settlement patches are along roads and along streams of the two basins. Most of the patches are surrounded by the agriculture The International Archives of the Photogrammetry, Remote Sensing and Spatial Information Sciences, Volume XLI-B4, 2016
XXIII ISPRS Congress, 12–19 July 2016, Prague, Czech Republic
This contribution has been peer-reviewed.
fields and the patch patterns are irregularly formed based on the curvature of the stream and the road.
Figure 1: The settlements (orange) of the Bago Region(pale green) neighbour by Yangon Region (orange)
Magnificently, population density at Zigon Township is 253 persons per square kilometre, since the area of Zigon is bottleneck between Nattalin and Gyobingauk townships in the region (Table 1) along the Yangon-Pyay Road.
Table 1: Population density by political boundary, settlement area and settlement ratio of Bago Region
2.2 Population Data
Population data is acquired from Myanmar census 2014 (Myanmar Census, 2014c) (Table 2). The sex ratio shows less male than female in all townships in the region. The total population of both sexes is 4,867,373 persons in the Region.
Name Both
sexes Male Female
Sex ratio BAGO
Region 4,867,373 2,322,338 2,545,035 91.2 BAGO
District 1,770,785 846,110 924,675 91.5
Bago 491,434 235,529 255,905 92
Tanatpin 145,287 69,136 76,151 90.8
Kawa 197,363 93,804 103,559 90.6
Waw 176,014 83,699 92,315 90.7
Nyaunglebin 199,483 94,464 105,019 89.9
Kyauktaga 251,212 120,024 131,188 91.5
Daik U 202,530 96,362 106,168 90.8
Shwegyin 107,462 53,092 54,370 97.6
TOUNGOO
District 1,123,355 534,564 588,791 90.8
Toungoo 262,056 125,142 136,914 91.4 The International Archives of the Photogrammetry, Remote Sensing and Spatial Information Sciences, Volume XLI-B4, 2016
XXIII ISPRS Congress, 12–19 July 2016, Prague, Czech Republic
This contribution has been peer-reviewed.
THAYAWA
DY District 1,062,331 507,113 555,218 91.3
Thayawady 151,104 72,772 78,332 92.9
Letpadan 177,407 84,396 93,011 90.7
Minhla 122,491 58,577 63,914 91.6
Okpo 126,662 60,705 65,957 92
Zigon 67,523 32,167 35,356 91
Nattalin 172,141 82,083 90,058 91.1
Monyo 127,570 60,664 66,906 90.7
Gyobingauk 117,433 55,749 61,684 90.4 Table 2: Population by household type, sex and sex ratio of
Bago Region in 2014 census
2.3 Migration
No migrant was reported in the census of 1973 in the Bego Region (Burma census, 1973). About 53% of all persons who moved from their previous place of usual residence within Myanmar were female. The main reason for migration for both sexes was ‘followed family’ and ‘employment or seeking employment’ (Myanmar Census, 2014b) (Figure 2).
Figure 2: Main reason for migration in percentage (Myanmar Census, 2014b)
2.4 Finding Relationship / Spatial Analysis
The distribution of population is presented by proportion of each State or Region (Division). Based on the 1973, 1983 and 2014 census data, the proportion of population of Yangon Region is 14.3 while Bago Region is 9.5 in 2014 Myanmar census.
Figure 3: The proportion of population compared on 1973, 1983 and 2014 census data (Myanmar census, 2014a)
But in 1983, proportion of population of Yangon Region is 11.2 while Bago Region is 10.8. Similarly, proportion of population of Yangon Region is 11.0 while Bago is 11.0 in 1973 census data (Figure 3). Seeing the proportion, the population in Yangon Region is dramatically increases in the 2014 census comparing the population data of Bago Region in 1973 and 1983 census.
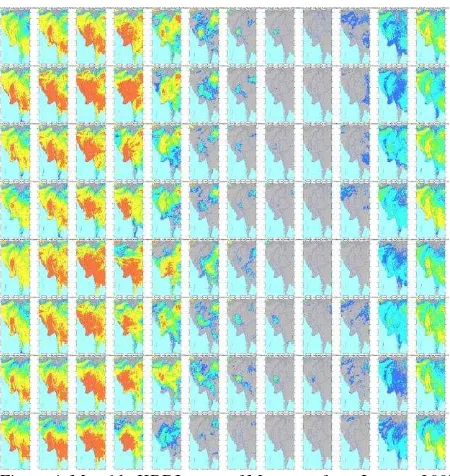
2.5 Modified Keetch-Byram Drought Index (mKBDI)
Modified Keetch-Byram drought index (mKBDI) (Wataru, 2010) for the study is generated using precipitation data of Global Satellite Map of Precipitation (GSMaP) and land surface temperature retrieval from MTSAT IR1 and IR2 (Oyoshi, 2010). The KBDI is a continuous reference scale for estimating the dryness of the soil and duff layers and the scale ranges from 0 (wet) to 800 (extremely dry) (Keetch, 1968).
mKBDI = mKBDI0 - 3.94 × r + ((1800-mKBDI0) (0.968exp(0.0875T+1.552)-8.30))/(1000× (1+10.88exp(-0.001736R))) ---(1) where mKBDI = modified Keetch-Byram Drought Index
r = GSMaP daily accumulate rainfall (mm) T = MTSAT Land Surface Temperature (K) R = GSMaP annual average rainfall (mm)
The KBDI is assumed to use to understand the climate change effect on the agriculture productivity in the study area. The assumption is that of if the trend of KBDI is continuously high for years; productivity of agriculture will be declined. Consequently, the income of the rural peasants will be decreased for their survival and it will be pushed to migrate to urban area for daily wages for their survival.
Figure 4: Monthly KBDI maps of Myanmar from January 2007 (bottom left) to December 2014 (top right)
The dryness (high KBDI) happens in the December to April except for 2008, 2009, 2010, 2013 and 2014 in central Myanmar. Observing the KBDI data for 2010, 2013 and 2014 the dryness looks much higher than other recorded years. The International Archives of the Photogrammetry, Remote Sensing and Spatial Information Sciences, Volume XLI-B4, 2016
XXIII ISPRS Congress, 12–19 July 2016, Prague, Czech Republic
This contribution has been peer-reviewed.
3. RESULT AND DISCUSSION
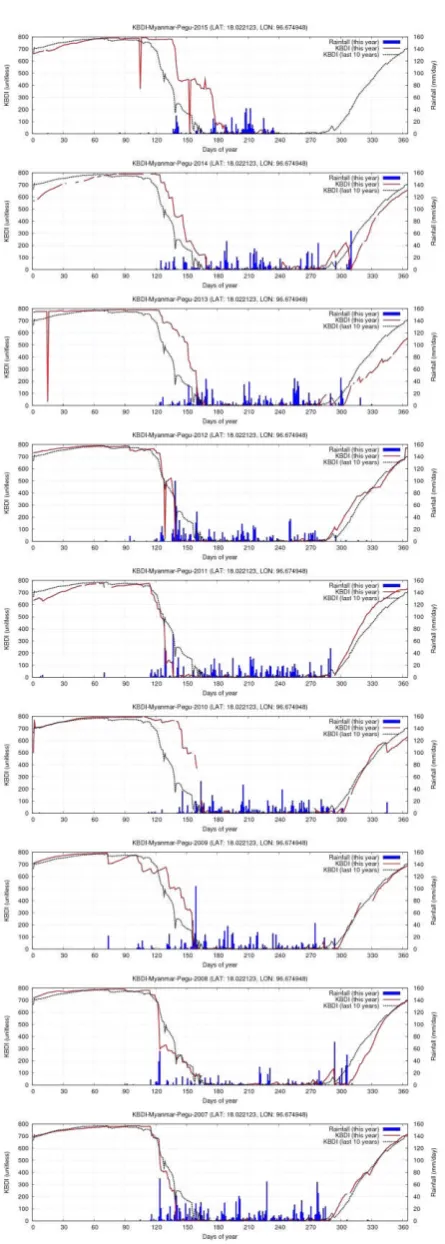
The unpredictable climate condition can be seen in the figure (3) based on the precipitation and KBDI.
Figure 5: Graph of KBDI and precipitation for Bago from beginning of 2007 to mid of 2015
The graph data in figure (5) are acquired freely from Satellite-based drought monitoring and warning system developed by Institute of Industrial Science, University of Tokyo, Japan. The KBDI, 10 years averaged of KBDI and Precipitation are compared in the graph. The red line in the graph represented KBDI of the year while the dot line represented the (10) years averaged of the KBDI. The KBDI continuously remind high for a month in the year of 2010, 2013, 2014 and 2015 in the Bago area. Thus, high anomaly of drought will be on those years and summer crop in the region would be affected by this kind of climate change effect. Based on a verbal interview in early of 2015, one farmer said that “There was unpredictable weather condition happen in beginning of 2014 and that affected consequently to crops calendar. There were grasses among the crops and difficult to care crop, since, peasants were migrated to city for daily wages and labour shortages also happen in the region.”
It is still missing to compare with in-situ field survey for the climate data and social survey; it should be done in future work. The data collect on socioeconomic information in regional level is still unreached; the next step will be finding way to involve.
ACKNOWLEDGEMENTS
I would like to express my sincerely thanks to Professor Wataru Takeuchi for his guidance on the drought monitoring technique and allowed to use his satellite based drought monitoring system. Moreover, it is appreciated to family, friends and co-workers who strengthen me to work on this research.
REFERENCES
Burma Census, 1973. Population Census Report (Union) Myanmar version: Immigration and Manpower Department, Ministry of Home and Religious Affairs, The Socialist Republic of the Union of Burma, 1973.
Burma Census, 1983. Population Census Report: Immigration and Manpower Department, Ministry of Home and Religious Affairs, The Socialist Republic of the Union of Burma. June, 1986
Keetch, J. J. and Byram, G. M., 1968. A Drought Index for Forest Fire Control. Res. Paper SE-38. Asheville, NC: U.S. Department of Agriculture, Forest Service, Southeastern Forest Experiment Station.
Myanmar Census, 2014a. Provisional Results: Census Report Volume (1): 2014 Myanmar Population and Housing Census: Department of Population, Ministry of Immigration and Population, Union of Myanmar, August 2014.
Myanmar Census, 2014b. Highlights of the Main Result: Census Report Volume (2-A): 2014 Myanmar Population and Housing Census: Department of Population, Ministry of Immigration and Population, Union of Myanmar, May 2015. Myanmar Census, 2014c. Bago Region: Census Report Volume (3-G): 2014 Myanmar Population and Housing Census: Department of Population, Ministry of Immigration and Population, Union of Myanmar, May 2015.
Oyoshi, K., Takeuchi, W. and Tamura, M., 2010. Evaluation of the algorithms for land surface temperature retrieval from MTSAT data. Journal of Japanese Photogrammetry and Remote Sensing, 49(4), 251-259 (in Japanese with English abstract).
Wataru T., Takashi H., Nanin A. and Orbita R., 2010. Estimation of ground water table at forested peatland in Kalimantan using drought index towards wildfire control. Asia conference on remote sensing (ACRS), 2010.
The International Archives of the Photogrammetry, Remote Sensing and Spatial Information Sciences, Volume XLI-B4, 2016 XXIII ISPRS Congress, 12–19 July 2016, Prague, Czech Republic
This contribution has been peer-reviewed.