SIMULATION OF MUX CAMERA IMAGES OF THE BRAZIL-CHINA SATELLITE
EARTH RESOURCES (CBERS-3)
G. A. Boggione a,b *, L. M. G. Fonseca a, S. Bosch-Puig c, F. J. Ponzoni a a
INPE, National Institute for Space Research, Brazil - (giovanni, leila)@dpi.inpe.br, flavio@dsr.inpe.br b IFG, Federal Institute of Goiás, Brazil
c UB, Universitat de Barcelona - sbosch@ub.edu
Commission V, WG V/I
KEY WORDS: Simulation, Sensors, Modelling, Image, Comparison, Correction.
ABSTRACT:
The manipulation of the bands of a multispectral sensor for the simulation of a other band represents an attractive possibility for the handling of the data of remote sensing. This work presents a simulation technique for the MUX/CBERS-3. MUX (Multispectral Camera) is a Sino-Brazilian camera that is under development and will be launched on the platform CBERS-3. This study analyzes images generated with worse visual aspect taking in account the attributes of the sensors. Visual and statistics tests were accomplished to confirm the effectiveness of the methodology. The result of this processing is an image containing specific information, extracted and enhanced from the original images. The objective of this study is to propose a generic simulation method of spatial resolution based on the determination of the Modulation Transfer Function (MTF) by Zernike polynomials. The simulated images is important in all applications where is necessary work with images with different resolutions in order to compare the impact of change in terms of the visual analysis, resolution or performance of procedures for automatic image analysis. This research contributes to feasibility studies for future sensors, which is a very common practice to develop simulation procedures before of the construction of the sensor, where potential errors can be identified. This paper suggests a methodology for simulating band which consists of applying the techniques of filtering and resampling of images for the approximation of the desired spatial resolution.
* Corresponding author.
1. INTRODUCTION
1.1 Image Simulation
Among the digital processing techniques, images simulation presents itself as an important development tool, because it allows making appraisals on simulated images, pointing to what application these images will be more useful or indicating possible defects, besides, of course, to generate images that can serve as a parameter to validate a sensor in development. Simulation techniques have the objective to produce high fidelity images that are compatible with the data used to generate them, such as spectral curves and MTF, which are not always available. The most efficient way to generate a understanding is insufficient and that further research and development efforts may be needed to fully understanding the process of images forming of a specific sensor (Schott, 1997). These images help to understand if the problems simplifications are acceptable and may also highlight the importance of a parameter or component that was completely forgotten. On the other hand, a component that has been given special attention may be presented as being, perhaps, of little importance. This research also intends to examine the simulation techniques, indicating which of these techniques is most feasible with the
reality of resources and data availability. It is also intended, to contribute in the feasibility studies of future sensors, bearing in mind that the development practice of simulation process before the sensor be constructed, which permits the prediction of possible errors, it is very common.
The study object of this paper is the MUX Camera of CBERS-3 satellite, a partnership between Brazil and China which should be launched by the end of 2012. The technique used here will be the degradation of a better spatial resolution image. The simulated images will be generated from RAPIDEYE images. In fact, simulating a remote sensing image involves in the understanding of the phenomenon of images generation. Understood the process as a whole, it is possible to assess where this understanding is flawed or simplified and if the model proposed is inadequate or the comprehension of problem is limited. This paper suggests a methodology for simulation of MUX/CBERS-3 Camera’s bands which consists of applying the filtering techniques, restoration and resampling of images for the approximation of the desired spatial resolution and in the inverse application of atmosphere and topography effects to estimate the radiometry.
2. METODOLOGY
The case study presented in this work is the simulation of MUX/CBERS-3 camera’s images from RAPIDEYE images of an area located in the Luís Eduardo Magalhães county in Bahia, Brazil, acquired on 02/09/2009 and 01/10/2009.
by the company Opto Eletrônica S.A. and is intended for the earth's remote sensing.
The MUX camera is part of the payload of the Sino-Brazilian satellites CBERS 3&4 (China Brazil EarthResource Satellite). The optical system was designed for four spectral bands covering the wavelength range from 450 nm to 890 nm. The angular field of view is of 8,8 ± that covers 120 km with a ground resolution of 20 meters at nadir (Dias et al., 2010). For the simulation, the image to be degraded must have spectral characteristics close to the MUX characteristics. For this purpose the RAPIDEYE sensor was chosen. The spatial component of the RAPIDEYE system consists of a constellation of five identical remote sensing satellites, positioned in synchronous orbit with the Sun, with equal spacing between each satellite. Each of the five RAPIDEYE satellites makes 15 laps a day around the planet and the sensors on board the satellites can collect images of the Earth's surface along a zone of 77 km wide and up to 1500 km long. The Table 1 presents a comparison between the MUX and RAPIDEYE system.
Table 1. Comparison between the MUX and RapidEye systems.
Spectral
A linear filter combined with a decimation method is applied to the high resolution image (RAPIDEYE) to simulate the MUX image. The methodology is presented in Figure 1.
The proposed methodology consists of, first, to simulate the scene from the RAPIDEYE images based on the recovery of the degraded signal by the atmosphere and MTF.
The 6S model is used to remove the effects of the atmosphere noise. The resolution of images obtained by the satellite sensors is degraded by sources such as: optical diffraction, detector size and electronic filtering. Therefore, the effective resolution is, in general, worse than the nominal resolution that corresponds to the detector projection on the ground. Through restoration techniques, it is possible to improve image resolution up to a certain level (Boggione & Fonseca 2003). This filter does not change the radiometry of the images as it can see in Boggione et al., 2010. The values of the restore filter to RAPIDEYE images were calculated from the MTF of the system presented by
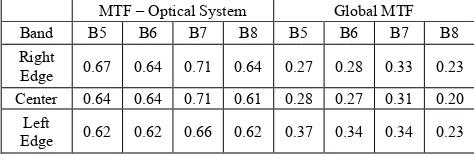
The MTF values obtained are shown in Table 2.
From these MTF values are found the 8 best coefficients that define a function of blurring more appropriate. These coefficients are determined by Zernike polynomials. The
Zernike polynomials represent a widely used method in optics to describe wavefront aberrations. More information about the theory of Fourier's optics, check in Goodman, 1996.
Figure 1. Simulation Image Metodology.
Table 2. MUX MTF measured in the laboratory.
MTF – Optical System Global MTF
Band B5 B6 B7 B8 B5 B6 B7 B8 order of ±1 wavelengths, defines a wavefront and hence a PSF or MTF in the most general way used nowadays in the field. It is important to note the following:
a) We assume perfect linearity in light detection at the pixels. This is a reasonable assumption, but, even if a non-linear response would exist, it could precisely be included in the present modeling with minor changes.
b) From our procedure, we find the PSF or MTF for the ‘image forming process’ only and we characterize it conveniently from a set of 8 Zernike coefficients. But, it is important to note that our characterization may be considered to include the effects of other causes of blurring (as smearing or electronic effects), since the final objective is the ‘best fit’ between our initial scene and the computed one. Only the light detection at the pixels is excluded.
The coefficients found for band 3 (red) in this experiment were:
0,00115112455958085 0,000948020102855363 -0,000517489256507934 -0,000558970278990687 0,000309353278759795 -0,000607692358748738 -0,000751838430959676 0,00107685524951114
The Figure 2 shows the RAPIDEYE image, the blurred image by the filter, the difference between them and the blurring function determined by the Zernike coefficients.
Figure 2. Application of the blurring function determined by the Zernike coefficients.
The last procedure of this block is to determine the function of blurring. This function is generated by the Zernike coefficients found. From the function it is obtained the low-pass linear filter correspondent.
Finally, the simulation block is done.
Given, therefore, the high resolution image, it is applied to it the linear filter combined with a decimation method and a random noise to produce the simulated image.
The designed filter has order 5 and assumes the weights according to each band. In the following example is presented the filter to band 3 (red).
0.004850 0.017533 0.024876 0.017533 0.004850 0.017533 0.063381 0.089928 0.063381 0.017533 0.024876 0.089928 0.127594 0.089928 0.024876 0.017533 0.063381 0.089928 0.063381 0.017533 0.004850 0.017533 0.024876 0.017533 0.004850
Therefore this filter is applied to the band 3 of RAPIDEYE image in order to degrade the details of image. An adjustment of the filtering was implemented for that could be applied not on the entire image, but at intervals of defined pixel by the ratio between the pixel of the reference image, in the case the 5-meter RAPIDEYE and the pixel of 20-meter MUX. Thus, the mask works for 4 in 4 pixels in rows and columns. So that the simulation could be more close as possible to the original image, a Gaussian random noise is added to the image (Papa et al., 2008).
Finally, the effects of atmosphere are inserted in the image, using an inverse process of the 6S.
3. RESULTS
The case study presented in this paper is the simulation of MUX/CBERS images using RAPIDEYE images in an area of agriculture.
This study analyzes the generated images with worse visual aspect taking into account the attributes of the sensors, such as the Modulation Transfer Function and signal noise relationship beyond the context of generated scene, taking into account the atmosphere and topography. Visual tests and statistics were performed to confirm the efficacy of the methodology.
To highlight the obtained results, the RAPIDEYE image was also submitted to conventional decimation such as Pixel Aggregation and Nearest Neighbor. This procedure aims to change the pixel size to 20 meters using this resampling as suposed simulation.
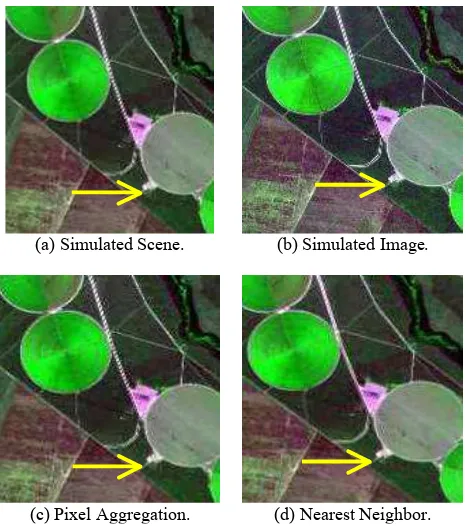
In the following figures, they are presented the results of (a) simulated scene (result of offsetting of the MTF, atmosphere and topography effects), (b) the simulated image by the proposed method, (c) resampled image by Pixel Aggregation and (d) resampled image by Nearest Neighbor.
The results were evaluated according to criteria of visual analysis, statistical analysis and radiometric profile.
Analyzing the images with an overview it is observed that they possess some differences arising from the decimation effect as can be observed on the target indicated by the arrow in the colored composition (3R5G2B) in Figure 3. The Nearest Neighbor, while preserves the color variation, deforms the elements of the scene. The Pixel Aggregation keeps better the details of the scene, but it changes the relationship among the shades of gray. The simulator proposed in this paper provides a better visual quality than other methods, since it keeps the color relationship and idea of detail in the image.
(a) Simulated Scene. (b) Simulated Image.
(c) Pixel Aggregation. (d) Nearest Neighbor.
Figure 3. Resampling Methods. International Archives of the Photogrammetry, Remote Sensing and Spatial Information Sciences, Volume XXXIX-B5, 2012
(a) Simulated Scene. (b) Simulated Image.
(c) Pixel Aggregation. (d) Nearest Neighbor.
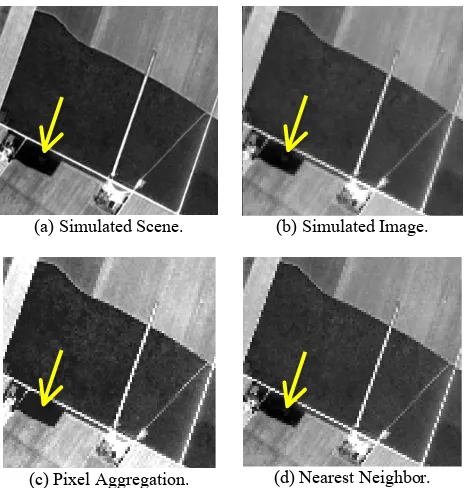
Figure 4. Red band – Resampling Differences.
The Figure 4 and 5 show the result of the same experiment taking into account only the Red Band. The arrow indicates the different effects in the same region of the image. In this high contrast area it is noticed better maintenance of the elements of scene in the simulated image
(a) Simulated Scene. (b) Simulated Image.
(c) Pixel Aggregation. (d) Nearest Neighbor.
Figure 5. Red band – Resampling Differences.
The Figure 6 shows the result in the Infra-Red Band. As shown previously, this experiment only with this band corroborates with the results already found, indicating the preservation of the elements of scene by the proposed simulator.
Another way to analyze the results is from the statistics of images. The averages values and standard deviation of the original and simulated images are displayed in Table 3. The average parameter indicates how the image is unchanged with respect to the creation of new values in the grayscale image. The standard deviation parameter shows the amount of change of the digital levels variation in the image. It is noticed that the proposed simulator has more satisfactory results since it keeps the average close to the original image and by comparison with other methods, has a greater value of standard deviation, which shows that the resampler causes less effect in the simulator. It is important to mention that, in fact, the standard deviation values should be smaller than the original image, since the simulated image has less detail and therefore less variance
Table 3. Average Values and Standard Deviation for the presented methods.
Images Mean St.Dev.
Red Band
RAPIDEYE 116 81
Simulated 116 78
PA 126 64
NN 125 64
Infrared Band
RAPIDEYE 121 54
Simulated 121 51
PA 121 50
NN 121 50
(a) Simulated Scene. (b) Simulated Image.
(c) Pixel Aggregation. (d) Nearest Neighbor.
Figure 6. InfraRed band – Resampling Differences.
Another way to evaluate the results is from the radiometric profile.
The radiometric profile was performed by selecting a random row of the original image and its correspondents in the resampled images and simulated to a radiometric behavior analysis of the same.
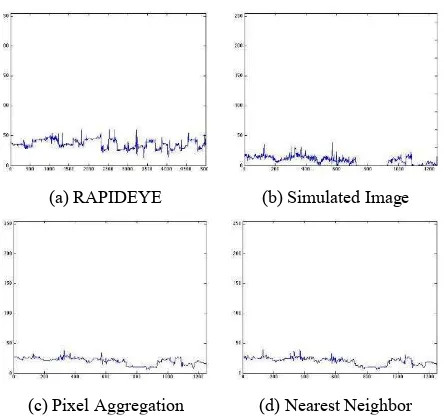
Figure 7 shows the result of the green band profile for the methods studied.
(a) RAPIDEYE (b) Simulated Image
(c) Pixel Aggregation (d) Nearest Neighbor
Figure 7. Green band radiometric profile for the methods studied.
It is noticed the biggest variation in the Simulated Image by the proposed simulator, relative to only resampled images, corroborating with the values obtained in the statistical analysis. To validate the methodology, another experiment was done by simulating LANDSAT images from RAPIDEYE images of 01/10/2009. At the end, it was compared the simulated images with LANDSAT5/TM images acquired on 29/09/2009. Thus, it is possible to compare the obtained result with a real data. The Figure 8 shows the colored composition (3R2G1B) of RAPIDEYE image, the simulated image and the real LANDSAT image.
(a) RAPIDEYE.
(b) Simulated Image. (c) LANDSAT5/TM.
Figure 8. Colored composition (3R2G1B) of (a) RAPIDEYE image, (b) simulated image and (c) real LANDSAT image.
The simulated and LANDSAT images present a great visual similarity, as much in color as in spatial details.
Figure 9 shows the comparison of band 3 (red) of other region of the images.
(a) RAPIDEYE.
(b) Simulated Image. (c) LANDSAT5/TM.
Figure 8. Red Band of (a) RAPIDEYE image, (b) simulated image and (c) real LANDSAT image.
Again it is noticed the similarity between the simulated and LANDSAT images as much spatially as radiometrically. The Figure 10 shows the radiometric profile of the same line of the experiment images.
(a) RAPIDEYE.
(b) Simulated Image.
(c) LANDSAT5/TM.
Figure 9. Red band radiometric profile of (a) RAPIDEYE image, (b) simulated image and (c) real LANDSAT image.
The Table 4 presents the average values and standard deviation of the images.
Table 4. Average Values and Standard Deviation for the presented images.
Images Mean St.Dev.
Band 3 Red
RAPIDEYE 82 17.4
Simulated 84 12.3
LANDSAT5/TM 85 11.5
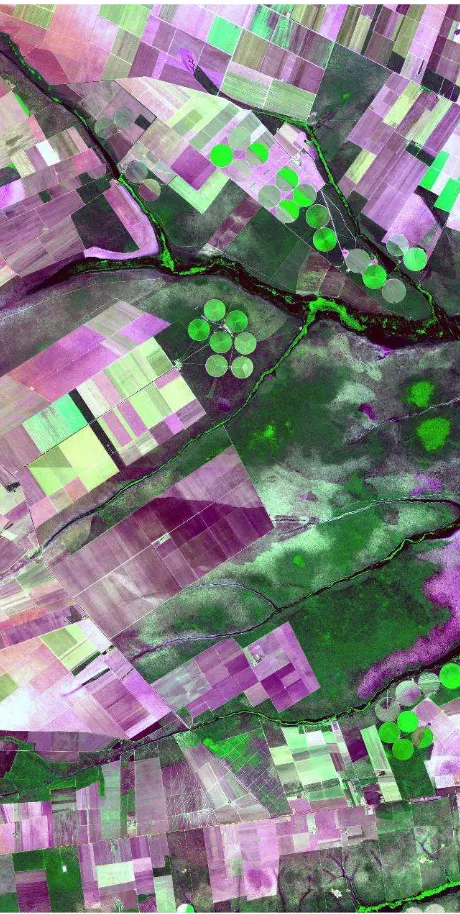
The Figure 11 shows a colored composition (3R5G2B) simulated of the study region. This is the look of a MUX/CBERS-3 image, using as reference a RAPIDEYE image.
Figure 11 – Simulated MUX/CBERS-3 – Colored Composition (3R5G2B).
4. CONCLUSIONS
This paper presented a simulation image methodology based in the determination of the Modulation Transfer Function by Zernike polynomials and in the redress the effects of atmosphere, topography and blurring of the electronic of system. An extensive research, tests and evaluations of RAPIDEYE and CBERS-3 systems were performed. The proposed simulation method showed better results than the traditional resamplers, as the pixels aggregation and nearest neighbor. LANDSAT images were simulated and compared with real images to validate the methodology. Initial tests has shown the efficiency of the new method. More robust tests should be done to actually prove the better performance of the proposed simulator.
5. REFERENCES
Beckett, K.; Robertson, B.; Steyn, J.; Parkway, C. MTF characterization and deconvolution of rapideye imagery. Proceedings CD-ROM. IGARSS 2010.
Boggione, G. A.; Fonseca, L. M. G. Restoration of Landsat-7 Images. In: INTERNATIONAL SYMPOSIUM ON REMOTE SENSING OF ENVIRONMENTA, 30L (ISRSE), 2003, Hawai, HA. Proceedings... 2003.
Boggione, G.; Fonseca, L. M. G.; Carvalho, L. A.; Ponzoni, F. J. Image restauration and its impact on radiometric measurements. In: GEOSCIENCE AND REMOTE SENSING SYMPOSIUM (IGARSS), 2010, Honolulu. Proceedings... 2010. p. 2218-2221.
Dias, J; Wei, H. CRITICAL DESIGN REVIEW, CBERS 3&4. Instituto Nacional de Pesquisas Espaciais – INPE; São José dos Campos – SP, 2010. (unpublished).
Goodman, J. Introduction to Fourier Optics. Copywrite, 1996. McGrawhill Companies Inc. New York. New York. 2nd Ed.
Vermotte, E. F.; Tanré, D.; Deuzé, J. L.; Herman, M.; Morcrette, J. J. Second simulation of the satellite signal in the solar spectrum: User manual. University of Maryland /Laboratoire d’Optique Atmospherique, 1994.
Papa, J.P.; Mascarenhas, N.D.A.; Fonseca, L.M.G.; Benseeba, K. 2008. Convex restriction sets for CBERS-2 satellite image restoration. International Journal of Remote Sensing, 29(2), p. 443-458.
Schott, J. R. Remote sensing the image chain approach. New York, NY: Oxford University, 1997.
6. AKNOWLEDGMENTS
The authors would like to thank CAPES (Coordination for Supporting and Development Superior Education Personnel, www.capes.br) and CNPq (National Council for Research, www.cnpq.br) for providing financial support to develop this research.