IMPLEMENTING AN ADAPTIVE APPROACH FOR DENSE STEREO-MATCHING
Christos Stentoumisa, Lazaros Grammatikopoulosb, Ilias Kalisperakisb, George Karrasa
a
Laboratory of Photogrammetry, Dept. of Surveying, National Technical University of Athens, GR-15780 Athens, Greece b
Laboratory of Photogrammetry, Dept. of Surveying, Technological Educational Institute of Athens, GR-12210 Athens, Greece ([email protected],[email protected], [email protected], [email protected])
KEYWORDS: Matching, Correlation, Surface, Reconstruction, Point Cloud
ABSTRACT
Defining pixel correspondences in stereo-pairs is a fundamental process in automated image-based 3D reconstruction. In this con-tribution we report on an approach for dense matching, based on local optimization. The approach represents a fusion of state-of-the-art algorithms and novel considerations, which mainly involve improvements in the cost computation and aggregation processes. The matching cost which has been implemented here combines the absolute difference of image colour values with a census transforma-tion directly on images gradient of all colour channels. Besides, a new cost volume is computed by aggregating over cross-window support regions with a linearly defined threshold on cross-window expansion. Aggregated costs are, then, refined using a scan-line optimization technique, and the disparity map is estimated using a ‘winner-takes-all’ selection. Occlusions and mismatches are also handled using existing schemes. The proposed algorithm is tested on a standard stereo-matching data-set with promising results. The future tasks mainly include research on refinement of the disparity map and development of a self-adaptive approach for weighting the contribution of different matching cost components.
1. INTRODUCTION
Generation of dense 3D information using calibrated image sets is an integral part of several applications in the field of photo-grammetry and computer vision, e.g. in 3D reconstruction, DSM production, novel view synthesis or automatic navigation. Typi-cally, image-based 3D modeling requires the automation of two distinct processes that involve the establishment of correspon-dences among images, namely image orientation and dense 3D surface reconstruction. Although we have implemented an algo-rithm for automatically recovering orientations of (calibrated) images via point correspondences, this falls outside the scope of the present work in which the question of dense stereo matching is addressed. In the following, image orientation parameters are assumed as known, and images are rectified to epipolar geome-try to restrict search space (1D search along epipolar lines).
Accurate disparity maps (storing the x-parallax for every image pixel), extracted from stereo imagery, often serve as the basic source of 3D data since they combine effectiveness along with low cost compared to active acquisition techniques such as laser scanning. During the last decade a large number of efficient al-gorithms have been proposed for estimating accurate disparity maps from single stereo-pairs. The effectiveness of such algo-rithms has been extensively evaluated in surveys (Scharstein & Szeliski, 2002, Hirschmüller & Scharstein 2009) and a dedica-ted web site (http://vision.middlebury.edu/stereo/). After Schar-stein & Szeliski (2002), the computation of dense stereo corres-pondences may be broken down into four main steps.
• Matching cost initialization, where for every individual pixel a cost value is assigned to all possible disparities. Typical costs rely on a similarity measure of the intensity or colour values for corresponding pixels, such as the absolute or square differences and normalized cross-correlation. All above measures, in addi-tion, may be replaced or even combined with other costs which are more robust to radiometric differences, to texture-less areas or to regions with proximity to occlusion borders. Thus Klaus et
al. (2006) have used a weighted sum of colour intensities and image gradients; Hirschmüller (2008) has employed the Mutual Information approach in a semi-global context, while Mei et al. (2011) have combined absolute colour differences with a non- parametric image transformation (census).
• Cost aggregation. This step is founded on the assumption that neighbouring pixels share the same disparity, thus a summation (aggregation) of initial pixel-wise matching costs (from the first step) is carried out over a support region around each pixel. The simplest form of such support regions are rectangular windows of fixed or variable size. Fixed windows with weights varying with colour similarity and spatial proximity to the central pixels (Yoon & Kweon, 2006), as well as regions of arbitrary shape, e.g. of the cross-type (Zhang et al., 2009), rely on the further as-sumption that neighbouring pixels with similar disparities have similar colours; they are proved to be more accurate, especially for areas close to occlusions.
• Disparity refinement. This final step is taken in order to eli-minate or correct ambiguous/inaccurate disparity values by fur-ther processing the disparity map obtained in the previous step. Commonly used procedures include scan-line optimization, me-dian filtering, sub-pixel estimation, region voting, peak removal or occluded and mismatched area detection as well as interpola-tion (Hirschmüller, 2008; Zhang et al., 2009; Mei et al., 2011).
In this paper we present an implementation for stereo-matching which integrates several state-of-the-art techniques for all above steps, while proposing certain improvements for the cost com-putation and cost aggregation processes. In particular, the pro-posed matching cost combines through an exponential function the absolute difference of the image colour values (RGB) along with a census transformation not on the intensity values but on the gradient images of all three colour channels. The costs of all pixels of the reference image over all possible disparities are stored in the form of a Disparity Space Image (DSI) (Bobick & Intille, 1999). Secondly, a new cost volume is computed by an aggregation of costs over cross-window support regions, similar to Zhang et al. (2009) and Mei et al. (2011). However, in our approach a linear threshold is imposed on cross-window expan-sion, which combines the two thresholds (colour similarity and spatial proximity) of Mei et al. (2011) in a smoother way. The aggregated costs are further refined using a scan-line optimiza-tion technique (Mattoccia et al., 2007; Mei et al., 2011), and the disparity map is estimated using a ‘winner-takes-all’ selection. Occlusions and mismatches are also detected using the scheme of Hirschmüller (2008), and new disparity values are interpola-ted. Finally, sub-pixel estimation is performed in order to im-prove the final disparity map. The proposed algorithm is evalu-ated on the Middlebury stereo-matching data-set.
2. COST FUNCTION
Over the years, a wide variety of measures for the implementa-tion of matching approaches has been proposed in literature. In a survey of stereo matching costs (Hirschmüller & Scharstein 2009), the most important among them have been presented and assessed. The most usual measures are the Absolute Difference, the Squared Difference, the Normalized Cross Correlation and measures relying on filters that transform the input images, such as the median, the mean, LoG or more sophisticated tools like bilateral filtering (Tomasi & Manduchi, 1998). Non-parametric transformations, as the rank and the census transformations (Za-bih & Woodfill, 1994), produce robust results based on relation-ships of pixels with their neighbourhood. The Mutual Informa-tion approach has been proposed as a more advanced cost func-tion for dealing with stereo-images with radiometric differences (Hirschmüller, 2008). Furthermore, pixel-wise descriptor mea-sures, like DAISY (Tola et al., 2010), have yielded promising re-sults in global formulations for wide-based stereo.
2.1 Census
Census (c) is a non-parametric image transformation. A binary vector of pixel p forms a map of neighbouring pixels, whose in-tensity is less than that of p (Zabih & Woodfill, 1994) for a sup-port neighbourhood N. As a result, a binary vector I of length mN×nN is assigned to each pixel. Thus, if q is a neighbour of p:
Census transformation depends on the relations of a pixel with its surroundings within the image patch. It is thus robust against changes in brightness/contrast. Moreover, individual pixel in-tensities do not cumulatively affect the overall measure but only a specific bit of the binary descriptor of the reference pixel p. Thus, census improves matching results in texture-less regions, around discontinuities and in cases of noisy pixels.
In the present implementation, the transformation is performed not on gray-scale intensity but on each colour channel of the original image as well as on the two principal directions of the image gradient. This approach provides a considerably extend-ed vector IC (Eq. 3):
whereby ⊗ denotes the act of concatenation. For RGB images, for instance, use of the gradient of each channel in each of the x, y image directions results in a vector of dimension ×6 compa-red to the original vector. Census transform based on the image gradients appears to be more robust and less sensitive to radio-metric differences, whereas the discriminative capability of this binary descriptor increases, leading to results of higher accura-cy. The matching cost between a pixel p in the reference image and its corresponding pixel p' in the matching image for a parti-cular disparity value d is calculated through the Hamming dis-tance CCensus (Hamming, 1950), which represents the number of unequal elements in the two binary vectors.
2.2 Absolute Difference
The Absolute Difference (AD) is a simple measure widely used in matching. Though sensitive to radiometric differences, it has been proved as an effective measure when it is combined with flexible aggregation areas and it refers to combination of all co-lour layers. The cost term CAD is defined as the average AD va-lue of all three channels (Eq. 4), which leads to superior results compared to matching on separate channels or gray-scale:
( )
(
( )
( )
)
2.3 Total matching cost
Figure 1. Above: the original Tsukuba stereo-pair. Middle: gra-dients in x (left) and y (right) of the left image on the first chan-nel. Below: disparity map of the left image obtained from Cen-sus on intensity (left) and CenCen-sus on RGB/gradients with AD in cost function (right) after the aggregation step.
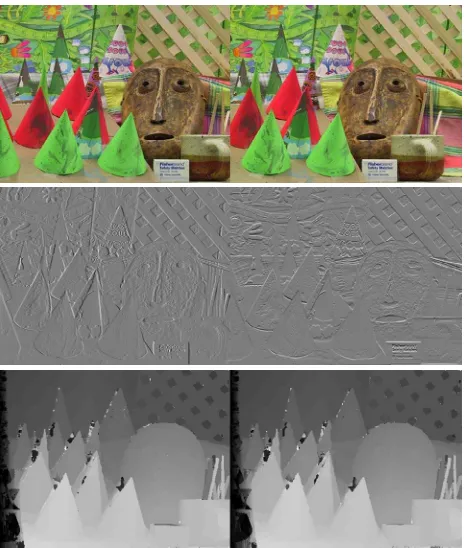
Figure 2. Example for the Cone stereo-pair with its gradient and disparity images (for explanations see caption of Fig. 1).
The function ρ has the advantage of taking values in the field of [0, 1) for C ≥ 0. The two cost volumes CAD and CCensus are thus scaled in the same value field, presuming a suitable selection of the respective regularization factors λAD, λCensus. The values of each cost should be regularized by λ so that in ρ(x) 0.5≤C≤1.5
to ensure equal contribution to the final cost, or tuned different-ly to accordingdifferent-ly adjust the impact of each term on cost. Tests were performed on the Middlebury data-set for stereo-matching (Scharstein & Szeliski, 2002, 2003). In Fig. 1 an example from this data-set (Tsukuba) is given which illustrates the differences in disparity due to the application of Census on gradient images as described here. Fig. 2 presents a further example (Cone). No noticeable change is observed in this second example, but in the first case results display a significant improvement. There is a 1.5% decrease in ‘bad’ pixels in the Tsukuba pair when compa-ring for erroneous disparities above the 1 pixel threshold. Also, the proposed algorithm is among the best performing in the sub-pixel comparison of the same pair. Finally, in Fig. 3 the errors in the matching results of the proposed cost function are seen as compared to the true (reference) disparity maps of the data-set at the >1 pixel level.
Figure 3. Left: reference disparity maps of the left image of the Tsukuba and Cone stereo-pairs. Right: matching errors due to occlusions (gray) and mismatches (black).
3. COST AGGREGATION
Local methods seek to fix an adequate support region where to aggregate the cost, which accounts for a disparity label of all pi-xels included in the neighbourhood. There exist three main ap-proaches through which one may address this question: use of support weights, adaptive windows and multiple window sizes. Methods based on support weights make use of a window fixed in size and shape. Within this window a weight is attributed to each pixel, calculated according to colour similarity and geome-tric proximity (Tomasi & Manduchi, 1998; Yoon & Kweon, 2006) or other criteria (Yihua et al., 2002). Adaptive windows represent an attempt to find the optimal shape and size of a sup-port region, often leading to windows of irregular shapes. Such cases are shiftable windows or windows anchored at pixels dif-ferent than the central one (Bobick & Intille, 1999; Kang et al., 2001; Fusiello et al., 1997). The third approach relies on local variation of intensity and disparity (Kanade & Okutomi, 1991; Veksler, 2003). Theory from the field of image filtering, on the other hand, has contributed the idea of shape-adaptive windows which are based on separate circular sectors across multiple directions around a pixel (Foi et al., 2007; Lu et al., 2008). Fi-nally, other processes on multiple windowing have been propo-sed by Fusiello et al. (1997) and Kang et al. (2001).
of pixel neighbourhood. It is supposed that the pixels within this neighbourhood share the same disparity; front-parallel surfaces are thus favoured. Foundation of adaptive approaches is the fact that pixels of a support region ought to have similar colours and to decrease in coherence ‘normally’ with their distance from the reference pixel in image space. In a recent work, geometric pro-ximity has been combined with colour similarity in the CIELab colour space in an attempt to improve simulation of human per-ception (Yoon & Kweon, 2006). In the process of locating opti-mal shape and size of a cost aggregation region around a pixel, a fast and efficient algorithm has been introduced resulting in windows of the cross-type having arbitrary shape (Zhang et al., 2009); more recently, an extended GPU-efficient version of this approach was proposed (Mei et al., 2011), which is currently at the top of the comparison list for the threshold of 1 pixel errors in the Middlebury stereo-evaluation site.
3.1 Support region formation
In this paper, a modification of the cross-based support region approach is used. The construction of such cross-based support regions is achieved by expanding around each pixel p a cross-shaped skeleton to create 4 segments (h+, h−, v+, v−) defining two sets of pixels H(p), V(p) in the horizontal and vertical di-rections as seen in Fig. 4 (Zhang et al., 2009; Mei et al., 2011).
H(p) H(q)
p
q
S(p) V(p)
Figure 4. Expansion of the cross-based support region S(p) dri-ven by the skeleton of each pixel. The skeleton pixels for V(p) and H(p) sets are calculated only once per pixel. When pixel q belongs to V(p), the corresponding horizontal arm H(q) is add-ed to S(p). S(p) consists of the union of H(q) for all pixels q which participate in V(p). [After Zhang et al., 2009.]
The support region S(p) is expanded in the horizontal direction for each pixel q which belongs to the vertical direction of the skeleton (qє V(p)). This expansion is restrained by imposing two thresholds on spatial distance, one on image space and one in colour (RGB) space. The expansion length of each pixel q is defined only once for each pixel of the image when calculating H(p) and V(p). With respect to the disparity space image (DSI) representation, this corresponds to a two-step cost aggregation process. First, for pixel qiє V(p) all costs belonging to H(qi) are aggregated horizontally, and then all aggregated costs in pixels qiє V(p) are aggregated on the examined pixel p. Of course, this two-step cost aggregation can be carried out by first opera-ting on the horizontal arm H(p), thus aggregating each V(qi), and then adding the costs along H(p) in p. However, implemen-ting aggregation first in vertical arms or using the intersection of these two different processes have given results with no sub-stantial differences. The determined cross-window can be based either solely on the left (reference) image or also generated on the right (matching) image. In this latter case of combined win-dows, one employs the intersection of the two cross windows
(S(p(x,y))∩S(p(x,y+d))). The results are expected to be more robust, since the projective distortions and radiometric differen-ces between patches on the reference and the matching images are taken into account. As a result, the support region has a dif-ferent shape for each possible disparity value (disparity label).
Mei et al. (2011) have proposed two thresholds for colour simi-larity and two for spatial closeness. In our approach, a linear threshold is imposed on window expansion (Eq. 7):
( )
maxq q max
max
τ
τ l l +τ L
=
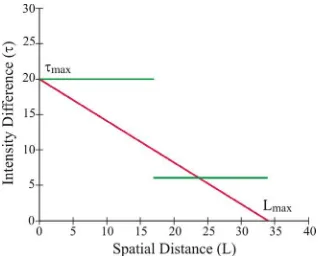
− × (7)This linear threshold in colour similarity is a function of the va-riables. These express: a) the maximum semi-dimension Lmax of the window size; and b) the maximum colour disimilarity τmax between pixels p and q (Fig. 5). This appears to produce slight-ly better results in Middleburry datasets, but mainslight-ly it renders the two manually given input variables redundant, while at the same time thresholding of colour difference τ according to spa-tial closeness lq from the skeleton becomes smoother. The diffe-rence τ between successive pixels is also checked after Mei et al. (2011). Typical support regions generated according to the above considerations are presented in Fig. 6.
Figure 5. Threshold τ(lq) imposed on colour difference between pixels p and q is linearly reduced (red curve) as q approaches the limit of maximum window size. The green lines depict the form of the two thresholds originally proposed in literature for handling extended texture-less image areas.
Figure 6. Examples of the regions formed with the linear ap-proach for the generation of cross-based windows.
3.2 Aggregation step
Aggregation is applied on cost-disparity volume using the com-bined support region S. The aggregated pixel costs Caggr are nor-malized by the number of pixels in the support region to ensure that costs per pixel have the same scale (Eq. 8):
( )
C( )
aggr C p, d =S p, d
We note that generally a [3×3] median filter is applied for cross-skeleton determination. Moreover, the minimum length of all cross-segments is one pixel to ensure a minimum support region S of 9 pixels. The estimation of disparity is done in the ‘winner-takes-all’ mode, i.e. by simply selecting the disparity label with the lowest cost.
4. POST PROCESSING
4.1 Scan-line Optimization
In order to increase the effectiveness of the matching algorithm in low-texture areas, but also eliminate any possible ambiguities of the final disparity map, a scan-line optimization framework is adopted. The aggregated cost (from previous steps) for every pixel and possible disparities are updated with the sum of the minimum cost paths/directions leading to this pixel. This ‘semi-global matching’ technique, introduced by Hirschmüller (2005), is also used by Mattoccia et al. (2007) and Mei et al. (2011) to optimize region-based aggregated costs. Final cost is obtained here by summing up the cost from the 4 dominant directions (2 horizontal, 2 vertical) as proposed in the latter two publications.
4.2 Constraints
• Left-right consistency. Match consistency (cross-checking) between reference and matching images is a common reliable tool for evaluating the quality of disparity maps (Brown et al., 2003; Banks, 2001). It is easy to implement in local stereo algo-rithms (though computational load is doubled if ‘naively’ im-plemented). A pixel p is characterized as valid (inlier) if the fol-lowing constraint holds for the disparity maps Dmap of the re-ference and matching images:
( )
(
( )
0)
base match base
map map map
D p = D p−
⎡
⎣
D p ,⎤
⎦
(9)The left-right consistency check does not make any distinction among outliers of different origins, yet it performs well in eli-minating erroneous depth estimates.
•Ordering constraint is another consistency measure often met in literature, which explores the relative order of pixels on the same epipolar line and rests on the assumption of object surface continuity. Nevertheless, this is not always the case for real-life scenes; furthermore, in our experiments its results had nothing substantial to add to the left-right consistency checks.
4.3 Occlusion/mismatch labeling
In the preceding step outliers are located in the disparity map. These outliers may originate from different sources. Two main categories, however, are of special importance for developing an interpolation strategy: occlusions and mismatches. In Bobick & Intille (1999) and Brown et al. (2003) one may find effective approaches; however, a powerful technique is that proposed by Hirschmüller (2008). A graph depicting the disparity line Dmatch of the matching image and the epipolar line of the reference image is created. Outliers are classified to either mismatches or occlusions based on whether the epipolar line of the reference image intersects the disparity line of the matching image. Sub-sequently, mismatches within a neighbourhood of occlusions are also characterized as occlusions.
For rejected pixels characterized as mismatches a new disparity
value is given through median interpolation in a small neigh-bourhood around them. Occluded pixels, on the other hand, are given the second lowest disparity value in their neighbourhood as their new disparity value. This common approach is based on the fact that occlusion pixels are most likely to share the same disparity value with their prevailing background. A 5-connected grid is proposed here, situated on the left side of the pixel oc-cluded on the left image, as pixels close to edges in this image are most likely to have the same disparity with neighbouring pi-xels on their left. However, an occluded area will be assigned a new disparity value only if this is smaller than the original dis-parity value, since the latter is expected to originate from the background.
The above procedure regarding mismatches and occlusions is iterative in order to gradually replace disparities of all outliers with more valid values, moving from boundaries to the centre of ‘disparity gaps’ in the map. It is noted that mismatches are corrected prior to occlusion-filling. In Fig. 7 an example for the improvement of matching results after this refining treatment of mismatches and occlusions is shown.
Figure 7. Disparity map of the left Tsukuba image before (left) and after (right) occlusions and mismatches have been handled.
4.4 Sub-pixel refinement
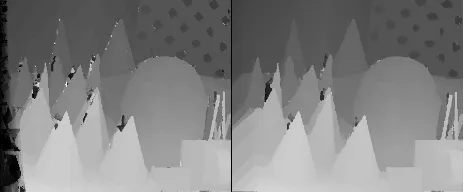
Finally, a sub-pixel estimation is made by interpolating a 2nd or-der curve to the cost volume C(d). This curve is defined by the disparities of the preceding and following pixels of the ‘winner-takes-all’ solution and their corresponding cost values. Optimal sub-pixel disparity value d* is determined by the minimum cost position, through a closed form solution for the 3 curve points (d* = argmind(C(d)). An example illustrating the effect of the overall post-processing refinement is seen below (Fig. 8).
Figure 8. Disparity map of the left Cone image before (left) and after (right) the overall refinement.
5. CONCLUDING REMARKS
focusing on issues such as improvement of the support region definition via image gradients; post-processing steps to improve our satisfactory initial cost in occluded areas; search for a self-adaptive term for weighting the contribution of multiple costs; use of census on gradients in diagonal directions. It is also in-tended to expand our approach by a hierarchical scheme in or-der to accommodate high resolution (including aerial) images.
REFERENCES
Barnard S.T., 1986. A stochastic approach to stereo vision. 5th National Conference on Artificial Intelligence, pp. 676-689.
Banks J., 2001. Quantitative evaluation of matching methods and validity measures for stereo vision. International Journal of Robotics Research, 20(7), pp. 512-532.
Bobick A.F., Intille S.S., 1999. Large occlusion stereo. Interna-tional Journal of Computer Vision, 33(3), pp. 181-200.
Brown, M., Burschka D., Hager G., 2003. Advances in compu-tational stereo. IEEE Transactions on Pattern Analysis and Ma-chine Intelligence, 25(8), pp. 993-1008.
Faugeras O., Keriven R., 1998. Variational principles, surface evolution, PDE’s, level set methods, and the stereo problem.
IEEE Transactions on Image Processing, 7(3):336–344, 1998.
Foi A., Katkovnik V., Egiazarian K., 2007. Pointwise shape-a-daptive DCT for high-quality denoising and deblocking of gray-scale and color images. IEEE Transactions on Image Process-ing, 16(5), pp. 1395-411.
Fusiello A., Roberto V., Trucco E., 1997. Efficient stereo with multiple windowing. IEEE Conference on Computer Vision and Pattern Recognition, pp. 858-863.
Hirschmüller H., 2005. Accurate and efficient stereo processing by semi-global matching and mutual information. IEEE Conf. on Computer Vision and Pattern Recognition, 2, pp. 807-814.
Hirschmüller H., 2008. Stereo processing by semiglobal match-ing and mutual information. IEEE Transactions on Pattern Ana-lysis and Machine Intelligence, 30(2), pp. 328-41.
Hirschmüller H., Scharstein D., 2009. Evaluation of stereo matching costs on images with radiometric differences. IEEE
Trans. on Pattern Analysis & Machine Intelligence, 31(9), pp. 1582-1599.
Kanade T., Okutomi M., 1991. A stereo matching algorithm with an adaptive window: theory and experiment. International Conference on Robotics and Automation, pp. 1088-1095.
Kang S.B., Szeliski R., Chai J., 2001. Handling occlusions in dense multi-view stereo. IEEE Conference on Computer Vision and Pattern Recognition, I,pp. 103-110.
Klaus A., Sormann M., Karner K., 2006. Segment-based stereo matching using belief propagation and a self-adapting dissimila-rity measure. IEEE Conf. on Pattern Recognition, pp. 15-18.
Kolmogorov V., Zabih R., 2001. Computing visual correspon-dence with occlusions using graph cuts. IEEE Conference on Computer Vision, pp. 508-515.
Lu J., Lafruit G., Catthoor F., 2008. Anisotropic local high-con-fidence voting for accurate stereo correspondence. Proc. SPIE, vol. 6812, pp. 12.
Mattoccia S., Tombari F., Stefano L.D., 2007. Stereo vision en-abling precise border localization within a scanline optimization framework. Asian Conf. on Computer Vision, pp. 517–527.
Mei X., Sun X., Zhou M., Jiao S., Wang H., Zhang X., 2011. On building an accurate stereo matching system on graphics hardware. ICCV Workshop on GPU in Computer Vision Appli-cations.
Scharstein D., Szeliski, R., 2002. A taxonomy and evaluation of dense two-frame stereo correspondence algorithms. Interna-tional Journal of Computer Vision, 47(1), pp. 7-42.
Scharstein D., Szeliski, R., 2003. High-accuracy stereo depth maps using structured light. IEEE Conference on Computer Vi-sion and Pattern Recognition, I, pp. 195-202.
Strecha C., Fransens R., van Gool L., 2004. A probabilistic ap-proach to large displacement optical flow and occlusion detec-tion. ECCV Workshop SMVP, Springer, pp. 71–82.
Strecha C. 2007. Multi-view stereo as an inverse inference pro-blem. PhD Thesis, Katholieke Universiteit Leuven, Belgium.
Strecha C., Hansen W., van Gool L., Fua P., Thoennessen U., 2008. On benchmarking camera calibration and multi-view stereo for high resolution imagery. IEEE Conference on Computer Vision and Pattern Recognition, pp. 1-8.
Sun J., Zheng N.-N., Shum H.-Y., 2003. Stereo matching using belief propagation. IEEE Transactions on Pattern Analysis & Machine Intelligence, 25(7), pp. 787-800.
Tola E., Lepetit V., Fua, P., 2010. DAISY: An efficient dense descriptor applied to wide-baseline stereo. IEEE Trans. on Pat-tern Analysis & Machine Intelligence, 32(5), pp. 815-830.
Tomasi C., Manduchi R., 1998. Bilateral filtering for gray and color images. IEEE Conf. on Computer Vision, pp. 839-846.
Veksler O., 2003. Fast variable window for stereo correspon-dence using integral images. IEEE Conference on Computer Vi-sion and Pattern Recognition, I(1), pp. 556-561.
Veksler O., 2005. Stereo correspondence by dynamic program-ming on a tree. IEEE Conference on Computer Vision and Pat-tern Recognition, 2, pp. 384-390.
Yang Y., Yuille A., Lu J., 1993. Local, global, and multilevel stereo matching. IEEE Conf. on Computer Vision and Pattern Recognition, pp. 274–279.
Yoon K., Kweon I., 2006. Adaptive support-weight approach for correspondence search. IEEE Transactions on Pattern Ana-lysis and Machine Intelligence, 28(4), pp. 650-656.
Zabih R., Woodfill J., 1994. Non-parametric local transforms for computing visual correspondence. European Conference on Computer Vision, pp. 151-158.