OPTIMIZATION OF FOREST AGE-DEPENDENT LIGHT-USE EFFICIENCY AND ITS
IMPLICATIONS ON CLIMATE-VEGETATION INTERACTIONS IN CHINA
Z. Li a,b and T. Zhou a,b* a
State Key Laboratory of Earth Surface Processes and Resource Ecology, Beijing Normal University, Beijing, [email protected]
b
Academy of Disaster Reduction and Emergency Management, Ministry of Civil Affairs and Ministry of Education, Beijing, China- [email protected]
KEY WORDS: NPP, Stand age, Maximum light-use efficiency, Climate change
ABSTRACT:
Forest’s net primary productivity (NPP) is a key index in studying interactions of climate and vegetation, and accurate prediction of
NPP is essential to understand the forests’ response to climate change. The magnitude and trends of forest NPP not only depend on climate factors (e.g., temperature and precipitation), but also on the succession stages (i.e., forest stand age). Although forest stand age plays a significant role on NPP, it is usually ignored by remote sensing-based models. In this study, we used remote sensing data and meteorological data to estimate forest NPP in China based on CASA model, and then employed field observations to inversely estimate the parameter of maximum light-use efficiency (εmax) of forests in different stand ages. We further developed functions to describe the relationship between maximum light-use efficiency (εmax) and forest stand age, and estimated forest age-dependent NPP based on these functions. The results showed that εmax has changed according to forest types and the forest stand age. For deciduous broadleaf forest, the average εmax of young, middle-aged and mature forest are 0.68, 0.65 and 0.60 gC MJ-1. For evergreen broadleaf forest, the average εmax of young, middle-aged and mature forests are 1.05, 1.01 and 0.99 gC MJ-1. For evergreen needleleaf forest, the average εmax of young, middle-aged and mature forests are 0.72, 0.57 and 0.52 gC MJ
-1
.The NPP of young and middle-aged forests were underestimated based on a constant εmax. Young forests and middle-aged forests had higher εmax, and they were more sensitive to trends and fluctuations of climate change, so they led to greater annual fluctuations of NPP. These findings confirm the importance of considering forest stand age to the estimation of NPP and they are significant to study the response of forests to components of the carbon cycle (Piao et al., 2008; Liang et al., 2015) and also an indicator to the ecosystem performance (Lobell et al., 2002). Climate change has deeply affected the ecosystem and NPP has become a significant tool to reflect the variation of the ecosystem (Hao et al., 1998; Liu et al., 2015). In general, the forest ecosystem NPP accounted for 35% of the global and 65% of the terrestrial ecosystem NPP (Gower et al., 1996; Waring and Schlesinger, 1985). The variation in forest NPP will change the atmospheric CO2 concentration and further affect the climate change (Want et al., 2011). The difference in the forest stand ages and forest types are critical factors to the forest ecosystem, and it is essential to investigate the variation of the forest NPP with the forest stand ages among forest types (Chen et al., 2003; Song and Woodcock, 2003; Kashian et al., 2006). The Carnegie-Ames-Stanford Approach (CASA) model (Potter et al., 1993) based on the remote sensing data is widely used to simulate the spatial distribution of the NPP and it can also be employed to monitor NPP at different scales (Li et al., 2009). The accuracy of the estimated NPP based on the CASA model has been mostly affected by the maximum light-use
efficiency (εmax), and it exists differences among forest types and the forest stand ages (Zhu et al., 2006; Hui et al., 2012 ). The maximum light-use efficiency could influence the carbon sink of the ecosystem, and reflect the forest ecosystem productivity (Zhou et al., 2010). Potter and Field think that the maximum light-use efficiency of all the vegetation types around the world is 0.389 gC/MJ, and Raymond et al believe that the
upper limit of the maximum light-use efficiency is 3.5 gC MJ-1. Thus, it is essential to determine the maximum light-use efficiency based on the forest stand ages among forest types (Potter et al., 1993; Raymond et al., 1994; Field et al., 1995, 1998). In this study, the CASA model was employed to estimate NPP in China from 1982 to 2005. We calculated the maximum light-use efficiency of forests in the forest stand ages based on the estimated NPP and the field observation NPP. The relationship between the maximum light-use efficiency and the forest stand ages could be developed to reflect the impact of change in the forest stand ages on the maximum light-use efficiency, and the estimated age-dependent NPP could also be calculated based on the relationship.
2. DATA AND METHODS
2.1 Remote sensing data
with the ability to reflect the vegetation dynamics (Eidenshink, 1992; Holben, 1986).
2.2 Meteorological data and the land cover map
This study employed the monthly average temperature, the monthly precipitation data and the monthly total solar radiation data during the period 1982 to 2005 from the National Climate Centre of the Chinese Meteorological Administration (CMA). The homogeneity and reliability of the monthly meteorological data have been previously checked and controlled by the CMA (Yu et al., 2014). The related longitude, latitude and the altitude of the meteorological stations are also used in this study to interpolate the meteorological data based on the GIS methods. The cell size matches with the NDVI dataset. The Land Cover map used in this study was originated from the MODIS Landcover dataset, and the classification of the vegetation type was chosen type 1 (ISTP).
2.3 Field observation data of NPP
The NPP field observation data originates from the forest inventory data and Luo’s study based on the 1266 forest plots from 1982 to 2005. It includes the forest stand age, the LAI, the total biomass, the longitude, latitude and altitude of the observation sites. It is used to correct the maximum light-use efficiency (εmax) of the CASA model among different forest types in the forest stand ages. Based on the available field observation of the NPP, the forest types that considered in this study include the deciduous broadleaf forest (DBF), the evergreen needleleaf forest (ENF) and the evergreen broadleaf forest (EBF).
2.4 CASA model
Carnegie-Ames-Stanford Approach (CASA) model (Potter et al., 1993) can estimate monthly NPP with satellite data, monthly temperature, precipitation and soil properties (Liu et al., 2015; Zhang et al., 2015). The CASA model can simulate the spatial distribution and the variation of NPP on a regional scale and it has been widely used to monitor the NPP for various spatial scales. In CASA model, the NPP is the function of Absorbed Photosynthetic Active Radiation (APAR), the maximum light-use efficiency (εmax), the effect of the temperature stress index (Tε) and the moisture stress factor (Wε). For a given geographic coordinate (x) at month t, NPP is calculated as,
(1)
(2)
(3)
where Rs is the incoming shortwave radiation, FPAR is the fraction of photosynthetic active radiation absorbed by vegetation, which is determined from the satellite data (NDVI). Other model parameters, such as the annual maximum and minimum NDVI for each vegetation type, are considered corresponds to the 95% and 5% quantiles of the probability distribution of the monthly NDVI in each vegetation type (Liang et al., 2015).
2.5 Statistical methods
The estimate NPP based on the CASA model is largely affected by the maximum light-use efficiency (εmax). In this study, we employed the field observation NPP to correct the εmax for the forest stand ages among forest types.
(4)
where NPP is the field observation data of NPP, NPPm is the estimated NPP based on the meteorological data and the remote sensing data (NDVI), εa is the fixed value for all the vegetation types and all the forest age, and here the value is 0.43.
The NPPm is separated by the forest types and the forest stand ages, thus the εmax for different forest types and the forest stand ages have different values. The εmax of various field observation sites are grouped by the forest types and the forest stand ages. To investigate the relationship between the forest stand ages and the εmax, the forest stand ages were separated into 12 groups. The forest stand ages that less than 15 years are regarded as group 1, and the forest stand ages between the 15years and the 30 years were regarded as group 2,…, and the forest stand ages more than 165 years are regarded as group 12.
3. RESULTS
3.1 The estimated NPP of the forest types
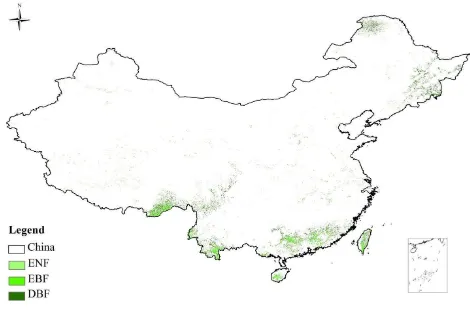
Figure 1. The spatial distribution of three selected forests in China
The forest types NPP(gC m-2a-1)
ENF 388
EBF 438
DBF 420
Table 1 The estimated NPP based on the constant εmax for three forest types
The forest is major in South China, and there are still some forests in Northeast China. The evergreen needleleaf forest mainly distributes in the east of China, and some north regions in China. The evergreen broadleaf forest is mainly in the South China, and also some places in the east China. The deciduous broadleaf forest is usually located in South China, and the northeast China.
The estimated NPP based on the constant maximum light-use efficiency (εmax) vary for different forest types. For the evergreen needleleaf forest, the average NPP during the period 1982 to 2005 is about 388 gC m-2 a-1. For the evergreen broadleaf forest, the average NPP is about 438 gCm-2a-1. For the deciduous broadleaf forest, the average NPP is about 420 gCm-2a-1 (Table 1). The evergreen broadleaf forest has the largest NPP than the other two forest types, and the evergreen needleleaf forest has the least NPP based on the constant εmax.
3.2 The relationship between the maximum light-use efficiency (εmax) and the forest stand ages
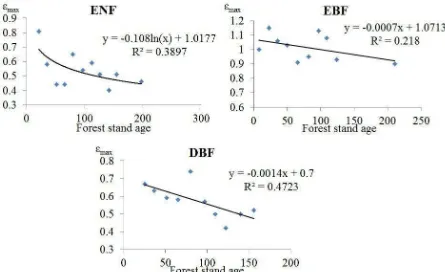
The maximum light-use efficiency (εmax) of different stand ages is based on the field observation data NPP. The field observation data NPP is separated by different forest types, and then grouped by the forest stand ages. The number of the study sites in different forest stand ages is also summed up. Here we investigate three forest types including the evergreen broadleaf forest (EBF), the deciduous broadleaf forest (DBF) and the evergreen needle forest (ENF). The relationship between the
Figure 2 The relationship between the forest stand age and the maximum light-use efficiency (εmax) of three forest types From Fig.2, The regression equation of the evergreen needleleaf
forest is y=-0.108 * ln(x) + 1.0177. The determination of the correlation coefficients (R2) is 0.3897. The εmax has decreased as the forest ages increase, but the relationship between the εmax and the forest stand ages are non-linear. The regression equation of the evergreen broadleaf forest is y=-0.0007 * x + 1.0713. The R2 is 0.218. The ε
max has decreased as the forest stand ages increase, and the relationship is linear. The regression equation of the deciduous broadleaf forest is y=-0.0014 * x + 0.7. The R2 is 0.4723. The εmax has decreased as the forest ages increase, and the slope is higher than the evergreen broadleaf forest. The relationship between the εmax and the forest stand ages are also linear.
3.3 The maximum light-use efficiency (εmax) of forests in different stand ages
The corrected maximum light-use efficiency (εmax) has indicated that the great differences exist among different forest types. Based on the research data about the forest stand ages in China, the forest stand ages are first separated by the forest types, and then grouped by the young forest, middle-aged forest and the mature forest. For the deciduous broadleaf forest, the average
εmax of young, middle-aged and mature forest are 0.68, 0.65 and 0.60 gC MJ-1. For the evergreen broadleaf forest, the average
εmax of young, middle-aged and mature forests are 1.05, 1.01 and 0.99 gC MJ-1. For the evergreen needleleaf forest, the average εmax of young, middle-aged and mature forests are 0.72, 0.57 and 0.52 gC MJ-1. In general, the average εmax of evergreen broadleaf forest is larger than the deciduous broadleaf forest, and the minimum of the average εmax is the evergreen needleleaf forest. The average εmax of young forest is higher than the middle-aged forest, and the mature forest has the lowest εmax. 3.4 The estimated forest age-dependent NPP
The maximum light-use efficiency (εmax) of the young, middle-aged and the mature forests are separated by the forest
stand ages, and the forest types including the evergreen needleleaf forest, the evergreen broadleaf forest and the deciduous broadleaf forest are also considered in the study. Based on the estimated NPP of forest types and the εmax of different stand ages, the estimated NPP of different stand ages are calculated. For the evergreen needleleaf forest, the estimated NPP of young, middle-aged and mature forest are about 650 gC m-2a-1, 514 gC m-2a-1 and 469 gC m-2a-1. For the evergreen broadleaf forest, the estimated NPP of young, middle-aged and mature forest are about 1069 gC m-2a-1, 1028 gC m-2a-1 and 1008 gC m-2a-1. For the deciduous broadleaf forest, the estimated NPP of young, middle-aged and mature forest are about 664 gC m-2a-1, 635 gC m-2a-1 and 586 gC m-2 a-1.
4. DISCUSSION
deciduous broadleaf forest. The εmax of evergreen broadleaf forest is always underestimated by the constant εmax, which will also lead to the underestimate of NPP. The evergreen broadleaf forest has the maximum deviation of the NPP for the young, middle-aged and the mature forest. The εmax of the evergreen broadleaf forest among the young, middle-aged and the mature forest change little, but it also has the decreased trend as the young forest to the mature forest. In general, the estimated NPP based on the constant εmax are underestimated especially for the young and middle-aged forest. For the evergreen needleleaf forest, the deviation of the NPP in young and middle-aged broadleaf forest has the largest deviation in NPP, and the young forest for the forest types have higher deviation of NPP than the middle-aged forest and the mature forest. Young forests and middle-aged forests had higher εmax, and they are more sensitive to climate change. The NPP of young and middle-aged forest should consider the variation of the forest stand age.
5. CONCLUSION
This study employed both the meteorological data and the remote sensing data to estimate the NPP of three forest types including the evergreen needleleaf forest (ENF), evergreen broadleaf forest (EBF) and deciduous broadleaf forest (DBF) based on the CASA model. The original CASA model based on the fixed maximum light-use efficiency (εmax) does not consider the effect of the forest stand ages among forest types, and it will lead to the deviation in the estimate of NPP. This study first estimate the NPP based on the CASA model and then employed field observations to inversely estimate the parameter of maximum light-use efficiency of forests in different stand ages. The relationship between maximum light-use efficiency and the forest stand ages was functioned to estimate forest age-dependent NPP. The results showed that εmax has changed according to forest types and forest stand ages. The deciduous broadleaf forest, evergreen broadleaf forest and evergreen needleleaf forest all have decreased trend as the forest stand ages increase. The evergreen broadleaf forest has the higher εmax than the other two forest types. For deciduous broadleaf forest, the average εmax of young, middle-aged and mature forest are 0.68, 0.65 and 0.60 gC MJ-1. For evergreen broadleaf forest, the average εmax of young, middle-aged and mature forests are 1.05, 1.01 and 0.99 gC MJ-1. For evergreen needleleaf forest, the average εmax of young, middle-aged and mature forests are 0.72, 0.57 and 0.52 gC MJ-1. The evergreen broadleaf forest has the largest deviation in NPP, and the young forest for the forest types have higher deviation of NPP than the middle-aged forest and the mature forest. Young forests and middle-aged forests 41321001), the National Basic Research Program of China (No. 2012CB955401), the National Natural Science Foundation of China (No. 30970514), and the New Century Excellent Talents in University (No. NCET-10-0251).
REFERENCES
Beck H E, McVicar T R, Dijk A I J M, Schellekens J, Jeu R A M, and Bruijnzeel L, 2011. Global evaluation of four AVHRR-NDVI data sets: Intercomparison and assessment against Landsat imagery. Remote Sensing of Environment. 115(10), pp. 2547-2563. data set. Photogrammetric Engineering and Remote Sensing, 58, pp. 809-813.
Gower S T, McMurtrie R E and Murty D, 1996. Aboveground net primary production decline with stand age: potential causes. Trends in Ecology and Evolution. 11, pp. 378-382.
Hao Y P, Chen Y F and Zhang X Y, 1998. Progress in estimation of net primary productivity and its responses to climatic change. Advanced Earth Science, 13(6), pp. 564-571. Holben B N, 1986. Characteristics of maximum-value composite images from temporal AVHRR data. International Journal of Remote Sensing, 7, pp. 1417-1434. Carbon storage on landscapes with stand-replacing fires. BioScience. 56, pp. 598-606.
Li X J, Zhou T and He X Z, 2009. Carbon sink of forest ecosystem driven by NPP increasing in China. Journal of Natural Resources, 24(3), pp. 491-497.
Liu C Y, Dong X F and Liu Y Y, 2015. Changes of NPP and their relationship to climate factors based on the transformation of different scales in Gansu, China. Catena, 125, pp. 190-199. Liang W, Yang Y T, Fan D M, Guan H D, Zhang T, Long D, Zhou Y and Bai D, 2015. Analysis of spatial and temporal patterns of net primary production and their climate controls in China from 1982 to 2010. Agricultural and Forest Meteorology. 204, pp. 22-36.
Potter C S, Randerson J T, Field C B, Matson P A, Vitousek P M, Mooney H A and Klooster S A, 1993. Terrestrial ecosystem production: a process model based on global satellite and surface data. Global Biogeochemistry Cycles. 7(4), pp. 811-841. Song C H and Woodcock, 2003. A regional forest ecosystem carbon budget model: impacts of forest age structure and landuse history. Ecological Modelling. 164, pp. 33-47.
Tucker C J, Pinzon J E, and Brown M E, Slayback, D A, Pak E W, Mahoney R, Vermote E and Saleous N E, 2005. An extended AVHRR 8-km NDVI dataset compatible with MODIS and SPOT vegetation NDVI data. International Journal of Remote Sensing. 26(20):pp.4485-4498.
Wang S Q, Zhou L, Chen L M, Ju W M, Feng X F and Wu W X, 2011. Relationships between net primary productivity and stand age for several forest types and their influence on China’s carbon balance. Forest of Environmental Management. 92, pp. 1651-1662.
Waring R H and Schlesinger W H, 1985. Forest ecosystems: concepts and management. Academic Press, New York. Yu M X, Li Q F, Hayes M J, Svoboda M D and Heim R R, 2014. Are droughts becoming more frequent or severe in China based on the Standardized Precipitation Evapotranspiration Index: 1951-2010? International Journal of Climatology. 34(3): pp. 545-558.
Zhang L X, Zhou D C, Fan J W and Hu Z M, 2015. Comparison of four light-use efficiency models for estimating terrestrial gross primary production. Ecological Modelling. 300, pp. 30-39.