PRELIMINARY RESEARCH ON RADIANCE FOG DETECTION BASED ON TIME
SERIES MTSAT DATA
Xiongfei Wen a,*, Zhe Li a , Sui Zhang a, Shaohong Shen a, Dunmei Hu b , Xiao Xiao a
a
Changjiang River Scientific Research Institute, Changjiang Water Resources Commission, Wuhan 430010, PR China- [email protected]
b
Department of Pharmacy, Tongji Hospital Affiliated with Tongji Medical College, Huazhong University of Science and Technology, Wuhan, China 430032, PR China
KEY WORDS: Radiance fog, MTSAT, time series, Haar wavelet, frequency domain
ABSTRACT:
Fog is a kind of disastrous weather phenomenon. In this paper, the geostationary satellite MTSAT imagery is selected as the main data source to radiance fog detection. According to the unique feature of radiance fog from its generation to dissipation, especially considering the difference between clouds and fog during their lifecycle, the characteristics in frequency domain was constructed to discriminate fog from clouds, The time series MTSAT images were register with a modified Gauss Newton optimization method firstly, then, the Savitzky-Golay smoothing filter was applied to the time series remote sensing imageries to process the noises in the original signal, after that the non-orthogonal Haar wavelets was applied to convert the signal from time domain into frequency domain. The coefficient of high frequency component, including the properties: “max”, “min”, “the location of the min”, “the interval length between the max and min”, “the coefficient oflinear fit for the high frequency”, these properties are selected as the characteristic parameters to distinguish fog from clouds. The experiment shows that using the algorithm proposed in this paper, the radiance fog could be monitored effectively, and it is found that although it is difficult to calculate the thickness of the fog directly, while the duration of fog could be obtained by using the frequency feature.
* Corresponding author: Xiongfei Wen, Tel.: +86-27-82926550; Fax.:+86-27-82820076 1. INTRODUCTION
1.1 Background
As a relative frequently disastrous weather phenomenon, fog can reduce regional or local visibility, deteriorate air quality and cause problems for nautical operations, aviation and surface transportation. It also produces a great hazard to power equipment, crop growth and human health (Li, 2008). Therefore, it is very important to monitor fog in quasi real time. Conventional ground observation is a precise method for fog detection, but it requires much human, as well as economical, resources. Routine forecast methods, such as meteorological statistical approximations and numerical-prediction models, also cannot provide satisfactory forecast results because of their limitations, which include lacking of enough and accurate land surface/air observation data or relevant information, shortcomings inherent from these methods, etc (Ma, 2007).
Fog detection methods based on remote sensing technology use many kinds of satellite data, from geostationary to polar-orbiting satellites, through to observing the Earth‟s surface repeatedly on a large scale. It would be convenient in fog detection by using the high temporal resolution satellite. With the increasing development of satellite remote sensing technology, data sources will be more numerous, reliable and stable, which makes fast and dynamic fog detection possible.
1.2 Introduction of MTSAT
The Multi-functional Transport Satellite (MTSAT) series are a series of weather and aviation control satellites. They are
geostationary satellites owned and operated by the Japanese Ministry of Land, Infrastructure and Transport and the Japan Meteorological Agency (JMA), and provide coverage for the hemisphere centered on 140° East. The MTSAT series succeeds the Geostationary Meteorological Satellite (GMS) series as the next generation of satellites covering East Asia and the Western Pacific. MTSAT-1R was successfully launched on February 26, 2005 and became operational on June 28, 2005, while MTSAT-2 successfully launched on February 18, 2006 and is positioned at 145° East(JMA, 2006).
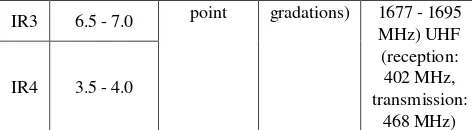
The MTSAT series provides imagery for the Northern Hemisphere every 30 minutes in contrast to the previous hourly rate, enabling JMA to more closely monitor typhoon and cloud movement. The MTSAT series carries a new imager with a new infrared channel (IR4) in addition to the four channels (VIS, IR1, IR2 and IR3) of the GMS-5. MTSAT imagery is more effective than GMS-5 imagery in detecting low-level cloud/fog and estimating sea surface temperatures at night and has enhanced brightness levels, enabling a whole new level of image imagery (JMA, 2006). The technical specification of payloads of MTSAT is shown in Table 1.
Wavelength (μm)
Resolutio n
Brightness
level Frequency
VIS 0.55 - 0.90 1 km (VIS) and 4 km (IR) at the sub-satellite
10 bits for both VIS and IR channels
(1,024
S-band (reception: 2026 - 2035
MHz, transmission: IR1 10.3 - 11.3
IR2 11.5 - 12.5
The International Archives of the Photogrammetry, Remote Sensing and Spatial Information Sciences, Volume XL-7/W3, 2015 36th International Symposium on Remote Sensing of Environment, 11–15 May 2015, Berlin, Germany
This contribution has been peer-reviewed.
IR3 6.5 - 7.0 point gradations) 1677 - 1695
Table 1. Technical specification of payloads of MTSAT
2. FOG DETECTION WITH TIME SERIES MTSAT IMAGERIES
2.1 Existing methods
Research on fog monitoring and forecasting based on remote-sensing techniques has been carried out for many years. In the early stage, fog and stratus were discriminated by their different reflectance characteristics from other clouds in the visible band. Hunt(Hunt, 1973) theoretically proved that the small droplets found in fog produce a lower emissivity at 3.7μm than at 10.8μm, while the emissivity at these two bands is roughly the same for larger droplets. The difference in emissivity will cause a differentiation between the brightness temperatures at the mid-infrared band, and the thermal mid-infrared bands. Eyre et al. (Eyre 1984) and Turner et al. (Turner, 1986) use the brightness-temperature difference between the 10.8 and 3.7μm band of the National Oceanic and Atmospheric Administration (NOAA) Advanced Very High Resolution Radiometer (AVHRR) data, known as the „dual-channel different temperature method‟, to detect fog and stratus cloud at night. This algorithm has been ported successfully to geostationary platforms, such as the Geostationary Operational Environmental Satellite Imager (GOES-8) and the Spinning Enhanced Visible and Infrared Imager (SEVIRI) on board the Meteosat Second Generation (MSG) (Cremak,2008). In recent years, with the extensive application of the Earth Observing System (EOS) Moderate Resolution Imaging Spectroradiometer (MODIS) data, fog detection during daytime using MODIS data becomes a new focus point. Bendix et al. (Bendix,2006) developed a radiative-transfer-based classification scheme for MODIS data and derived mini-mum/maximum albedo values for modeled fog layers in several spectral channels using the Streamer radiative-transfer model. These extreme values are then applied as thresholds in each of the channels, with all values in between classified as fog. Inspired by the difference of microphysical characteristics between fogs and clouds, Deng et al. (Deng, 2006)selected the spectral characteristics of MODIS channels 1, 6, 20 and 31 to simulate fog and cloud by utilizing the SBDART radiative-transfer model, and proposed a fog-monitoring algorithm based on the simulations by analyzing a fog case. Liu et al. (Liu,2011) selected MODIS channels 1, 6, 20 to simulate the reflectance of fog and high/middle/low cloud by utilizing the Streamer radiative-transfer model, and proposed NDFI (Normalized Difference Fog Index) as an new feature to discriminate fog from high/middle/low cloud based on the analyzing three fog case covering in Eastern China. Based on Liu's research, Wen et al. (Wen,2014) found the NDFI feature could discriminate fog from high /middle/low cloud in the perspective of spectrum, while fractal dimension feature could describe fog and high/middle/low cloud in the perspective of texture. The NDFI feature of fog is lower than clouds and the fractal dimension feature of fog is also lower than clouds, based on this, a new fog-monitoring algorithm based on combined the NDFI and fractal dimension is proposed.
Radiation fog generally appears at night or in the early morning, and then it will gradually dissipate as the sun rises. means there is a strong diurnal variation characteristics of radiation fog, many researchers have in depth research with MODIS in fog detection, while due to the limitations of its transit time (local time 10:30 AM), at this time radiation fog is likely already in its dissipating stage, using MODIS data alone is often difficult to be objective and accurate detection of radiation fog, and it is also difficult to obtain the fog distribution of time-spatial varying information. For this situation, the geostationary satellite such as MTSAT is a kind of suitable data sources.
2.2 Fog detection with time series imagery
Clouds and fog have unique micro-physical characteristics, and clouds and fog really exist certain similarities, especially low cloud and fog is difficult to discriminate. During the generation to dissipation of radiance fog, the change in the time series remote sensing images could show its unique feature in reflectance, brightness temperature, and difference value in brightness temperature during the lifecycle of fog, while clouds do not have the obvious characteristics during its generation to dissipation. The difference during the lifecycle between fog and clouds is more significant than only using one piece of remote sensing imagery.
The high temporal resolution stationary satellite imageries could be regarded as a kind of time series data, the time frequency conversion methods such as Fourier transform, and Wavelet analysis could be applied to process the time series data, the features including “brightness temperature”, “reflectance”, and “the difference in brightness temperature” for clouds, fog and clear land surface could be extracted and analyzed in time domain and frequency domain to construct the characteristic parameters from the time series stationary satellite imageries.
Wavelets are a recently developed mathematical tool for signal analysis. Wavelets are used as a kernel function in an integral transform, much in the same way that sines and cosines functions used in the Fourier analysis. Now the primary application of wavelets has been in the areas of signal processing, image compression, medical imaging, etc. Compared to Fourier analysis, a Fourier series requires that all time functions involved be periodic. In addition, Fourier analysis does not consider frequencies that evolve in time. Finally, Fourier techniques suffer from certain annoying anomalies such as Gibbs phenomenon. Wavelets, on the other hand, can be chosen with very desirable frequency and time characteristics as compared to Fourier techniques, the wavelet transform uses short windows at high frequencies and long windows at low frequencies. Thus the windowing of wavelet transforms is adjusted automatically for low or high frequencies or a low frequency, and each frequency component gets treated in the same manner without any reinterpretation of the results (Guan, 2007)
.
The time-series MTSAT images involves a set of MTSAT images taken from the same scene at different acquisition times. Considering the noise or the error during the data transmission or data producing procedure in the preprocess of the MTSAT time series images, it is necessary to register the time series images firstly. In this paper, we adopt a modified Gauss Newton optimization method to find out higher accurate registration of
The International Archives of the Photogrammetry, Remote Sensing and Spatial Information Sciences, Volume XL-7/W3, 2015 36th International Symposium on Remote Sensing of Environment, 11–15 May 2015, Berlin, Germany
This contribution has been peer-reviewed.
the time series images by calculating the minimum standard deviation between the registered images.
Then, considering the noise distributed in the time series images, the Savitzky-Golay smoothing filter should be applied to perform a local polynomial regression on a distribution to determine the smoothed value for each pixel at each time phase. Savitzky-Golay filter could preserve features in the original signal such as relative maxima, minima and width, which are usually flattened by other adjacent averaging techniques.
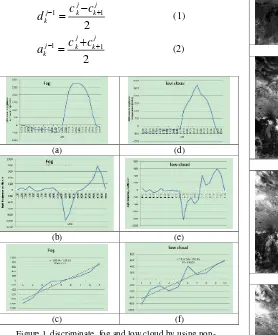
After the preprocess the input time series signal could be decomposed into approximate part and detail part by using discrete wavelet transform, the approximate part is obtained by the low-pass filter to reflect the approximate coefficients of the input signal, while the detail part is obtained by the high-pass filter to indicate detail coefficients of the input signal. The simplest discrete wavelet transform is Haar wavelets. Figure 1 shows the difference after the wavelet transform between low cloud and fog. In this section the non-orthogonal Haar wavelets is applied, the calculate formula is below:
1 1
2
j j
j k k
k
c
c
d
(1)
1 1
2
j j
j k k
k
c
c
a
(2)
(a) (d)
(b) (e)
(c) (f)
Figure 1. discriminate fog and low cloud by using non-orthogonal Haar wavelets: (a) original signal of fog, (b)fog‟s high frenquency part after Haar wavelet transform, (c) original signal of low cloud, (d)low cloud‟s high frenquency part after Haar wavelet transform,(e) the line fitting for fog signal, (f) the
line fitting for low cloud signal
The coefficient of high frequency components, including the “max”, “min”, “the location of the min”, “the interval length between the max and min”, “the coefficient of linear fit for the high frequency”, these properties are selected as the
characteristic parameters to distinguish fog from clouds. It is difficult to calculate the thickness of the fog directly, while the duration of fog could be obtained by using “the interval between the max and min” described in this section.
3. EXPERIMENT AND VALIDATION
For validation of this new technique, a series of MTSAT images covering Eastern China were selected and processed in the manner described in section 2. The MTSAT during the 24 December 2006 to 25 December 2006 is selected, just shown in Figure 2,the fog distribution area includes Anhui, Jiangsu , Hebei , Henan and Hubei Province. As ground-truth data, Surface Weather Chart (SWC) datasets provided by the China Meteorological Administration (CMA) were used.
(a) (b)
(c) (d)
(e) (f)
(g) (h)
The International Archives of the Photogrammetry, Remote Sensing and Spatial Information Sciences, Volume XL-7/W3, 2015 36th International Symposium on Remote Sensing of Environment, 11–15 May 2015, Berlin, Germany
This contribution has been peer-reviewed.
(i)
Figure 2. Case analysis with MTSAT from Dec 24-24,2006: (a)-(h) the different in band 4 and band1 from 2333UTC to
0633UTC, (i) the fog distribution map with different duration(from yellow to red, continuance from 1 hour to 8 hours)
In-situ
Remote sensing
Fog No fog
Fog 36 65
No fog 25 412
overall accuracy 83.27%
Kappa coefficient 0.3529
Table 2. Accuracy Assessment
4. CONCLUSION AND DISCUSSION
In this paper, according to the time series feature of radiance fog and cloud and the limitations in the existing fog detection method, the MTSAT data is selected as the main remote sensing data source. The time series MTSAT images were register with a modified Gauss Newton optimization method firstly, then, the Savitzky-Golay smoothing filter was applied to to the time series remote sensing imageries to process the noises in the original signal. After that, the non-orthogonal Haar wavelets was applied to make up the characteristics feature in frequency domain to discriminate radiance fog from clouds and land surface. The experiment shows that using the algorithm proposed in this paper, the radiance fog could be monitored effectively, and although it is difficult to calculate the thickness of the fog directly, the duration of fog could be extracted accurately with high temporal imageries. In the future research, the thickness of fog and the duration of fog should be combined to find the relationship between these feature.
ACKNOWLEDGMENTS
This work was funded through a grant from the National Scientific Fund of China (No. 41201452, No. 41409021, No. 41401487) and the Basic Research Operating Expenses for the Central-level Non-profit Research Institutes of China (No. CKSF2015018/KJ, No. CKSF2015019/KJ). The authors would like to thank the staff of the Japan Meteorological Agency for their support.
REFERENCES
[1] Li, Z., Yang, J. and Shi, C., 2008, The Physics of Regional Dense Fog, pp. 1–7, Beijing: China Meteorological Press. [2] Ma, H., 2007, The research of remote sensing radiation fog
detection in land based on EOS MODIS data. PhD thesis, Wuhan University, China.
[3]
http://www.jma.go.jp/jma/jma-eng/satellite/about_mt/2.Meteorological_payload.html
[4] Hunt, G., 1973, Radiative properties of terrestrial clouds at visible and infrared thermal window wavelengths.Quarterly Journal of the Royal Meteorological Society, 99, pp.346–369. [5] Eyre, J.R., Brownscombe, J.L. and Allam, R.J., 1984, Detection of fog at night using Advanced Very High Resolution Radiometer.Meteorological Magazine, 113, pp.266–271. [6] Turner, J., Allam, R.J. and Maine, D.R., 1986, A case study of the detection of fog at night using channel 3 and 4 on the Advanced Very High Resolution Radiometer (AVHRR).Meteorological Magazine,115, pp. 285–290.
[7] Cremak, J. and Bendix, J., 2008, A novel approach to fog/low stratus detection using Meteosat 8 data.Atmospheric Research,87, pp. 279–292.
[8] Bendix, J., Thies, B., Nauss, T., et al, 2006, A feasibility study of daytime fog and low stratus detection.with TERRA/AQUA-MODIS over land. Meteorological Applications,13, pp. 111–125.
[9] DENG, J., BAI, J. and LIUJ., 2006, Detection of daytime fog using MODIS multispectral data.Meteorological Science and Technology,34, pp.188–193.
[10] Liu, Liangming; Wen, Xiongfei; Gonzalez, Albano; Tan, Debao; Du, Juan; Liang, Yitong; Li, Wei; Fan, Dengke; Sun, Kaimin; Dong, Pei; Xiang, Daxiang; Zhou, Zheng(2011). An object-oriented daytime land-fog-detection approach based on the mean-shift and full lambda-schedule algorithms using EOS/MODIS data. INTERNATIONAL JOURNAL OF REMOTE SENSING, 32(17), 4769-4785.
[11] Wen, Xiongfei; Hu, Dunmei; Dong, Xinyi; Yu, Fan; Tan, Debao; Li, Zhe; Liang, Yitong; Xiang, Daxiang; Shen, Shaohong; Hu, Chengfang; Cao, Bo (2014). An object-oriented daytime land fog detection approach based on NDFI and fractal dimension using EOS/MODIS data. INTERNATIONAL JOURNAL OF REMOTE SENSING, 35(13), 4865-4880. [12] Guan, L.,.Introduction to Wavelet analysis, 2007. Beijing : Higher Education Press.
The International Archives of the Photogrammetry, Remote Sensing and Spatial Information Sciences, Volume XL-7/W3, 2015 36th International Symposium on Remote Sensing of Environment, 11–15 May 2015, Berlin, Germany
This contribution has been peer-reviewed.