COMPARING MULTI-SOURCE PHOTOGRAMMETRIC DATA DURING THE
EXAMINATION OF VERTICALITY IN A MONUMENTAL TOWER
J. Markiewicz*, D. Zawieska, P. Podlasiak
Division of Photogrammetry, Remote Sensing and GIS, Faculty of Geodesy and Cartography, Warsaw University of Technology, (j.markiewicz, d.zawieska,p.podlasiak)@gik.pw.edu.pl
Commission II
KEY WORDS: cultural heritage, tower verticality, structure from motion (SFM), multi-view stereo (MVS), terrestrial laser scanning (TLS), UAV
ABSTRACT:
This paper presents an analysis of source photogrammetric data in relation to the examination of verticality in a monumental tower. In the proposed data processing methodology, the geometric quality of the point clouds relating to the monumental tower of the castle
in Iłżawas established by using terrestrial laser scanning (Z+F 5006h, Leica C10), terrestrial photographs and digital images sourced via unmanned aerial vehicles (UAV) (Leica Aibot X6 Hexacopter). Tests were performed using the original software, developed by the authors, which allows for the automation of 3D point cloud processing. The software also facilitates the verification of the verticality of the tower and the assessment of the quality of utilized data.
1. INTRODUCTION
The current measuring technologies allow for complete photogrammetric documentation using passive and active measuring methods to develop. Data integration enables the complex development of models, including models of cultural heritage objects. Terrestrial laser scanning has been a popular measurement technique in this field. The development of image processing algorithms has resulted in the increased use of digital imagesfor both terrestrial and low-altitude aerial purposes. The selection of an appropriate measurement technique is important for the correct processing of photogrammetric data concerning cultural heritage objects. Therefore, knowledge of the effectiveness of selected techniques and their limitations is also important.
The objective of this paper is to compare the point clouds’
geometric quality concerning the monumental tower in the
castle in Iłża, acquired from terrestrial laser scanning (Z+F
5006h, Leica C10), terrestrial photographs and digital UAV images (Leica Aibot X6 Hexacopter). Tests were performed using the original software, developed by the authors, which allows for the automation of 3D point cloud processing. The software allows for the verticality of the tower and the assessment of the quality of utilized data to be verified. Investigations presented in the paper were performed as part of the following research project: “The use of laser scanning and remote sensing in the conservation, investigations and inventory regarding cultural heritage: the development of non-invasive, digital methods of documenting and recognizing
architectural and archaeological heritage objects”. This project
fell within the scope of the Programme of the Minister of
Science and Higher Education’s “National Programme for the
Development of Humanities” in the period 2012-2015.
2. RELATED WORKS
Measurements of the changes in the shapes of objects, as well as the deviations and deformations of big, slender structures, are among the most important issues facing engineering geodesy. Inventory measurements are of high importance, as they deliver
information concerning the current conditions of objects. Many methods are applied when measurements related to the determination of the verticality of slender objects are performed. In practice, conventional methods of measurements are still applied. The following methods may be mentioned in the context of conventional methods for the determination of the deviations in axes of a tower construction from the vertical plane: intersections, direct projections and bisectors of tangent directions to the surface. In the cases involving the monitoring of slender objects, GPS technology-based methods are more frequently applied (Erol, et. al, 2004, Wan Aziz, et. al, 2005, Park et. al, 2004). Photogrammetric methods are also used (Achille et al., 2015; Mass and Hampel, 2006; Bernasik and Mikrut, 2007). Laser scanning methods are becoming more popular, as they allows for the spatial determination of locations involving big sets of points on the surface of a slender object (Danilo et al, 2006; Fidera et al, 2004). The mathematical analysis of data requires the application of specified algorithms, which allow for the substitution of data in a simpler body or surface form; this is commonly known as spatial modelling. Mathematical data analysis consists of categorizing models of simple bodies (cylinders, cubesand cones), simple figures (circles) or planes into specified groups of points.
(Gawałkiewicz, 2007).
3. DESCRIPTION OF THE SOURCE DATA
The ruins of the Kraków Bishops’ Castle in Iłża are those
Figure 1: A sketch of the ruins of the castle in Iłża (source: Markiewicz et. al, 2015)
A detailed subject of the analysis discussed in this paper was a monumental tower (Fig. 2), located at the edge of an escarpment. Both its location and dimensions require particular attention with regard to the positioning of the measuring stations. On the one hand, the high tower (H=26 m) is inaccessible for the purpose of direct measurements (Fig. 2), while the partial projection of its shape is possible, on the other hand.
Figure 2: General view of the tower of the castle in Iłża
In order to verify the tower’s verticality, datasets acquired
by different sensors from different altitudes were used. They include cloud points from (Fig. 3):
close-range scanner (Z+F 5006h) medium-range scanner (Leica C10) processed UAV photographs (Aibot X6)
processed terrestrial photographs (Canon 5D Mark II)
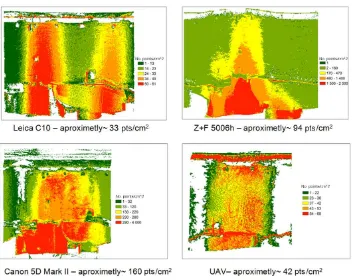
Figure 3: Point clouds acquired from different sensors
In order to assess the density of the point clouds, an analysis of the number of points per cm2 was performed (Fig. 4). The highest density was achieved as a result of processing (SFM+MVS) images, while the lowest density was obtained for the terrestrial Leica scanner. This was a result of the long scanning distance.
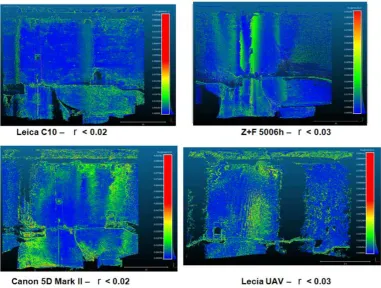
After the analysis of the projection quality of the measured surfaces, it was stated that the best results were obtained using the Leica C10 scanner, while the point clouds were acquired via UAV image matching (Fig. 5).
Figure 5: The quality of the point clouds of the projected tower surface acquired from different sensors (r: roughness of point clouds)
4. METHODOLOGY FOR THE EXAMINATION
OF THE TOWER’S VERTICALITY
In order to determine the tower’s verticality, the original data
processing algorithm was applied. In the first stage, the point clouds were divided into sections with a thickness of 10 cm. Next, particular sections were projected onto one plane of the average elevation for a given section. Then, using OpenCV procedures, ellipses with determined centres were fitted into sections:
vector <Point2f> punkty; RotatedRect box = cv::fitEllipse(punkty);
//ellipse parameters class CV_EXPORTS RotatedRect
{ ...
Point2f center; //< the rectangle mass center Size2f size; //< width and height of the rectangle
float angle; //< the rotation angle. };box.size.width, box.size.height
In the next stage, distances between an ellipse and points are analysed in order to eliminate gross errors (Fig. 6).
This procedure was applied for all point clouds acquired from different sensors.
5. ANALYSIS OF RESULTS
The density of points in the sections was analysed; it was stated that particular sections contained the following numbers of points (Fig.7):
Leica: approximately 10,000 points UAV: approximately 7,500 points Terrestrial photographs: between 40,000
and 75,000 points (10 x UAV)
Z+F: between 40,000 and160,000 points
Interpolated values of the tower diameter at different heights were compared; the results are presented in Fig. 7. It can be seen that the bottom part of the tower (to 12 m) is wider; the incorrect projection of the shape of the stairs can be also seen. At approximately 25 m, a roof appears, which was also incorrectly projected. The coherence of the results for all sensors may be observed in the central part of the tower.
Figure 7: Diagram of the values of the tower diameter at different heights
The values of the deviations in the point clouds from the theoretical ellipse were also analysed (Fig.8). It can be seen that the smallest values were obtained from the data acquired by the Leica scanner, while the worst results were obtained by the Z+F scanner. Therefore, it can be concluded that the high density of points is unable to specify the correctness of the measurements; their accuracy regarding the surface projection is important. This is confirmed by the successive analysis performed during the examination of the tower’s verticality (Fig. 9)
Deviations in the tower’s diameter, obtained from
measurements using the Leica scanner were compared; they serve as the reference for other clouds of points (Tab. 1).
Tab. 1: Analysis of differences between interpolated parameters of ellipses from the Leica data and the remaining point clouds.
Z+F/
Leic
a dx[m] dy[m] dxy[m] dR[m]
Average deviation 0.018 0.170 0.205 0.035
Maximum deviation 0.256 0.295 0.304 0.387
Minimum deviation -0.226 -0.078 0.121 -0.73
Ca
n
o
n
/Leic
a
Average deviation 0.033 0.216 0.231 -0.025
Maximum deviation 0.125 0.355 0.358 0.28
Minimum deviation -0.02 -0.063 0.064 -0.306
Analysis of Table 1 shows that, when Z+F terrestrial close-range laser scanning data are utilized, the mean values for the location of the ellipse centre are smaller than when the point cloud generated from Canon photographs is processed. The significant differences, which stress the advantages of a point cloud generated from photographs, may be also seen when the minimum and maximum values and the radius values are analysed.
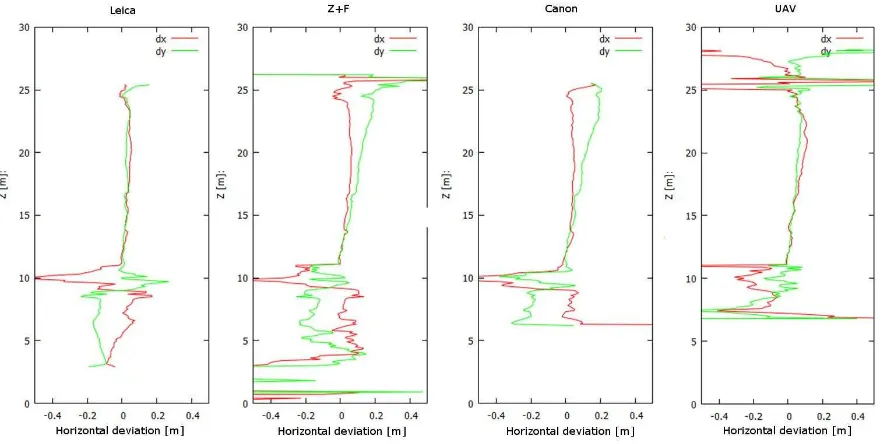
Figure 9: The diagram of the tower verticality based on data from different sensors
6. FINAL REMARKS
This paper has presented the results from testing the verticality of a monumental tower based on multi-source photogrammetric data. The quality and resolution of point clouds generated from different data sources were analysed. The following conclusions may be drawn based on the performed experiments:
The automation procedure of the verticality verification process of the elongated objects has been developed.
The high density of points is not required to determine
the tower’s centre and its diameter.
The proposed algorithm turned out to be effective in the case of partially missing data, as well as in the case of processing data with gross errors.
Errors relating to the projection of elongated objects are caused by the sensor quality and the assumed method of measurements with consideration to the height and distance from the object.
Coherence regarding the results was obtained for the long-range scanner (Leica C10) and the UAV. Systematic errors are visible when the close-range
scanner Z+F 5006h and blocks of terrestrial photographs are used.
The commonly applied SFM and MVS methods are not suitable for testing the verticality of slender objects, such as the monumental tower. As a result of utilizing terrestrial close-range scanners, in this case, Leica C10, it was possible to project the tested objects with a high degree of accuracy. Due to distribution of scanner stations located at long distances from the tested object ,large scanning angles may be eliminated. photographs were analysed. Similar results regarding the
determination of the ellipse centre and the radius values were obtained for a UAV data set. According to the performed testing, the resulting large volume of redundant data does not necessarily influence the correct restoration of the shapes of tested objects.
ACKNOWLEDMENTS
Research works financed within the programme of the Minister for Science and Higher Education called "The National Programme for Development of Humanities" in the period 2012-2015. The Stefan Wyszynski University in Warsaw.
REFERENCES
Achille, C., Adami, A., Chiarini, S., Cremonesi, S., Fassi, F., Fregonese, L., Taffurelli, L., 2015: UAV-Based Photogrammetry and Integrated Technologies for Architectural Applications
—Methodological Strategies for the After-Quake Survey of Vertical Structures in Mantua (Italy). Sensors, Vol. 2015(15), pp. 15520-15539.
Bernasik. J., Mikrut, S., 2007: Engineering Photogrametry. Report of AGH University of Science and Technology http://home.agh.edu.pl/~zfiit/mat_dydaktyczne_pliki/JB_SM_fo togrametria_inzynieryjna.pdf (20 Jan. 2017).
Erol, S., Erol, B., Ayan, T., 2004: A General Review of The Deformation Monitoring Techniques and a case Study: Analysing Deformations Using GPS/levelling. The International Archives of the Photogrammetry, Remote Sensing and Spatial Information Sciences, Vol., 35 (B7), pp. 622-627.
Gawałkiewicz, R., 2007: Example applications of laser scanning in inventory and monitoring of High Industrial facilities. Geomatics And Environmental Engineering, Vol. 1/4, pp. 89-92.
Maas, H.-G.; Hampel, U., 2006: Photogrammetric Techniques in Civil Engineering Material Testing and Structure Monitoring. Photogrammetric Engineering and Remote Sensing, Vol 72, No. 1, pp. 39-45.
Park, H.S., Shon, H.G., Kim, I.S., Park, J. H., 2004: Monitoring of Structural Behavior of High-rise Buildings using GPS. CTBUH 2004 Seoul Conferencee http://global.ctbuh.org/ resources/papers/download/1175-monitoring-of-structural-behavior-of-high-rise-buildings-using-gps.pdf (20 Jan. 2017).
Schneider, D., 2006: Terrestrial Laser Scanning For Area Based Deformation Analysis Of Towers And Water Damns. https://tu-dresden.de/bu/umwelt/geo/ipf/photogrammetrie/ressourcen/date ien/forschung/publikationen/pubdocs/2006/2006_Schneider_FI G_IAG_Baden2006.pdf?lang=en (20 Jan. 2017).
Wan Aziz, W. A., Shu, K.K., Bayrak, T., 2015: Tall Structures Deformation Monitoring Using Rtk-Gps (Case Study: Menara Sarawak Enterprise, Johore), http://eprints.utm.my/ 1374/1/PAPER114WanAzizShuKK.pdf (20 Jan. 2017).