Supported by National Natural Science Foundation of China (41271013), the Fundamental Research Funds for the Central Universities (N150104002), Liaoning BaiQianWan Talents Program(2015-15).
INDOOR MOBILE POSITIONING BASED ON LIDAR DATA AND CODED SEQUENCE
PATTERN
Zhi Wanga*, Bin Dong a, Dajun Chen a
a Northeastern University, NO. 3-11, Wenhua Road, Heping District, Shenyang 110819, P. R. China - [email protected]
Commission II, WG II/3
KEY WORDS: LiDAR, Coded Sequence Pattern, Mobile Positioning, SLAM algorithm, POSIT algorithm
ABSTRACT:
This paper proposed a coded sequence pattern for automatic matching of LiDAR point data, the methods including SIFT features, Otsu segmentation and Fast Hough transformation for the identification, positioning and interpret of the coded sequence patterns, the POSIT model for fast computing the translation and rotation parameters of LiDAR point data, so as to achieve fast matching of LiDAR point data and automatic 3D mapping of indoor shafts and tunnels.
* Corresponding author
1. INTRODUCTION
This paper proposed a coded sequence pattern for automatic matching of LiDAR point data, the methods including SIFT features, Otsu segmentation and Fast Hough transformation for the identification, positioning and interpret of the coded sequence patterns, the POSIT model for fast computing the translation and rotation parameters of LiDAR point data, so as to achieve fast matching of LiDAR point data and automatic 3D mapping of indoor shafts and tunnels.
2. LIDAR THREE-DIMENSIONAL SCANNING
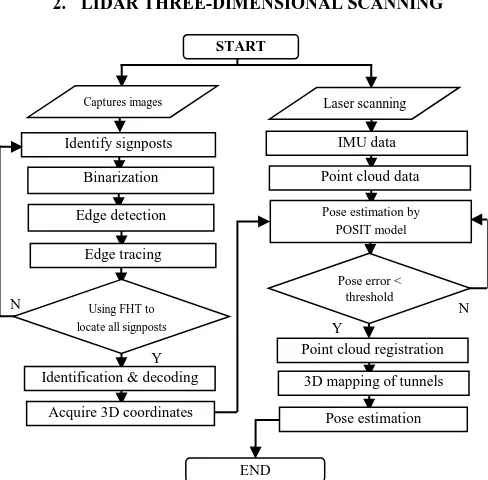
Figure 1 LiDAR & coded sequence pattern-based pose estimation
The proposed moving target localization algorithm in indoor tunnel environment established the coded sequence pattern
signposts along the tunnels, so as to calculate transform parameters of LiDAR point cloud using the center 3D coordinates of coded sequence pattern signposts which have been known during the install to achieve the rapid point cloud registration, real-time solution to calculate the position and orientation of moving objects. The flow chart of proposed algorithm was shown in Figure 1.
3. CODED SEQUENCE PATTERN
Figure 2 showed the proposed coded sequence pattern following the rules of Schneider[1-2], the coding structure was 3-layer concentric region, the center circle was divided into 4 parts (3/4 black, 1/4 white). Center circle area was not only used to automatically identify whether the region was a coded pattern and determine its location; but also showed the baseline where coding start by means of a black-white boundary. Proposed code sequence pattern has 212 types, remove the code which is not clear to identify, there were still 4017 types left to meet the needs of positioning of moving targets within the large-scale, long-range tunnel environment.
Figure 2 Sketch of proposed coded pattern
The coded sequence pattern has the following characteristics: 1) uniqueness: one coded pattern has only one corresponding code; 2) invariance to rotation and scaling; 3) easy to identify from complex background; 4) distinction between each other; 5) sufficient types.
N Using FHT to
locate all signposts
Y Captures images
Identify signposts
Binarization
Edge detection
Edge tracing
Identification & decoding
END Acquire 3D coordinates
Y Pose error <
threshold
N
START
IMU data
Point cloud data
Pose estimation by POSIT model
Point cloud registration
3D mapping of tunnels
Pose estimation
Laser scanning
(a) (b) (c) (d)
The International Archives of the Photogrammetry, Remote Sensing and Spatial Information Sciences, Volume XLII-2/W2, 2016 11th 3D Geoinfo Conference, 20–21 October 2016, Athens, Greece
This contribution has been peer-reviewed.
4. EXPERIMENT AND RESULT ANALYSIS
4.1 Experiment
Firstly, arrange the coded sequence pattern signposts alone the lab environment, and measure the world coordinates of the center of each signposts so as to establish the signpost database. Then calibrate the LiDAR and image sensors integrated experiment system (as shown in Figure 5). Experiment system moved along the lab environment, LiDAR was scanning in the range of 80m and camera acquired images including signposts in 25f/s. Onboard computer calculated the translation and rotation parameters in real time.
Figure 3 Experimental system with integrated LiDAR & cameras
In the experiment, the test LiDAR data and images were captured in the viewpoints approximately every 5m. 5 groups of LiDAR data and images were selected to fully test the robustness of proposed approach. Table 1 showed the overlaps between P1 and other viewpoints (P2 ~ P5), and overlaps between adjacent viewpoints.
Table 1 Overlaps between point cloud data Point
Cloud Overlap(%)
Point
Cloud Overlap(%)
1-2 83.1 2-3 82.6
1-3 77.7 3-4 81.3
1-4 68.8 4-5 80.3
1-5 63.0 / /
Table 2 showed the translation and rotation parameters from the time-consuming ICP algorithm which were taken as reference values. Table 3 showed the errors between the pose parameters from proposed algorithm and reference values.
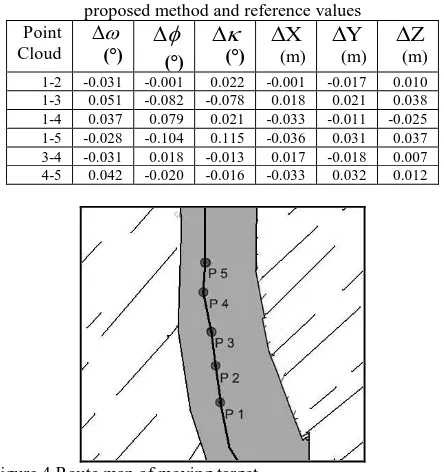
The accuracy of translation parameters calculated by proposed method was better than ± 4cm, and error of rotation parameter was smaller than 0.2°. It took less than 60ms to accomplish positioning (where identification and decoding the signposts <15ms, POSIT iteration compute < 15ms, point data registration and mobile positioning < 30ms). Figure 4 showed the route map by connecting the viewpoints computed by proposed algorithm.
Table 2 Pose reference of the moving target from Iterative ICP Point
Cloud
(°)
(°)
(°)X
(m)Y
(m)Z
(m)1-2 -1.088 -0.112 51.731 -5.50 0.96 0.02
1-3 0.551 0.419 57.447 -10.69 1.87 0.08
1-4 1.984 0.481 119.261 -16.77 2.53 0.14
1-5 -0.692 0.678 -118.535 -21.05 4.24 0.16
2-3 1.432 -0.958 5.733 -2.50 4.64 0.08
3-4 0.824 -1.174 61.834 -2.72 5.47 0.01
4-5 1.482 2.238 122.148 3.58 2.90 -0.08
Table 3 Compare of the pose parameters between proposed method and reference values Point
Cloud (°)
(°)
(°)X
(m)
Y
(m)
Z
(m)
1-2 -0.031 -0.001 0.022 -0.001 -0.017 0.010 1-3 0.051 -0.082 -0.078 0.018 0.021 0.038 1-4 0.037 0.079 0.021 -0.033 -0.011 -0.025 1-5 -0.028 -0.104 0.115 -0.036 0.031 0.037 3-4 -0.031 0.018 -0.013 0.017 -0.018 0.007 4-5 0.042 -0.020 -0.016 -0.033 0.032 0.012
Figure 4 Route map of moving target
4.2 Result Analysis
1) Proposed method took the coded sequence pattern signposts as key points, avoiding recognize the unknown features, showed excellent performance in maintainability and immunity to interference.
2) Proposed algorithm only needed 4 coded patterns to achieve point cloud data registration and positioning, and also had the advantages of small feature database, high speed and easy to implement real-time location.
3) Pproposed algorithm used POSIT model to calculate the pose parameters of point cloud data so as to achieve real-time positioning. In experiment, LiDAR data and coded sequence patterns based mobile positioning showed good stability, accuracy, computational speed.
ACKNOWLEDGEMENTS (OPTIONAL)
Supported by National Natural Science Foundation of China (41271013), the Fundamental Research Funds for the Central Universities (N150104002), Liaoning BaiQianWan Talents Program(2015-15).
REFERENCES
[1] David G. Lowe. Distinctive image features from scale-invariant keypoints[J]. International Journal on Computer Vision, 2004, 60(2):91-110.
[2] Wang Zhi, Wu Lixin, Li Huiying. Key technology of mine underground mobile positioning based on LiDAR and coded sequence pattern. Transactions of Nonferrous Metals Society of China, Trans. Nonferrous Met. Soc. China, 2011, (21): 570-576. The International Archives of the Photogrammetry, Remote Sensing and Spatial Information Sciences, Volume XLII-2/W2, 2016
11th 3D Geoinfo Conference, 20–21 October 2016, Athens, Greece
This contribution has been peer-reviewed.