ANALYSING POST-SEISMIC DEFORMATION OF IZMIT EARTHQUAKE WITH
INSAR, GNSS AND COULOMB STRESS MODELLING
R. Alac Barut *, J. Trinder, C. Rizos
School of Civil and Environmental Engineering, University of New South Wales, Sydney, NSW, 2052, Australia - (r.alacbarut, j.trinder, c.rizos)@unsw.edu.au
Commission I, WG I/5
KEY WORDS: InSAR, GNSS, Coulomb stress changes, North Anatolian Fault (NAF), Izmit earthquake, deformation, co-seismic
ABSTRACT:
On August 17th 1999, a M
w 7.4 earthquake struck the city of Izmit in the north-west of Turkey. This event was one of the most devastating earthquakes of the twentieth century. The epicentre of the Izmit earthquake was on the North Anatolian Fault (NAF) which is one of the most active right-lateral strike-slip faults on earth. However, this earthquake offers an opportunity to study how strain is accommodated in an inter-segment region of a large strike slip fault. In order to determine the Izmit earthquake post-seismic effects, the authors modelled Coulomb stress changes of the aftershocks, as well as using the deformation measurement techniques of Interferometric Synthetic Aperture Radar (InSAR) and Global Navigation Satellite System (GNSS). The authors have shown that InSAR and GNSS observations over a time period of three months after the earthquake combined with Coulomb Stress Change Modelling can explain the fault zone expansion, as well as the deformation of the northern region of the NAF. It was also found that there is a strong agreement between the InSAR and GNSS results for the post-seismic phases of investigation, with differences less than 2mm, and the standard deviation of the differences is less than 1mm.
1. INTRODUCTION
On 17 August 1999, at 03:01:37 local time, an earthquake jolted north-west Turkey (Izmit Province) for about 37 seconds. In its first assessment, the United States Geological Survey (1999) Kandilli Observatory and the Earthquake Research Institute (1999) announced the quake moment magnitude to be 7.4 with its epicentre 11km south-east of the city of Izmit. This earthquake caused significant damage to Izmit and several surrounding cities, towns and villages. In 2011, the Disaster and Emergency Management Presidency of Turkey (AFAD) reported that 17,479 people had been killed, 43,953 injured, and many thousands of buildings either destroyed or damaged. In addition to this, the World Bank (2003) reported that the Izmit earthquake caused approximately US$3 to $6.5 billion in loss of property, corresponding to 1.5 to 3.3% of the Gross National Product of Turkey (MARsite, 2015).
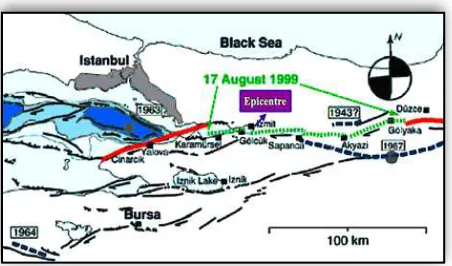
According to Sengor et al. (2004) the North Anatolian Fault (NAF) was formed when several fault segments started widening on the western side approximately 13 to 11 million years ago. Over the last 100 years, large earthquakes have occurred in a westerly direction from the plate boundary to the Marmara Sea area, causing significant alarm for the population in this area (Reilinger et al., 2000). Because of its importance for the tectonics of the eastern Mediterranean region, the Izmit earthquake has attracted the interest of several scientists that have applied geodetic methods (e.g. Reilinger, 2000; Feigl et al., 2002; Aydoner, et al., 2004; Bos et al., 2004; Hamiel and Fialko 2007). During the last few decades, space geodesy has shown benefitted from c o n s i d e r a b l e t e c h n o l o g i c a l d e v e l o p m e n t s , w i t h Interferometric Synthetic Aperture Radar (InSAR) and continuous Global Navigation Satellite System (GNSS) becoming increasingly used to monitor surface deformation due to earthquakes. Armadottir et al. (2003) states that the integration of InSAR, GNSS and Coulomb Stress Change Modelling is a very promising approach for analysing geological phenomena such as earthquake deformation. Figure 1 shows the NAF line and Izmit earthquake rupture.
!
Figure 1: North-western section of the NAF, near Istanbul. The dotted green lines indicate the extent of the 1999 rupture and black lines indicate the fault lines. Red lines reveal the stressed segment after the 1999 earthquake (modified from Barka, 1999).
2. METHODOLOGY
2.1 InSAR
InSAR is a remote sensing technique that measures ground displacements using the difference in phases between two synthetic aperture radar (SAR) images acquired over the same area. The surface displacement, measured in the satellite’s line-of-sight, has large spatial extent and has a typical an accuracy of a few centimetres, even a few millimetres. The coherence between the two received images determines the level of “correlation”, which is dependent primarily on the base length – or distance between the two satellite positions at SAR acquisition. The computed phase differences can be visualised as spatial “fringes”. Each fringe represents a phase difference which allows the determination of the relative surface displacement. Interpreted in units of distance each fringe represents half the radar signal wavelength (e.g. 28mm for C-band ERS SAR systems).
2.2 GNSS
GNSS is a space-based technology which can provide centimetre-level accuracy positioning using multiple signals received from a constellation of satellites. GNSS provides position, velocity and time (PVT) information almost anywhere, anytime, in any weather condition, for discrete points at which a GNSS receiver is installed. In the standard single point positioning mode a minimum of four simultaneously tracked GNSS satellites are needed so that 3-D position of the GNSS receiver’s antenna and the time correction to the receiver’s clock can be determined. However, for precise positioning differential mode of positioning is employed, relying on the measurement of carrier phase on the transmitted signals. These days GNSS techniques play a significant role in determining deformations, due to any number of causes including those of seismic origin.
2.3 Coulomb Stress Change Modelling
Coulomb Stress Change Modelling is a tool for aftershock assessment, which allows the geometry and mechanism of the fault to be determined. It provides a physical basis for calculating the stress transmitted between faults, and permits the analysis of the complex temporal evolution of the system using theoretical models. The movements on a particular fault can generate Coulomb stress changes which do affect nearby structures. The stress changes are calculated using focal mechanism data derived from measurements of the earthquake. The focal mechanism data consists of strike, dip, rake, slip, moment magnitude and depth of source.
3. DATA AND RESULTS
3.1 InSAR
For local and regional assessment of post-seismic deformation, SAR images acquired by the ERS-1 and ERS-2 satellites were processed to generate three unwrapped interferograms. The InSAR data were acquired on 10th and 11th September 1999, 26th and 27th September 1999, and 21th and 22th October 1999, as listed in Table 1. Figures 2, 3 and 4 are the interferograms derived from these image pairs. All
SAR images were processed using the ROI_PAC 3.0.1 software from JPL with orbits provided by ESA.
Table 1: Information on SAR satellite images used in this study.
!
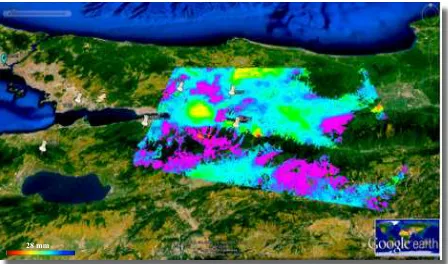
Figure 2: Mosaic unwrapped phases derived from ERS-1 and ERS-2 data displayed over a Google Earth image, from data derived from descending orbits on 10th and 11th September. The colour code indicates the phase differences caused by surface changes. BEST, DUMT HAMT, MURT, TUBI and UCGT stations have been marked on the map.
Figure 3: Unwrapped phases derived from ERS-1 and ERS-2 data displayed over a Google Earth image from data derived from descending orbits on 26th and 27th September. The colour code indicates the surface changes. BEST, DUMT HAMT, MURT, TUBI and UCGT stations have been marked on the map.
No Satellite Date Orbit Orbit Track
1 ERS-1 10-09-1999 42637 Descending
2 ERS-2 11-09-1999 22964 Descending
3 ERS-1 26-09-1999 42866 Descending
4 ERS-2 27-09-1999 23193 Descending
5 ERS-2 21-10-1999 43231 Ascending
6 ERS-1 22-10-1999 23558 Ascending
28 mm
Figure 4: Unwrapped phases derived from ERS-1 and ERS-2 data displayed over a Google Earth image from, data were derived from descending orbits on 21th and 22th October. The colour code indicates the phase differences depending on surface changes. Locations of BEST, DUMT HAMT, MURT, TUBI and UCGT stations have been marked on the map.
The unwrapped interferograms have revealed the surface deformations that occurred over the period, as indicated by the colour codes. In Figure 2 the highest deformation is estimated to be 61mm (e.g. estimated accuracy of InSAR deformation measurements 10-20mm, Ferretti et al., 2001; and Lu et al., 2007) in the south of the interferogram. In addition this interferogram indicates relatively high deformations around the epicentre of the Izmit earthquake, which is also close to the time of the 13th September 1999 aftershock. Figures 3 and 4 show lower deformation values than Figure 2. Figure 3 also reveals a highly deformed area in the south-west of the interferogram which is close to the epicentre of the 29th September 1999 aftershock. Although the interferogram from Figure 4 does not cover the epicentre of 20th October 1999 aftershock (which occurred in Istanbul) it still shows high deformation in the north-west area of the interferogram. There are also some blank areas where phase coherence is lost and deformation data cannot be mapped into the interferogram. Note that the areas which have a high level of deformation, or dense vegetation or contain water areas cause low coherence during SAR image processing.
3.2 GNSS
Data from six continuously operating GPS stations of the MAGNET network (designated BEST, DUMT, HAMT, MURT, TUBI, UCGT) were available for investigation of post-seismic deformations. Two continuous GPS stations, DUMT and TUBI were operating before the Izmit earthquake. Four additional CGPS stations were installed two days following the earthquake in order to track post-seismic deformations. The GPS observation datasets were provided by the Scientific and Technological Research Council of Turkey (TUBITAK). Table2 shows the daily solutions of the six CGPS stations at the time of the 13th September 1999 (M
w 5.8), 29th September 1999 (M
w 5.2), and 20th October 1999 (Mw 5.1) aftershocks. Moreover, the GPS data were selected so as to correspond to the SAR image acquisition dates (10th and 11th September 1999, 26th and 27th September 1999, and 21st and 22nd October 1999) to allow direct comparison with InSAR results. Table 3 gives the comparison between Line-of-Sight (LOS) deformation from InSAR and GPS results at the CGPS stations. All GPS data were processed using the AUSPOS web (http://www.ga.gov.au/scientific-topics/ positioning-navigation/geodesy/auspos) a free online GPS data processing service provided by Geoscience Australia.
!
Table 2: CGPS station displacements during the 13th and 29th September and 20th October 1999 aftershocks.
The GPS observation results suggest that the stations moved relative to each other. From the AUSPOS processing the displacement of BEST was estimated as being 4.6mm in a northerly direction, 5mm in an easterly direction (at CGPS stations, estimated accuracy is 3 to 5mm for the horizontal components and 10 to 20mm for the vertical components, Feigl et al., 2002). These are the highest north-east displacement from the stations, whereas the DUMT deformation results are the lowest north-east displacement on 13th September 1999. TUBI station’s movements in the easterly direction and in height are the highest amongst these six CGPS stations. According to this station’s movement, the 13th September 1999 aftershock caused the northern part of the Marmara region to move eastwards while the southern part of the NAF moved west, indicating that this earthquake caused right lateral movement. The other two aftershocks caused only small displacements in the east and north directions.
!
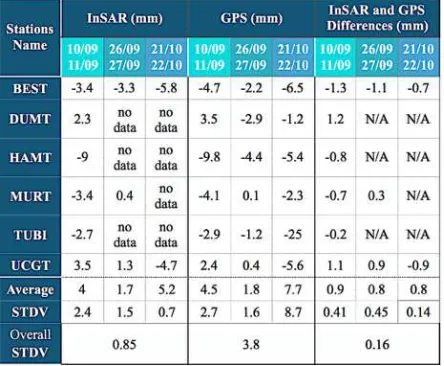
Table 3: Comparison between LOS from InSAR and GNSS results at CGPS stations.
InSAR and GPS differences is the lowest (Table 3). Furthermore, the InSAR accuracy is at the mm level for post-seismic deformation, since the overall standard deviation of the three interferograms is less than 1mm. The DUMT, HAMT and TUBI stations are not within the interferogram for Figures 3 and 4. HAMT and MURT are located in the no-data areas in Figure 4. Thus there are difficulties in directly comparing the GPS and InSAR results for all stations.
3.3 Coulomb Stress Change Modelling
In addition to calculating the stress changes caused by the Izmit aftershocks on 13th September 1999, 29th September 1999 and 20th October 1999, the seismic focal mechanism data from the International Seismological Centre (ISC) were used in order to characterise these aftershocks. In this model the best rupture parameters (strike, dip, rake and depth values of the faulting) were selected and the Coulomb 3.3 software was used to generate the Coulomb stress changes at depth caused by seismic activity. The calculated stress changes of the 1999 Izmit aftershocks are shown in Figure 5 for 13th September 1999, in Figure 6 for 29th September 1999, and in Figure 7 for 20th October 1999.
!
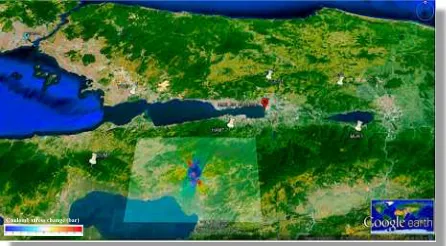
Figure 5: Map of Coulomb stress changes layer displayed on a Google Earth image for 13 September 1999. Model parameters: Mw =5.8, Strike = 272°, Dip = 40°, Rake = 175°, Depth =13 km, Time = 11:55 (UCT) and friction coefficient = 0.4. Epicentre of the 17 August Izmit earthquake and locations of BEST, DUMT HAMT, MURT, TUBI and UCGT stations have been marked on the map. Colour code indicates the Coulomb stress changes; dark blue and red are high stress values.
Figure 6: Map of Coulomb stress changes layer displayed on a Google Earth image for 29 September 1999. Model parameters: Mw =5.2, Strike = 331°, Dip = 84°, Rake = -43°, Depth = 15km, Time = 00:13 (UCT) and friction coefficient = 0.4. Epicentre of the 17 August Izmit earthquake and locations of the BEST, DUMT HAMT, MURT, TUBI and UCGT CGPS stations have been marked on the map. Colour code indicates the Coulomb stress changes; dark blue and red are high stress values.
!
Figure 7: Map of Coulomb stress changes layer displayed on a Google Earth image for 20 October 1999. Model parameters: Mw =5.1, Strike = 288°, Dip = 85°, Rake = 146°, Depth = 10km, Time = 00:13 (UCT) and friction coefficient = 0.4. City of Istanbul has been marked on the map. Colour code indicates the Coulomb stress changes; dark blue and red are high stress values.
Figure 5 reflects the Coulomb stress changes due to the 13th September 1999 aftershock (Mw 5.8). This aftershock caused great stresses around the fault zone and epicentre, which is close to the Izmit epicentre. In addition to this the model shows that the area around the CGPS stations were not subject to the stresses, which is supported by the low deformation values in the GNSS and InSAR results. Moreover, as seen in Figure 6, the calculated Coulomb stress for the 29th September 1999 aftershock has occurred about 30km south-west of the Izmit earthquake. This aftershock had a lower impact than the 13th September 1999 aftershock, which could also explain the smaller displacement GNSS results. The Coulomb stress of the 20th October 1999 aftershock (Figure 7), which occurred approximately 90km northwest of the Izmit earthquake in Istanbul, caused high stresses around the northern Bosphorus. In addition, even though its epicentre is further away and has a lower magnitude than the other two aftershocks, it still has a similar small impact on InSAR and GNSS results due to it occurring at a lower depth.
4. CONCLUSION
Post-seismic assessment of the 1999 Izmit earthquake has shown that the use of three techniques (InSAR, GNSS and Coulomb Stress Change Modelling) provides complementary information for the distribution of post-seismic deformations. The InSAR results in Figure 2 show the highest deformation values within the three interferograms, approximately 61mm, which include inter-seismic deformation before the largest aftershock (13th September 1999, M
w 5.8). As can be seen from Table 3 there is a strong consistency between InSAR and GNSS deformation results, although not all station point values were calculated from the interferograms in Figures 3 and 4. Furthermore, in the case of the 21st and 22nd October 1999 period the standard deviation of the differences between displacements derived by the InSAR and GNSS techniques is 0.14mm, which is the highest consistency between InSAR and GNSS results in this study. The GNSS results indicate that the 13th September 1999 aftershock caused the northern part of the NAF to move in an easterly direction and the southern part to move in a westerly direction. This interpretation could support a westward extension of the NAF fault underneath the Gulf of Izmit. Therefore it advances the use of Coulomb Stress Change Modelling as a tool for determining the spatial distribution of the aftershock and could aid in hazard mitigation. Likewise, as interpreted from the stress change maps in Figures 5, 6 and 7, there is a
Coulomb stress change (bar)
Coulomb stress change (bar)
strong correspondence between the stress perturbations caused by the aftershocks, as indicated by the InSAR and GNSS results. Consequently these results show that a combined analysis of SAR interferometry with GNSS measurements, and Coulomb Stress Change Modelling can improve our understanding of the post-seismic behaviour of earthquakes.
ACKNOWLEDGEMENTS
The SAR data have been provided by ESA as part of the C1F. 29006 project and the GNSS data have been provided by TUBITAK.
REFERENCES
AFAD (2011). Izmit Depremi (17 Agustos 1999) Raporu. Ankara, Turkiye, T.C.Basbakanlık Afet ve Acil Durum Yonetimi Deprem Dairesi Baskanlıgı, Ankara: 100.
Arnadóttir, T., S. Jónsson, R. Pedersen and G. B. Gudmundsson (2003). "Coulomb stress changes in the South Iceland Seismic Zone due to two large earthquakes in June 2000." Geophysical research letters 30(5).
Aydöner, C., D. Maktav and E. Alparslana (2004). Ground Deformation Mapping Using InSAR. XXth ISPRS (International Society for photogrammetry and Remote Sensing) Congress, Citeseer.
Bos, A., S. Usai and W. Spakman (2004). "A joint analysis of GPS motions and InSAR to infer the coseismic surface deformation of the Izmit, Turkey earthquake." Geophysical Journal International 158(3): 849-863.
Barka, A. (1999). "The 17 August 1999 Izmit earthquake." Science, 285(5435), 1858-1859, doi: 10.1126/science.
Feigl, K. L., F. Sarti, H. Vadon, S. McClusky, S. Ergintav, P. Durand, R. Bürgmann, A. Rigo, D. Massonnet and R. Reilinger (2002). "Estimating slip distribution for the Izmit mainshock from coseismic GPS, ERS-1, RADARSAT, and SPOT measurements." Bulletin of the Seismological Society of America 92(1): 138-160.
Ferretti, A., C. Prati and F. Rocca (2001). "Permanent scatterers in SAR interferometry." Geoscience and Remote Sensing, IEEE Transactions on 39(1): 8-20.
Hamiel, Y. and Y. Fialko (2007). "Structure and mechanical properties of faults in the North Anatolian Fault system from InSAR observations of coseismic deformation due to the 1999 Izmit (Turkey) earthquake." Journal of Geophysical Research: Solid Earth 112(B7).
KOERI. (2000). "Izmit Earthquake." Retrieved 21September, 2 0 1 5 , f r o m h t t p : / / w w w. k o e r i . b o u n . e d u . t r / s i s m o / indexeng.htm.
Lu, Z., Kwoun, O., Rykhus, R., (2007). "Interferometric Synthetic Aperture Radar (InSAR): Its Past, Present and Future", Photogrammetric Engineering And Remote Sensing, March 2007, 217-221.
Marsite. (2015). Earthquake-Induced Landslide Hazard in Marmara, Retrieved 28 May, 2015, from http://marsite.eu/? p=621.
Ozmen, B. (2000). Damage due to August 17, 1999 Izmit Bay Earthquake, Technical Report, Turkish Earthquake Foundation, TDV/DR 010–53.
Reilinger, R., S. Ergintav, R. Bürgmann, S. McClusky, O. Lenk, A. Barka, O. Gurkan, L. Hearn, K. Feigl and R. Cakmak (2000). "Coseismic and postseismic fault slip for the 17 August 1999, M= 7.5, Izmit, Turkey earthquake." Science
289(5484): 1519-1524.
Sengör, A., O. Tüysüz, C. Imren, M. Sakinç, H. Eyidogan, N. Görür, X. Le Pichon and C. Rangin (2005). "The North Anatolian fault: A new look." Annu. Rev. Earth Planet. Sci.
33: 37-112.
United States Geological Survey. (1999). Historic Earthquakes, Retrieved 28 May, 2015, from http:// earthquake.usgs.gov/earthquakes/eqarchives/year/1999/19 99_08_17.php.
World Bank. (2003). Turkey -Marmara earthquake assessment. Washington, DC:World Bank.