BUILDING FACADE DOCUMENTATION USING LASER SCANNING AND
PHOTOGRAMMETRY AND DATA IMPLEMENTATION INTO BIM
M. Faltýnová*, E. Matoušková, J. Šedina, K. Pavelka
Department of Mapping and Cartography, Faculty of Civil Engineering, Czech Technical University in Prague, Czech Republic (martina.faltynova, eva.matouskova, jaroslav.sedina, pavelka)@fsv.cvut.cz
Commission III, WG III/2
KEY WORDS: close range photogrammetry, point cloud, 3D modelling, building renovation, prefabricated modular elements
ABSTRACT:
A project started last year called MORE-CONNECT, which focuses on the renovation of buildings (especially building facades) using prefabricated elements. The aim of this project is to create a competitive solution consisting of a technology and processes which enable fast, cost-effective renovation with minimal difficulties to inhabitants. Significant cost savings in renovation costs lies in the usage of prefabricated elements and the reduction of construction works on site. The precision of the prefabricated element depends on the precision of the construction, project and building documentation. This article offers an overview of the possible methods for building documentation and spatial data transfer into BIM (Building Information Modelling) software. The description of methods focuses on laser scanning and photogrammetry (including RPAS based), its advantages, disadvantages and limitations according to the documented building, level of renovation, situation on site etc. The next part involves spatial data transfer into BIM software. A proposed solution is tested in a case study.
1. INTRODUCTION
The aim of this paper is to bring an overview of geomatics techniques that can be used for building reconstruction and to show advantages of its integration into different project phases. The main goal of the geomatic part of the MORE-CONNECT project is to provide information to civil engineering companies in order to be knowledgeable in the field of geomatics. A better understanding of geomatics techniques and methodology will lead to more exact specifications of project requirements for surveyors and also for the time and cost optimization of the geomatics works (surveying, data processing and information transfer into desired software in appropriate format).
2. SURVEYING TECHNIQUES FOR BUILDING DOCUMENTATION
Surveying techniques performed in the MORE-CONNECT project consist mainly of laser scanning and photogrammetry. These methods have replaced traditional surveying techniques in many applications. Traditional recording methods based on hand recording, e.g. by means of tape measurement, are too subjective, time consuming and applicable only to small areas. In contrast to the terrestrial surveying and analytical photogrammetry, which requires a manual interpretation in order to derive a representation of the sensed objects, these new automatic recording methods allow an automated dense sampling of the object surface within a short time (Pfeifer; Briese, 2007). It is enabled due to the speed of acquiring high density data and highly automated processing. These methods are used to obtain a 3D model of the building of interest. Basic principles and characteristics of the methods are described further.
2.1 Laser scanning
Laser scanners (active sensors) operate by an emitting laser beam to a known direction and then waiting for the reflection to measure distances from the sensor to the object. By measuring
* Corresponding author.
the direction the laser was emitted and the distance to the object was determined, the scanner can determine the 3D location of the surface that the laser has reflected off. By emitting the light in a regular pattern (more than 200,000 points/s) the method allows a dense sampling of the object surface. Detail level of the resulting 3D model depends on the setting of the scan resolution and the distance to the object.
Different principles can be used to measure the distance between the sensor system and the target. They differ in precision but all have their justification for a certain range envelope. For the building documentation, two of the mentioned principles can be applied: the pulse systems and the phase-shift systems. The largest ranges (>100m) can be probed using the pulse round trip time measurement principle and obtaining a centimetre accuracy. Shorter distances, e.g. up to 100m, can be measured faster and more accurate with the phased based measurement technique.
The primary product of the laser scanning is a point cloud – a set of data points in a user defined coordinate system that represents an external surface of the measured object. Software for pre-processing and point cloud export is usually supplied together with the scanning system. The processing of point clouds is described in section 3. More details about laser scanning and its application can offer (Pfeifer; Briese, 2007), (Vosselman; Maas, 2010).
2.2 Digital photogrammetry
Passive sensors, like digital cameras, deliver 2D image data, which can be afterwards transformed into 3D information. The photogrammetric method generally employs minimum of two images covering the same static scene or object acquired from different points of view. Similar to human vision - if the object can be seen in at least two images the different relative position of the object in the images allows a stereoscopic view and the derivation of 3D information of the scene seen in the overlapping The International Archives of the Photogrammetry, Remote Sensing and Spatial Information Sciences, Volume XLI-B3, 2016
area of the images. Using automatic location of common points in both images (also typically thousands per second, depending on the PC speed) the digital photogrammetric system is also able to build up a digital model of the scene.
One of the most important parameters which influences the detail of the resulting 3D model is Ground Sample Distance (GSD). The GSD is the smallest element in the object space that can be distinguished by the camera sensor. The bigger the value of the GSD in an image, the lower the spatial resolution of the image/model and therefore less visible details. The GSD can be expressed as:
= ( ) ! " # (1)
The equation clarifies that the GSD depends on camera parameters as well as on the distance between the object and the camera.
The main advantage of the photogrammetry stays in the fact that the images contain all the information required for 3D reconstruction of the scene as well as the photo-realistic documentation. An important point is also the equipment cost - cameras are generally cheap and easily portable. More details about photogrammetric principles, techniques and application can offer (Luhman et al., 2011), (Remondino; Campana, 2014).
2.2.1 Image sensors: Images can be acquired using terrestrial, aerial or satellite sensors according to the application and desired scale (level of detail). For the building documentation purposes the terrestrial sensors are useful. In some cases, sensors held by UAV (Unmanned Aerial Vehicle) are convenient. Terrestrial cameras are available in many different types and formats: single CCD/CMOS sensor, frame, linear, multiple heads, industrial, consumer, panoramic head, etc. Non-professional terrestrial cameras have at least 10-15 Megapixels for a very low cost, while high-end digital cameras feature even more than 40 Megapixels sensors. The camera choice depends on individual and project needs. In some cases even low cost ordinary terrestrial camera can be sufficient for 3D purposes. However, low cost camera with small image sensor usually has low signal to noise ratio, which leads to images of lower quality. Various camera types’ output differences are shown in a case study (section 6).
2.2.2 Unmanned Aerial Vehicles: Images can be taken just from hand, from tripod or using UAV (Unmanned Aerial Vehicle). The third option can be very useful, especially when documenting tall buildings and roofs, where the use of UAV can be the only possibility of photogrammetric documentation except the use of a crane. Unmanned Aerial Vehicle (UAV) is defined as a generic aircraft design to operate with no human pilot on board, which can be remotely piloted, fully autonomous or combinations thereof. (ICAO, 2015). UAS refers to the Unmanned Aerial System, which comprehends the whole system composed by the aerial vehicle/platform, held sensors and the Ground Control Station (GCS). Except UAV, there are other terms which are commonly used e.g. Drone, RPAS (Remotely Piloted Aircraft System).
There are two main types of UAV construction – fixed wing and rotary. Unlike the fixed wing models, the rotary systems (e.g. multi-copters) are able to fly in every direction, horizontally and vertically, as well as hover in a fixed position. This makes them the perfect instrument for detailed inspection work or surveying hard-to-reach areas including building documentation.
UAV’s have currently different safety levels according to their dimension, weight and on board technology. For this reason, the
rules applicable to each UAV could not be the same for all the platforms and categories. In the EU, the current regulatory system for drones is based on the fragmented rules. Many EU member states have already regulated or are planning to regulate some aspects of civil drones with an operating mass of 150 kg or less. However, the extent, content and detail level of national regulations differ conditions for mutual recognition of operational authorisations, between the EU member states have not been reached. (Civil drones in the European Union, 2015 - http://www.europarl.europa.eu/RegData/etudes/BRIE/2015/571 305/EPRS_BRI(2015)571305_EN.pdf).
2.2.3 From images to point clouds: The entire
photogrammetric workflow is used to derive metric and accurate 3D information of the scene from a set of images. The procedure consists of a camera calibration, an image orientation and a point cloud generation, which can be followed by 3D measurements, structuring and modelling, texture mapping and visualization. Compared to the active range sensors workflow, the main difference stays in the 3D point cloud derivation. Unlike photogrammetry range sensors (e.g. laser scanners) deliver directly the 3D data (Remondino; Campana, 2014).
A camera calibration and an image orientation are procedures of fundamental importance for extracting accurate 3D geometric information from images. The camera calibration procedure determines the interior parameters (camera focal length, image principal point, lens distortion) while the exterior parameters (positions and angular orientations associated with an images) are determined within the image orientation procedure. These two procedures can be done separately or fused using the same set of images and procedure.
To provide the transformation between images and object space frame, the additional measurements are needed to add the scale, position and orientation of the model in the required coordinate system. The transformation is usually ensured by using some Ground Control Points (GCP), whose coordinates are known in the image as well as in the object frame. Another way is to leave the model in a free-network mode and to retrieve the correct scale using a known distance on the object. The position of GCP can be surveyed by a GNSS receiver or the total station and distance measurement can be performed using electronic distance meter or a survey tape.
Once the camera parameters are known, the dense cloud can be derived automatically using image matching techniques.
3. POINT CLOUD PROCESSING
A point cloud, as previously described, is a set of points in a three-dimensional coordinate system and represents the external surface of an object. The point cloud itself has a great predictive value and can carry highly detailed spatial information about a surveyed object. This unorganized structure is not very suitable for further analysis since spatial inquiries have high computational demands in this framework. For designing and further work a model composed of simple structures is needed. These models are called “polygonal” or “prismatic” models and one has to take into account their high generalization level (the level of detail can decrease rapidly).
Model (polygonal or prismatic) creations can be performed by a geomatics specialist in software determined for point cloud processing. A particular agreement between the ordering party and the contractor has to be made in order to maintain desired level of detail and demanded data format.
When dealing with BIM, there is one more option - the point cloud can be directly loaded into BIM software. BIM software solutions support the majority of basic point cloud data formats and point clouds can be inserted right in the import menu. A 3D model in the desired format can then be created straightforwardly using BIM software instruments. This step solves the data transfer problem and level of detail can be chosen directly according the BIM designer needs. In case of any additional demands on level of detail, the original point cloud is still easily accessible for the designer. If the project is realized in different countries and the survey is done by various companies this seems like a fine solution.
4. GEOMATICS INTEGRATION
4.1 Specification of object documentation
When using advanced geomatics for the object documentation the contract owner needs to specify his demands clearly. This information is crucial for the supplier as without these definitions a misunderstanding can occur. Requirements depend on the building type, its location and lead to cost and time optimization.
Basic information for surveyor:
• Object specifications
• Demanded documentation level – interior
(hall, corridors, apartments, basement, attics), exterior (facade, roof), surroundings (trees, pathways, neighbourhood buildings, etc. - e.g. for crane accessibility)
• Building size (width, length, height - e.g.
building height can limit using of terrestrial photogrammetry)
• Object address – for travel expenses • Demanded level of detail – resolution and model
generalization (size of the smallest detail that should be visible in the 3D model – e.g. window ledges and flames)
• Model accuracy – Final model should be delivered with
accuracy assessment (Photogrammetry and laser scanning methods can provide models with millimetres accuracy)
• Coordinate system - Global or local (e.g. for easy
implementation into BIM)
• Demanded outputs – point cloud, polygonal or
prismatic model, data formats
4.2 Integration into project phases
Geomatics can be useful in all project phases – from base project data acquisition to final building handover to the ordering party, see Tab. 1.
Project phase Activity Method Before
realization Design fundamentals acquisitions
realization Quality assessment Laser scanning/ Photogrammetry Table 1. Geomatics integration into various project phases
Description of ideal project workflow:
• Consultation with the ordering party – requirement
setup
• Terrain reconnaissance
• Method and equipment selection
• In-situ measurements – preparation, actual survey,
additional survey (e.g. tape measurements)
• Data transfer (from used device into desired software) • Software works – image orientation, point cloud
generation (in case of photogrammetry), point cloud adjustment, modelling (if required)
• Accuracy verification
• Outcome submission to the ordering party
4.3 Technique selection
Recent testing of the photogrammetric and the laser scanning methods shows that these methods are comparable in many considerations (accuracy, time demands, demanded outputs) and can be applied for a building documentation. Advantages and disadvantages are summarized in Tab. 2. Tab. 3 provides information and recommendations about method selection, but one must take into account the uniqueness of each project - its requirements and specifications. Both methods have been applied and tested on the project case study in the Czech Republic in order to determine advantages and disadvantages of each of them. Detailed comparison can be found in section 6.
Method Photogrammetry Laser scanning Equipment reflex camera
from 2,000eur
laser scanner from 40,000eur Site limitations textured object
and fine
Time costs faster acquisition, slower point cloud
characteristics Non-selective, non-contact methods, point cloud creation Data processing more time consuming than data acquisition
Specialized software needed (from 10,000EUR each)
Table 2. General comparison of photogrammetry and laser scanning methods
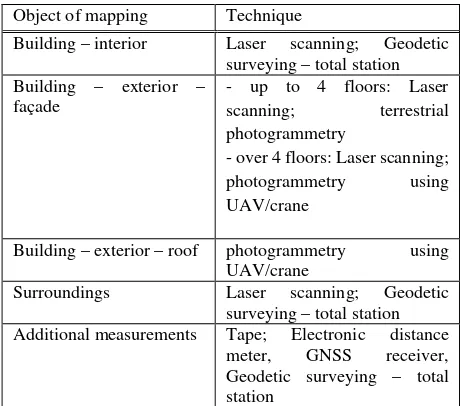
Object of mapping Technique
Building – interior Laser scanning; Geodetic surveying – total station Building – exterior –
façade - up to 4 floors: Laser scanning; terrestrial photogrammetry
- over 4 floors: Laser scanning; photogrammetry using UAV/crane
Building – exterior – roof photogrammetry using UAV/crane
Surroundings Laser scanning; Geodetic surveying – total station Additional measurements Tape; Electronic distance
meter, GNSS receiver, Geodetic surveying – total station
Table 3. Technique selection
5. CASE STUDY
The MORE-CONNECT project focuses on modular façade renovation of buildings common in the project partner’s country regarding to local conditions (typical housing for renovation, demands on renovation – weather conditions, materials etc.). As a case study in the Czech Republic a three floor residential house of a type known as “dvouletka” was chosen. This selection has been made in order to provide easy accessibility. East façade has been documented by photogrammetric and laser scanning methods. Procedure of data acquisition, data processing and outcome comparison is explained hereinafter.
A personal computer (PC) with following setup has been used for calculations:
• Processor: Intel® Core™ i7-3770 CPU @ 3,40GHz
• RAM 16GB
• 64bit system Windows 7 Enterprise
5.1 Building identification
Residential House “dvouletka” type in Kladno. The city of Kladno is located northwest of Prague, the capital of the Czech Republic. Distance from the capital city centre is approximately 30km.
5.1.1 Present state: The building has simple, rectangular
floor plan. It has three floors with similarly designed flats. The house has a hip roof with a number of chimneys.
5.1.2 Typical problems: Old-fashioned appearance,
devastated common areas, unsatisfied overall energy performance, insufficient ventilation, mould growth in the basement floor, water-proofing failures, ruptures in plaster, badly insulating original wooden windows with loose closing mechanism, condensation and mould growth in the flats with replaced wooden windows for the new “euro” standards. Failures and water leakage in the area of chimney-roof run through.
5.1.3 Appearance:
Figure 1. Documented building – east view
5.2 Laser scanning
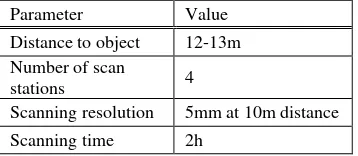
The data has been acquired by a phase shift laser scanner Surphaser 25HSX. Scanning parameters are shown in Tab. 4.
Parameter Value
Distance to object 12-13m Number of scan
stations 4
Scanning resolution 5mm at 10m distance Scanning time 2h
Table 4. Surphaser 25HSX scanning parameters
5.2.1 Data Processing: Point clouds were exported into *.xyz
data format and processed using Geomagic Studio software. The point clouds were cleaned manually. The next step was a manual registration – the approximate transformation of point clouds into one common coordinate system using manually selected identical points. This was followed by a global registration – an automatic precise transformation applying ICP (iterative closest point) algorithm. After joining point clouds into one, the resulting point cloud was oriented – the documented façade follow the main axis of the local coordinate system.
5.2.2 Results: The resulting point cloud has over 6.1 million
points and the distance among the points on the surface (GSD – ground sample distance) does not exceed 1.5 cm. The expected GSD according scanner settings was 6mm. The difference between expected and achieved GSD can be caused by lower surface reflectance since not all reflected arrays returned to the scanner. Higher point density (lower GSD) can be achieved by using higher scanning resolution or by lowering the distance between the scanner and the object. However it is recommended to keep the object – scanner distance not shorter than half of the building height. It is because the closer the scanner to the object, the lower the incidence angle at higher parts of the building. That leads to an accuracy decrease and also to a GSD increase in higher building sections.
A side measure has been used for model accuracy verification. The variance between length measured in-situ by tape and length derived from the created model did not exceed 6mm.
5.3 Photogrammetry
5.3.1 Survey: In the photogrammetric part of the project four
cameras were tested: two reflex cameras – Pentax 645D and Cannon EOS 450D, one low-cost compact camera – Sony CyberShot DSC-HX50 and camera build-in iPhone 5s. The range selection of camera was tested to show the potential of various camera types.
Figure 2. Tested cameras: a) Pentax 645D; b) Canon EOS 450D; c) Sony CyberShot DSC-HX50; d) iPhone 5s
Figure 3. Image from camera: a) Pentax 645D; b) Canon EOS 450D; c) Sony CyberShot; d) iPhone 5s
Camera Pentax 645D Canon EOS 450D Sony CyberShot iPhone s5
Image
size - MB 17 3,5 4 2
Number
of images 56 83 34 32
Number of points
[millions] 43.0 24.9 4.3 4.5
GSD for
dist.=12m 1.3mm 1.6mm 0.6mm 0.6mm Distance
between nearest points in
PC
0.2-0.5cm 0.2-0.5cm 1.0-1.5cm 1.5cm
1.0-Table 5. Image processing - parameters
The main parameter which can determine the level of detail in generated model is the GSD (Ground Sample Distance, see the subsection 2.2). An aim of the testing was to set the same GSD for all cameras. Due to this assumption and different cameras parameters the scanning distance had to vary from 15 to 40m. Given the situation on site this was not possible, the distance has been set to 12m and imaging has been performed by various camera types (see Fig. 2). Facing the camera differences (focal length and sensor type in particular) images cover various object areas. That led to a different number of images needed to cover the entire object, see Tab. 5. Image acquisition took from 10 to 20 min dependent on the camera used.
5.3.2 Data Processing: Imaging data processing has been
conducted using Agisoft Photoscan software according basic workflow. After image import an image alignment has been performed. It is the automatic identification of connecting tie points followed by calculation of interior and exterior orientation parameters. Orientation and scale setting was ensured by using ground control points (GCP) – see Fig. 4. The GCP coordinates have been gained by reading the model derived from laser scanning and use of similar coordinate system for an outcome has been ensured. This principle of method comparison has been recently performed by (Bayram et al, 2015). After image orientation a point cloud has been generated and exported into *.txt format. Following workflow has been similar to laser scanning data and has been accomplished by Geomagic Studio software.
Figure 4. Position of GCPs
5.3.3 Results: Several parameters vary according to the
camera type. It is the number of images required for computations (32-83), the processing time (from 1.5 hour for iPhone to approximately 20 hours for Pentax) and the density of final point cloud. Processing time differs according to the image size and number. Density of the final point cloud is mainly based on camera quality and especially on the camera sensor size. The larger the sensor the larger the elements that correspond to the pixel size. The larger the sensor the more light is coming towards it resulting to an image of higher quality (higher signal to noise ratio). The amount of noise in the derived point cloud shows the image quality – the less noise the higher quality image (Fig.5).
Figure 5. Point cloud from: a) Pentax 645D; b) Canon EOS 450D; c) Sony CyberShot; d) iPhone 5s
5.4 Comparison
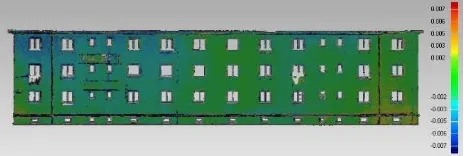
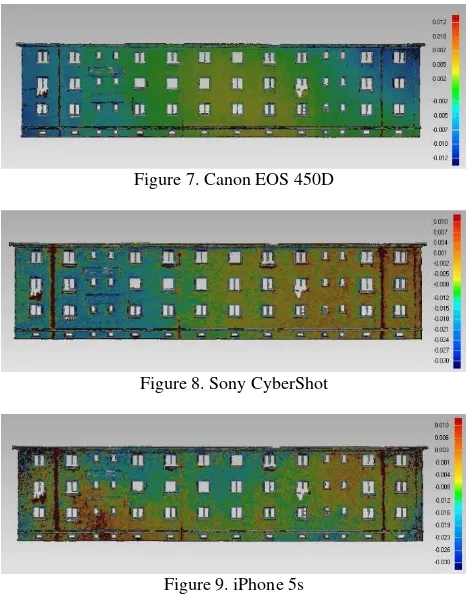
The resulting point clouds derived from various camera types have been compared with polygon model created from laser scanning data using Geomagic Studio software. For this comparison the laser scanning method has been used as a reference. Figures 6 to 9 demonstrate distances between points acquired from photogrammetric and laser scanning point clouds (dark blue and dark red mean values bigger than ±1cm, green means difference less than ±2mm).
Figure 6. Pentax 645D
Figure 7. Canon EOS 450D
Figure 8. Sony CyberShot
Figure 9. iPhone 5s
Comparisons indicates that the largest variances between the laser scanning and the photogrammetric outcomes can be seen in a case of a low-cost Sony and for an iPhone camera. Both cameras show significant noise level in the data – noise level reaches values as high as several centimetres. A part of this noise level can be eliminated using software tools, but generally this data cannot be used for the MORE-CONNECT project purposes. Variations between laser scanning and photogrammetry outcomes when using reflex cameras are distinctly lower (see Fig. 6 and 9). These differences are lower than 5mm on the majority of the model. Noise level has been considerably reduced when compared to non-reflex cameras mentioned earlier. A systematic error has probably occurred in the Cannon camera output – building margins have negative difference values whereas in the centre of the edifice positive difference values can be found. A deformation has arrived in the model creation. This model has been made using the highest number of images (83). When a larger number of images is employed, the risk of the model deformation rises. This risk can be reduced by using larger number of GCP.
It has been found that the point cloud derived from the Pentax camera provides the best results. This data carry accuracy is comparable to the laser scanning point cloud and has a higher density.
6. CONCLUSIONS
Photogrammetric and laser scanning methods have been used and tested for the building documentation in the MORE-CONNECT project. Testing shows that both methods are convenient. Use of a particular method is based on project specifications and requirements as well as on ordering party preferences. Use of Ground control points (GCP) is recommended for higher accuracy demands (<5mm) and when larger objects (residential houses) are of interest. Geodetic total station provides fine and quick GCP measurements.
REFERENCES
Bayaram, B. et al., 2015. Comparison of Laser Scanning and Photogrammetry and Their Use for Digital Recording of Cultural Monument Case Study: Byzantine Land Walls-Istanbul. The ISPRS Annals of Photogrammetry, Remote Sensing and Spatial Information Sciences, I-3, p. 17-24, Taipei.
Grussenmeyer, P. et al., 2008. Comparison Methods of Terrestrial Laser Scanning, Photogrammetry and Tacheometry Data for Recording of Cultural Heritage Buildings. The International Archives of Photogrammetry, Remote Sensing and Spatial Information Sciences, 37(B5), p. 213-218, Beijing.
ICAO, 2015. Manual on Remotely Piloted Aircraft Systems (RPAS). p.166, ISBN 978-92-9249-718-7.
Luhman, T. et al., 2011. Close Range Photogrammetry: Principles, Techniques and Applications. Whittles Publishing, p. 528, ISBN 978-184995-057-2.
Pfeifer, N.; Briese, Ch., 2007. Laser scanning – principles and applications. http://publik.tuwien.ac.at/files/pub-geo_1951.pdf
Remondino, F.; Campana, S., 2014. 3D Recording and Modelling in Archaeology and Cultural Heritage: Theory and Best Practices. Archaeopress, p.171, ISBN 978-1-4073-1230-9.
Skarlatos, D.; Kiparissi, S., 2012. Comparison of Laser Scanning, Photogrammetry and SFM-MVS Pipeline Applied in Structures and Artificial Surfaces. The ISPRS Annals of Photogrammetry, Remote Sensing and Spatial Information Sciences, I-3, p. 299-304, Melbourne.
Tang, P.; et al., 2010. Automatic reconstruction of as-built building information models from laser-scanned point clouds: A review of related techniques. In: Automation in Construction 19, p.829-843.
Vosselman, G.; Maas, H.-G.; et al., 2010. Airborne and Terrestrial Laser Scanning. Dunbeath, Scotland, UK: Whittles Publishing, 2010. p.318, ISBN 978-1904445-87-6.
APPENDIX
This research has been supported by the European Union’s H2020 framework programme for research and innovation under project MORE-CONNECT