UAV MONITORING FOR ENVIROMENTAL MANAGEMENT IN GALAPAGOS
ISLANDS
D. Ballaria,*,D. Orellanab, E. Acostaa, A. Espinozac, V. Morochoc
a Civil Engineering Department. Faculty of Engineering. University of Cuenca, Cuenca, Ecuador - (daniela.ballari, enrique.acosta)@ucuenca.edu.ec
b Faculty of Agricultural Sciences. University of Cuenca, Cuenca, Ecuador - [email protected] c Computer Science Department. Faculty of Engineering. University of Cuenca, Cuenca, Ecuador - (angel.espinozav,
villie.morocho)@ucuenca.edu.ec
ThS11
KEY WORDS: UAV, monitoring, Galápagos, NDVI, OBIA classification, Random Forest, littoral vegetation
ABSTRACT:
In the Galapagos Islands, where 97% of the territory is protected and ecosystem dynamics are highly vulnerable, timely and accurate information is key for decision making. An appropriate monitoring system must meet two key features: on one hand, being able to capture information in a systematic and regular basis, and on the other hand, to quickly gather information on demand for specific purposes. The lack of such a system for geographic information limits the ability of Galapagos Islands’ institutions to evaluate and act upon environmental threats such as invasive species spread and vegetation degradation. In this context, the use of UAVs (unmanned aerial vehicles) for capturing georeferenced images is a promising technology for environmental monitoring and management. This paper explores the potential of UAV images for monitoring degradation of littoral vegetation in Puerto Villamil (Isabela Island, Galapagos, Ecuador). Imagery was captured using two camera types: Red Green Blue (RGB) and Infrarred Red Green (NIR). First, vegetation presence was identified through NDVI. Second, object-based classification was carried out for characterization of vegetation vigor. Results demonstrates the feasibility of UAV technology for base-line studies and monitoring on the amount and vigorousness of littoral vegetation in the Galapagos Islands. It is also showed that UAV images are not only useful for visual interpretation and object delineation, but also to timely produce useful thematic information for environmental management.
1. INTRODUCTION *
A critical factor for rational natural resources management is information availability (De Gruijter et al., 2006). In the Galapagos Islands, where 97% of the territory is protected and ecosystem dynamics are highly vulnerable, timely and accurate information is key for decision making. An appropriate monitoring system must meet two key features: on one hand, being able to capture information in a systematic and regular basis; and on the other hand, to quickly gather information on demand for specific purposes. The lack of such a system for capturing geoinformation limits the ability of Galapagos Islands’ institutions to evaluate and act upon environmental threats such as invasive species spread and environmental degradation. It was reported that anthropogenic impacts have already caused the degradation of 5% of the Archipelago (Watson et al., 2010). Large populated places in Galapagos are located near the coastline, where dominant vegetation are shrubs and mangroves. Degradation of littoral vegetation, and mangroves in particular, is critical for both, land and marine species. As an example, the critically endangered mangrove finch (Camarhynchus heliobates) was historically recorded in five mangrove forests on Isabela Island and one of them was close to Puerto Villamil’s urban area. This specie is currently confined to only three small mangrove patches on the island (Fessl et al., 2010) and the population size is estimated in only about 100 individuals (BirdLife International, 2015). Littoral vegetation monitoring is therefore of utmost importance in Galapagos, in order to trigger early warning alerts when vegetation degradation is detected.
* Corresponding author
Imagery from remote sensing satellite platforms has been used in Galapagos for several decades for environmental research and management (Trueman et al., 2013; Trueman et al., 2014). However, a number of disadvantages limit the applications of such platforms in regions such as Galapagos (Matese et al., 2015). On the one hand, the high frequency of cloud coverage above the islands along the year makes difficult to obtain clear imagery at regular time intervals. On the other hand, the relatively low spatial resolution of free and low-cost products limits the possibilities for timely detection of changes at small scales. These limitations hinder the potential of satellite imagery based monitoring systems in Galapagos. In this context, UAVs (unmanned aerial vehicles) are a promising technology for environmental monitoring in the Galapagos Islands. They offers a low-cost and rapid deployment alternative for geoinformation generation (Anderson and Gaston, 2013). UAVs are revolutionizing the way in which georeferenced imagery is captured (Colomina and Molina, 2014). Images have very high spatial resolutions (sub-decimeter) which generate a huge amount of information (several billion pixels) (Hardin and Jensen, 2011). Conversely , spectral resolution is usually low due the limited characteristics of the sensors that are generally used (Teodoro and Araujo, 2016).
UAV technology is currently in growth and expansion, providing a wide range of available options in the market. Colomina and Molina (2014) provided an UAV classification according to their main characteristics. In relation to its weight, they range from micro UAV (less than 5kg), mini (less than 30kg), to tactical (less The International Archives of the Photogrammetry, Remote Sensing and Spatial Information Sciences, Volume XLI-B1, 2016
than 150kg). In relation to the coverage area, from less than 10km to 70km or more; in relation to flight autonomy from few minutes to 30 hours. UAV are also available with fixed wing or propellers and with cameras in the visible, infrared, multi-spectral, thermal and LiDAR spectrums.
The wide variety of UAVs makes also very wide the range of possible applications, such as agriculture (Zhang and Kovacs, 2012); environment and ecology (Anderson and Gaston, 2013; Salamí et al., 2014); natural disasters (Baiocchi et al., 2013); cadaster (Rijsdijk et al., 2013) and cultural heritage (Bendea et al., 2007). Specifically for environmental management is was applied to biomass monitoring (Bendig et al., 2015); forest tree discrimination (Clark et al., 2005); health condition of riparian forest species (Michez et al., 2016); weed mapping in crop fields (Peña et al., 2013); forest fallen trees detection (Inoue et al., 2014) and quantification of forest gap patterns (Getzin et al., 2014).
This paper explores the potential of UAV images for monitoring degradation of littoral vegetation in Puerto Villamil (Isabela Island, Galapagos, Ecuador). UAV imagery was captured in June 2015 using two camera types: Red Green Blue (RGB) and Nir Red Green (NIR). First, vegetation presence was identified through NDVI. Second, object-based classification was carried out for characterization of vegetation vigor. This work demonstrates the feasibility of UAV technology for base-line studies and monitoring on the amount and vigorousness of littoral vegetation in the Galapagos Islands.
2. METHOD 2.1 UAV flights
Fights were done in June 2015 in Puerto Villamil which is located in Isabela Island, Galapagos (Figure 1). It was used an eBee AG from SenseFly (https://www.sensefly.com/drones/ebee-ag.html). Two flights were done, one focused on the visible region of the spectrum and the other in the near infrared region. Both flights were conducted in order to achieve a spatial resolution of 7 cm.
(a) (b)
Figure 1 Galapagos Islands. (a) In the American Continent context, and (b) Puerto Villamil, Isabela Island In the first flight, the UAV was equipped with a RGB camera (Sony WX with blue 450 nm, red 520 nm and green 660 nm bands). It was covered 409 ha, collecting 242 images. Post-processing was done with Postflight Terra 3D and consisted of three steps. First, an initial calibration processing generated a quality report indicating the overlapping density per pixel, gaps or mosaic distortion, number of images calibrated and georeferenced. Second, densification of 3D point cloud was done. Third, the orthomosaic and digital surface model were
generated. This resulted of 64 tiles with around 1.3 billion pixels (Figure 2). In the second flight, the UAV was equipped with a NIR camera (Cannon S110 with green 550 nm, red 625 nm and infrared 850 nm). It was covered a smaller area of 85 ha, collecting 69 images. After post-processing, an orthomosaic with 12 tiles was obtained (around 207 million pixels) (Figure 2).
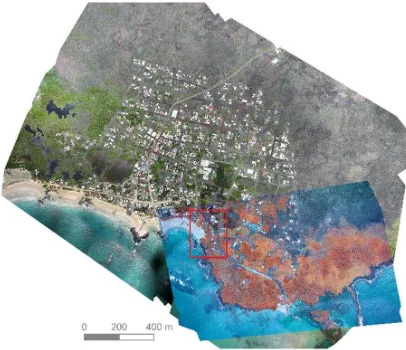
Figure 2. Overlapped orthomosaics generated with the two UAV flights (RGB and NIR). In red is highlighted the selected
region of interest
2.2 Region of interest and NDVI masking
One of the main bottleneck to perform image classification is computing time. In order to achieve a reasonable computing time, we selected a region of interest containing land cover types which were representative for the whole image (Figure 3). It contained urban areas (roads and buildings) and natural areas (vegetation, sea, sand, bare soil, and lava rocks). It covered 5.7 ha with close to 12 million pixels.
(a) (b)
Figure 3. Region of interest. (a) RGB image and (b) NIR image Since images were obtained from two flights, shifts of 4 to 6 cm were detected among images. To correct this effect, NIR image was linearly moved to overlap RGB image. Spatial resolution was kept at 7 cm. Finally, a multiband image was created groping red, green and blue bands from RGB image as well as infrared, red and green bands from NIR image (i.e. r_RGB, g_RGB, b_RGB, nir_NIR, r_NIR and g_NIR bands).
Finally, in order to focus attention of OBIA classification only on vegetation, NDVI was calculated and values larger than 0.025 were selected, while the smaller were masked. The threshold was The International Archives of the Photogrammetry, Remote Sensing and Spatial Information Sciences, Volume XLI-B1, 2016
selected through visual interpretation. These processes were done in QGIS in combination with R using rgdal and raster packages.
2.3 OBIA classification
Traditional imagery classification methods are pixel-based. Each individual pixel is compared with training information in order to decide the class it belongs to. They have been largely used for low spatial and large spectral resolutions. However, when classifying UAV images with pixel-based classification, three challenges are present. First, it has been shown that the quality of prediction is reduced when spatial resolution increase. Second, billon pixels of UAV significantly increase computing time. Third, UAV has very low spectral resolution which is a disadvantage for classification. In this context, object-based image classification (OBIA) showed a better performance in comparison to pixel-based analysis. OBIA is performed through two steps: segmentation and classification (Blaschke et al., 2014; Teodoro and Araujo, 2016).
2.3.1 Segmentation
Segmentation is the process by which an image is subdivided into homogeneous objects. It was performed with the Mean Shift Segmentation algorithm (MSS) implemented in ORFEO toolbox. It selects neighboring pixels based on iterations of spatial radius and color range. Three main parameters need to be set: the spatial radius used to define the neighborhood, the range radius used to define the interval in the color space, and the minimum size for the regions to be kept after clustering. Then, the segmented image is converted to shapefile polygons (Teodoro and Araujo, 2016). We performed segmentation with the multiband image (r_RGB, g_RGB, b_RGB, nir_NIR, r_NIR and g_NIR bands). Segmentation was masked with NDVI smaller than 0.025. The three MSS parameters were set as: spatial radius of 10, range radius of 20, minimum regions size of 4. They were chosen after combination of different parameter values and visual interpretation of results.
2.3.2 Classification
Supervised image classification transforms a set of bands with multispectral reflectance information in a single layer containing discrete thematic information, typically "classes" of land cover. It requires to identify a set of predictive variables (bands) and the classes or land cover to classify. It is also needed to select training as well as validation polygons. Then a classificator is executed to assigns each segmented object to a defined class.
We selected two classes: high and low vegetation vigor. High vegetation vigor was related to high chlorophyll level and those located in high water content soil. Low vegetation vigor was related to leafless trees, low chlorophyll level and algae on lava rocks in the intertidal zone. We used 6 predictive variables, 3 bands from the RGB image (red, green and blue), and 3 from NIR image (infrared, red and green). Training polygons were identified based on segmentation results. A total of 139 segments were recognized as belonging to high vigor class (60 segments) or to low vigor class (79 segments). Polygons identification were scattered throughout the region of interest taking into consideration class variability (Figure 4a).
The used classificator was Random Forest (Breiman, 2001). This is based on a collection of decision trees, where each tree is form with a subset of segments. The subset is selected through a ramdom sampling with replacement (Bagging o Bootstrap Aggregating). In this sampling, 1/3 of the data is left out to
estimate the goodness of classification, in order to compute the “out-of-bagging error” or OBB. Each decision tree returns a “vote” and the algorithm choose the class that most votes obtained in all generated trees (Belgiu and Dragut, 2016; Lawrence et al., 2006; Rodriguez-Galiano et al., 2012). For computation, it was used the randomForest library in R (Liaw and Wiener, 2002), with 500 decision trees.
Finally, validation segments were labeled independently from classification results in order to build a confusion matrix and report classification accuracy. A total of 84 polygons were labeled (Figure 4b). The confusion matrix was generated with
Caret library in R (Kuhn, 2008).
(a) (b)
Figure 4. Labeled segments. (a) Training segments (a), and (b) validation segments
3. RESULTS 3.1 NDVI masking
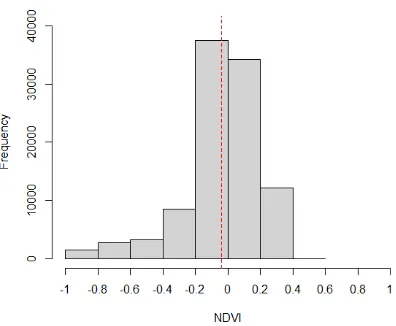
Figure 5 shows the NDVI map. In red color there is the sea (values between -0.5 to -0.8), in orange and yellow colors there are the bare soil, buildings, roads and sand (values between -0.5 and 0.025), and in different shades of green there is vegetation (values between 0.025 and 0.6). Darker green color is associated with high chlorophyll content while light green with lower chlorophyll content, which may be due to dried or leafless plants. NDVI was also able to highlight small amounts of marine algae located in lava rocks in the intertidal zone. Maximum NDVI value was of 1, however only 3 pixels had values larger than 0.4. Figure 6 summarizes NDVI value distribution. After NDVI masking, the region of interest was reduced to 2.45 ha with 5 million pixels (Figure 5b).
(a) (b)
Figure 5. NDVI. (a) NDVI map and (b) masked NDVI with values smaller than 0.025
Figure 6. Distribution of NDVI values for the region of interest. Red dashed line is the mean NDVI value
3.2 Segmentation
Segmentation gave as result 18815 polygons (Figure 7), which represented only the 0.2 % of the total pixels from the region of interest. It was well performed being able to detect small as well large segments of homogenous vegetation. Mean segmentation area was of 1.3 m2. Only 10 segments had areas larger than 100 m2, and all of them represented high vegetation vigor. Figure 8 shows the histogram of segment areas for smaller areas than 10 m2 (which contained 99.25 % of total segments).
It was detected that some building roofs were segmented. Their NDVI values were larger than 0.025, which may be because of roof material reflecting infrared wavelength or moss presence on the roofs. The first case is likely to occur in two cases when the whole roof was segmented, while the second in cases where only small parts of the roof were segmented. Additionally, some vegetation located in soil with high water content were not selected for segmentation since their NDVI was lower than 0.025.
(a) (b)
Figure 7. Segmentation. (a) For the whole region of interest and (b) for a detailed region
Figure 8. Histogram of segment areas for segments smaller than 10 m2. Red dashed line is the mean segment area
3.3 Classification
Table 1 and Figure 9 show classification results. They show a predominance of vegetation with high vigor (75 %) and less presence of vegetation with low vigor (25 %).
Vegetation Number of segments Area (ha) %
High vigor 10386 1.83 74.67
Low vigor 8429 0.62 25.33
Total 18815 2.45 100.00
Table 1. Vegetation distribution by class.
Figure 9. Classification of region of interest. Red squares are details shown by figure 10
Figure 10 shows detailed areas for classification and their respective NIR images. Figures 10a and 10b show algae in the intertidal zone. This vegetation is essential to feed the marine iguanas. This were classified as vegetation with low vigor The International Archives of the Photogrammetry, Remote Sensing and Spatial Information Sciences, Volume XLI-B1, 2016
because it has low chlorophyll level and density. In other to capture this type of vegetation is needed to plan UAV flights during low tides. Figures 10c and 10d mainly show palm plants in urban area of Puerto Villamil. In Galapagos’ urban areas are typical to find non-native and invasive species such as palms. Most of the palms were classified as vegetation with high vigor, while few of them with low vigor. Finally, figures 10e and 10f show mangroves located close to the sea. There are mangrove areas with high vigor because of high chlorophyll level and density, while others with low vigor because of leafless plants or poor mangrove density.
Figure 10. Classification detailed areas. (a - b) Algae in intertidal zone; (c - d) Palm urban vegetation; (e - f) Mangrove
vegetation
For training data, the overall OOB error was 2.16 %. The error class for low vegetation vigor was 0%, while for high vigor was 0.05% with 3 segments misclassified. For validation data, table 2 shows the confusion matrix with misclassification by coverage type. Overall classification accuracy was of 0.94 with a Kappa index of 0.88. Vegetation with high vigor was correctly classified, while vegetation with low vigor had a 12% of misclassifications.
Vegetation
coverage High vigor Low vigor Misclassification (%)
High vigor 43 0 0
Low vigor 5 36 12
Table 2. Confusion matrix for validation segments
Finally, figure 11 shows the predictive variables importance for classification by the Mean Decrease Accuracy. In the y-axis are the predictive variables and in the x-axis their importance for classification. It illustrates how the accuracy of the classification was reduced during the "out-of-bagging” process. It is observed that the bands that had more impact on the classification accuracy were green NIR and blue RGB bands, followed by the infrared NIR band. Less impact on the classification accuracy had green RGB and both RGB and NIR red bands. Variable importance could be used in future classifications for variable selection.
Figure 11. Variable importance for classification
4. DISCUSION AND CONCLUSIONS
This study explored the potential of UAV image analysis for monitoring degradation of littoral vegetation in a pilot area of the Galapagos Islands. OBIA classification for high and low vegetation vigor was done on a NDVI masked image. This image was compound of RGB and NIR bands. The segmentation step of OBIA was performed with the Mean Shift segmentation algorithm implemented in ORFEO toolbox, and the classification step with the randomForest library in R. This work demonstrates the feasibility of UAV technology for base-line studies and monitoring on the amount and vigorousness of littoral vegetation in the Galapagos Islands. The results showed that images of UAVs are not only useful for visual interpretation and digitization, but that they are also suitable for generation of environmental thematic information.
In the analysis presented here, we did not perform atmospheric and radiometric corrections which, in the case of satellite images, are needed to obtain radiance values for proper interpretation of NDVI and temporary analysis. While the effect of the atmosphere is much lower in UAVs than satellite images, this effect needs to be quantified in order to properly apply image analysis.
Regarding NDVI masking, two issues need to be addressed. First, in areas with high soil water content, NDVI had very low values. So that vegetation located in these areas were masked by the selected threshold. Second, some building roofs had NDVI larger than 0.025. This could be because of roof material reflecting infrared wavelength or moss presence on the roofs for the high humidly levels in the region of interest. Therefore, it will be needed to explore and compare the NDVI masking process with The International Archives of the Photogrammetry, Remote Sensing and Spatial Information Sciences, Volume XLI-B1, 2016
other vegetation indices such as EVI (Enhanced Vegetation Index), SAVI (Soil-adjusted Vegetation Index) or IPVI (infrared percentage vegetation index).
The bottleneck in UAV image analysis is the huge amount of pixels, the very high spatial resolution and the low spectral resolution. Consequently, OBIA classification offers a solution to manage these issues. Segmentation as well as classification could be improved by the use of textures. This will be necessary for specie identification, especially for invasive species such as blackberry, Spanish cedar (Cedrela odorata), or guayagillo (Eugenia pachychlamys).
UAVs are revolutionizing geoinformation capturing, allowing on demand and rapid deployment captures. This become especially relevant in tropical areas, such as Galapagos Islands, were satellite monitoring is very limited because of an almost permanent cloud coverage. We identified potential applications of UAV for environmental management in both protected and populated areas of Galapagos, for instance: invasive species identification, vegetation health monitoring, tourist visiting sites monitoring, monitoring of mining materials or wood extraction, and extension and seasonality variation of wetlands. Our future research will be related to explore OBIA classification with texture analysis for invasive species identification.
ACKNOWLEDGEMENTS
This work was carried out within the project "Integration of spatial data and environmental monitoring with UAVs for decision making in populated and protected areas of the Galapagos Islands" funded by World Wildlife Fund, Inc. (WWF) and University of Cuenca.
REFERENCES
Anderson, K., & Gaston, K. J. (2013). Lightweight unmanned aerial vehicles will revolutionize spatial ecology. Frontiers in Ecology and the Environment, 11(3), 138–146.
Baiocchi, V., Dominici, D., & Mormile, M. (2013). UAV application in post-seismic environment. Int. Arch. Photogramm. Remote Sens. Spatial Inf. Sci., XL-1 W, 2, 21–25.
Belgiu, M., & Dragut, L. (2016). Random forest in remote sensing: A review of applications and future directions. ISPRS Journal of Photogrammetry and Remote Sensing, 114, 24–31. Bendea, H., Chiabrando, F., Giulio Tonolo, F., & Marenchino, D. (2007). Mapping of archaeological areas using a low-cost UAV. The Augusta Bagiennorum test site. In XXI International CIPA Symposium, 01-06 octobre 2007, Athens, Greece. Bendig, J., Yu, K., Aasen, H., Bolten, A., Bennertz, S., Broscheit, J., Bareth, G. (2015). Combining UAV-based plant height from crop surface models, visible, and near infrared vegetation indices for biomass monitoring in barley. International Journal of Applied Earth Observation and Geoinformation, 39, 79–87. BirdLife International. (2015). Camarhynchus heliobates.
Retrieved April 12, 2016, from
http://dx.doi.org/10.2305/IUCN.UK.2015-4.RLTS.T22723786A77574068.en
Blaschke, T., Hay, G. J., Kelly, M., Lang, S., Hofmann, P., Addink, E., others. (2014). Geographic object-based image
analysis--towards a new paradigm. ISPRS Journal of Photogrammetry and Remote Sensing, 87, 180–191.
Breiman, L. (2001). Random forests. Machine Learning, 45(1), 5–32.
Clark, M. L., Roberts, D. A., & Clark, D. B. (2005). Hyperspectral discrimination of tropical rain forest tree species at leaf to crown scales. Remote Sensing of Environment, 96(3), 375–398.
Colomina, I., & Molina, P. (2014). Unmanned aerial systems for photogrammetry and remote sensing: A review. ISPRS Journal of Photogrammetry and Remote Sensing, 92, 79–97.
De Gruijter, J. J., Brus, D. J., Bierkens, M. F. P., & Knotters, M. (2006). Sampling for natural resource monitoring (1st ed.). Springer Verlag.
Fessl, B., Young, G. H., Young, R. P., Rodríguez-Matamoros, J., Dvorak, M., Tebbich, S., & Fa, J. E. (2010). How to save the rarest Darwin’s finch from extinction: the mangrove finch on Isabela Island. Philosophical Transactions of the Royal Society of London B: Biological Sciences, 365(1543), 1019–1030. Getzin, S., Nuske, R. S., & Wiegand, K. (2014). Using unmanned aerial vehicles (UAV) to quantify spatial gap patterns in forests.
Remote Sensing, 6(8), 6988–7004.
Hardin, P. J., & Jensen, R. R. (2011). Small-scale unmanned aerial vehicles in environmental remote sensing: Challenges and opportunities. GIScience & Remote Sensing, 48(1), 99–111. Inoue, T., Nagai, S., Yamashita, S., Fadaei, H., Ishii, R., Okabe, K., Suzuki, R. (2014). Unmanned aerial survey of fallen trees in a deciduous broadleaved forest in eastern Japan. PloS One, 9(10), e109881.
Kuhn, M. (2008). Caret package. Journal of Statistical Software,
28(5).
Lawrence, R. L., Wood, S. D., & Sheley, R. L. (2006). Mapping invasive plants using hyperspectral imagery and Breiman Cutler classifications (RandomForest). Remote Sensing of Environment,
100(3), 356–362.
Liaw, A., & Wiener, M. (2002). Classification and regression by randomForest. R News, 2(3), 18–22.
Matese, A., Toscano, P., Di Gennaro, S. F., Genesio, L., Vaccari, F. P., Primicerio, J., Gioli, B. (2015). Intercomparison of uav, aircraft and satellite remote sensing platforms for precision viticulture. Remote Sensing, 7(3), 2971–2990.
Michez, A., Piégay, H., Lisein, J., Claessens, H., & Lejeune, P. (2016). Classification of riparian forest species and health condition using multi-temporal and hyperspatial imagery from unmanned aerial system. Environmental Monitoring and Assessment, 188(3), 1–19.
Peña, J. M., Torres-Sánchez, J., de Castro, A. I., Kelly, M., & López-Granados, F. (2013). Weed mapping in early-season maize fields using object-based analysis of unmanned aerial vehicle (UAV) images. PLoS One, 8(10), e77151.
Rijsdijk, M., Cadastre, D., Cadastre, W. H. M. van H. D., Witteveen, W., ten Buuren, G. H. M., Police, D., NLR, R. L. (2013). Unmanned Aerial Systems in the process of Juridical Verification of Cadastral Borders. In Presentation at UAV-g
Conference, Rostock University, Rostock, Germany. http://www.
uav-g. org/Presentations/UAS_for_Cadastal_Applications/
Rijsdijk_MUAS_in_the_process_of_juridical_verification. pdf. Rodriguez-Galiano, V. F., Ghimire, B., Rogan, J., Chica-Olmo, M., & Rigol-Sanchez, J. P. (2012). An assessment of the effectiveness of a random forest classifier for land-cover classification. ISPRS Journal of Photogrammetry and Remote Sensing, 67, 93–104.
Salamí, E., Barrado, C., & Pastor, E. (2014). UAV flight experiments applied to the remote sensing of vegetated areas.
Remote Sensing, 6(11), 11051–11081.
Teodoro, A. C., & Araujo, R. (2016). Comparison of performance of object-based image analysis techniques available in open source software (Spring and Orfeo Toolbox/Monteverdi) considering very high spatial resolution data. Journal of Applied Remote Sensing, 10(1), 16011.
Trueman, M., Hobbs, R. J., & Van Niel, K. (2013). Interdisciplinary historical vegetation mapping for ecological restoration in Galapagos. Landscape Ecology, 28(3), 519–532. Trueman, M., Standish, R., Orellana, D., & Cabrera, W. (2014). Mapping the extent and spread of multiple plant invasions can help prioritise management in Galapagos National Park.
NeoBiota, 23, 1.
Watson, J., Trueman, M., Tufet, M., Henderson, S., & Atkinson, R. (2010). Mapping terrestrial anthropogenic degradation on the inhabited islands of the Galápagos archipelago. Oryx, 44(01), 79–82.
Zhang, C., & Kovacs, J. M. (2012). The application of small unmanned aerial systems for precision agriculture: a review.
Precision Agriculture, 13(6), 693–712.