www.elsevier.com/locate/econedurev
Sources of funds and quality effects in higher education
William O. Brown
*Department of Economics, Claremont McKenna College, Claremont, CA 91711, USA
Received 31 August 1999; accepted 21 January 2000
Abstract
Economists have suggested that the quality of higher education is not independent of the sources of funds used to fund that education. This paper examines the relationship between student measures of teaching quality and institutional revenue sources. The results indicate that a greater reliance on private subsides is associated with higher measures of teacher quality. A greater reliance on public subsidies, however, leads to lower teacher quality ratings. The importance of these results for shaping public policy decisions is also discussed.2001 Elsevier Science Ltd. All rights reserved.
JEL classification:I22; L30; H42
Keywords:Higher education; Educational finance
“The endowments of schools and colleges have necessarily diminished more or less the necessity of application in the teachers. Their subsistence, so far as it arises from their salaries, is evidently derived from a fund altogether independent of their success and reputation in their particular professions.” (Adam Smith,An Inquiry into the Causes and Consequences of the Wealth of Nations, 1993 World Classics Edi-tion, p. 421)
1. Introduction
More than two hundred years have passed since Adam Smith argued that the performance of institutions of higher education is influenced by the sources of their operating revenue. Economists and public policy-makers continue to debate the merits of private and public sub-sidies to higher education. However, there has been little research that examines the empirical relationship between the teaching performance of institutions of
* Tel.:+1-909-607-3664; fax:+1-909-621-8249.
E-mail address:[email protected] (W.O. Brown).
0272-7757/01/$ - see front matter2001 Elsevier Science Ltd. All rights reserved. PII: S 0 2 7 2 - 7 7 5 7 ( 0 0 ) 0 0 0 1 7 - 0
higher education and the sources of funds. This paper makes use of teaching quality ratings based on student surveys as a measure of performance.
While student satisfaction is only one of many poss-ible measures of academic performance, it is still an important measurement of educational performance. Stu-dents purchase education for many reasons. Higher edu-cation can be thought of as both a pure consumption good and as an investment in human capital. Students expect to obtain satisfaction from the consumption of the good and/or higher future earnings as a result of the con-sumption of the good. It is important to measure both the consumer satisfaction and consumer investment returns from the consumption of the good. The data in this paper focus on student satisfaction and not invest-ment returns. The results confirm that the source of cational funds is related to students’ perception of edu-cational quality in an important manner.
2. University performance, behavior and the source of funds
2.1. Tuition vs. private subsidies
incomes were highly dependent on the number of stu-dents they could attract, with that of England, where schools were supported primarily by large endowments. Smith believed the latter system destroyed both the incentives to teach well and to teach useful subjects.1A
related argument is that private donations are used to produce attributes desired by donors but not by students.2
In some cases private donors or foundations may require that universities conduct certain activities or make spe-cific changes that reduce educational quality.
Modern arguments concerning educational funding have been more accepting of private subsidies as a sub-stitute for tuition. A university’s ability to use endow-ment funds to ignore market demands is reduced if the institution requires expansion or if educational costs are rising. The competition for new donations forces the school to compete on those margins that attract additional donations. If donations are related to teaching quality, then a greater reliance on private donations may increase teaching quality (Friedman & Friedman, 1979). If the increased spending is devoted to those attributes that improve educational quality, then it should also lead to improved performance.
2.2. Tuition vs. public subsidies
The modern version of Smith’s argument against endowments has been refocused on the influence of pub-lic subsidies to higher education. Friedman and Friedman (1979), Alchian (1968) and West (1995) argue that government funding has a negative effect on educational quality for reasons similar to Smith’s opposition to priv-ate endowments. However, supporters of government subsidies to public education argue that the subsidies increase the quantity and quality of education provided. In addition to insulating faculty and administrators from the forces of the market, public subsidies may have effects on educational quality (e.g. Stubblebine, 1965; Peltzman, 1973; Lindsay, 1976).
The ultimate impact of government funds is dependent on the political environment in which they are determ-ined. State government funds for higher education come primarily through direct appropriations to state insti-tutions. The subsidy allows these institutions to set tui-tion levels below the average cost of providing the edu-cation. In order to satisfy the preferences of the median voter, state legislators have an incentive to make edu-cation available to as many of their constituents as
poss-1 Smith’s view was not universal among the classical econ-omists. See West (1964) for further discussion.
2 See Lindsay (1976) and the discussion later in this paper for a similar argument with regard to public subsidies.
ible.3While the subsidies may successfully increase
edu-cational access, they are likely to decrease the average quality of education. Local government funding is pre-dicted to have similar effects because the nature of the funding and the incentives of local politicians are similar. It is important to note that a decrease in teaching quality does not mean that these subsidies do not achieve their purpose. Public subsidies may also increase the quality of education on other margins even if they result in lower teaching quality.
Federal government funds to higher education are nor-mally in the form of grants from government agencies and not direct federal appropriations. Therefore, the pressures to increase the number of students and provide the education desired by the median voter are likely to be less intense. However, an increased reliance on fed-eral funds will reduce the reliance of student based rev-enue sources. The most common criticism of federal funding is that teaching quality is lowered as the increased research activity diverts attention away from undergraduate teaching (e.g. Anderson, 1992). An alter-native argument in favor of increased federal funding for research is that teaching and research activities are complements. If less than the optimal level of research would take place in the absence of such subsidies, then subsidizing research may increase teaching quality. Again, even if these subsidies decrease teaching quality, they may promote other valuable social goals or increase educational quality on other margins.
There are three potential effects of private and public subsidies to higher education. The subsidies will likely increase the total resources devoted to education, which may improve teaching quality. However, if these sub-sidies allow administrators and teachers to be less responsive to student desires, then the quality of teaching may decrease as a result of higher subsidies. Finally, if these subsidies are designed to satisfy the goals of priv-ate donors or politicians and not educational goals, then there is no reason to expect them to improve teaching quality. If fact, these alternative goals may not be con-sistent with increased teaching quality.
3. The data
The Princeton Review produces an annual Student Advantage Guide to the Best 310 Collegesthat rates col-leges on many attributes. Two of the ratings given for
each college are “profs interesting” and “profs access-ible.” These ratings are based on the average student response to the questions, “In general how good are your instructors as teachers?” and “In general, how accessible are your instructors outside the classroom?”. The numerical rating reported in the Student Advantage Guide is a number assigned to each institution by the Princeton Review staff based on student responses to a multiple response on-campus survey.4 Each school is
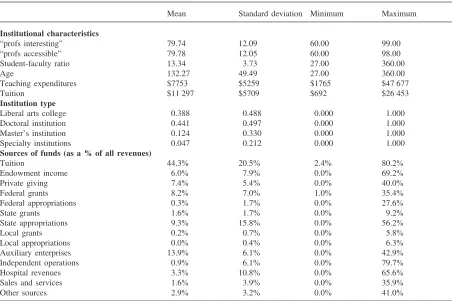
given a score between 0 and 100 with the scores rep-resenting the traditional academic grades (90–100 A, 80– 89 B, etc.). The measure is based upon, but is not the actual, student responses. Surveys were initially conduc-ted annually at each institution. However, the high degree of correlation between annual responses led the Princeton Review to survey each campus at least once during the three years preceding the publication of the survey. Table 1 presents the summary statistics for the two teaching quality variables. Both variables range from 60 to the upper 90s with a mean of 80.
Admittedly, the measure of teaching quality used here concerns the current students’ satisfaction with narrowly defined aspects of teaching. However, these measures allow us to focus on attributes of education — classroom teaching skills and the level of student and faculty inter-action — that are valued by students but may not be associated with standardized test scores or future earn-ings. While this aspect of teaching quality is more con-sistent with Smith’s discussion, the results should be considered in conjunction with other analysis that con-siders alternative measures of academic success. That the teaching quality data is only available for a non-random subset of all colleges and universities also limits the gen-eralization of this analysis.5 However, a sample
com-posed of those institutions where teaching is thought to be more highly valued seems appropriate in this case.
4 SeeThe Student Advantage Guide to The 310 Best Colleges (1997) for more details concerning the survey. ThePrinceton Reviewclaims that the survey is conducted randomly. However, they also admit to advertising that they will be on campus, which suggests that they may not receive an unbiased group of respondents. It is not obvious whether or not this process creates an upward or downward bias in response. However, as long as the process is consistent across institutions there is no reason to expect a bias across institutions.
5 There are several different organizations that rate colleges and universities using various criteria. However, they usually either do not rate all colleges and universities or rate different groups using different criteria. One exception is theGourman Report, which provides a single numerical rating for over 1200 undergraduate colleges and universities. While the rating is directly comparable across colleges and universities, it is not useful for our purposes because the ratings are based in part on the sources of the college’s financing. The same is also true of less inclusive ratings.
The 1997 edition of the Student Advantage Guide reports data from the previous academic year (1995– 1996) for 310 colleges determined by The Princeton Reviewto be the best based on teaching quality and other attributes. In addition to the survey data, the student-fac-ulty ratios for each school were obtained from the Stud-ent Advantage Guide. The average institution in the sam-ple had 13.34 students per faculty member.
TheU.S. Department of Educationconducts an annual survey of sources and uses of funds for institutions of higher education within the Integrated Postsecondary Education Data System (IPEDs). All of the financial data (revenues, expenditures, and tuition) were taken from this source. Complete and reliable financial data were available for the 1994–1995 academic year for 299 col-leges that were included in the teaching survey.6Table
1 provides information on the average tuition per student, teaching expenditures per student and the sources of funds. On average, tuition is the most important source of revenues for the schools in the sample. The second most important source, auxiliary enterprises, is also a student revenue source (dorms, food service, book-stores, etc.).
IPEDs contains revenues and expenditures by insti-tutional total. The sample contains a variety of types of institutions. For example some of the institutions operate large-scale graduate programs while other institutions focus on undergraduate education. In an attempt to ensure that these differences are not captured by other variables, institutional type is specifically controlled for in the analysis. The sample is broken into four types based on the highest level and types of degrees offered: doctoral degree granting institutions, masters degree granting institutions, liberal arts colleges, and specialty schools (arts, music, engineering, etc.). These classi-fications are based on Carnegie Classiclassi-fications that were
Table 1
Summary statistics
Mean Standard deviation Minimum Maximum
Institutional characteristics
“profs interesting” 79.74 12.09 60.00 99.00
“profs accessible” 79.78 12.05 60.00 98.00
Student-faculty ratio 13.34 3.73 27.00 360.00
Age 132.27 49.49 27.00 360.00
Teaching expenditures $7753 $5259 $1765 $47 677
Tuition $11 297 $5709 $692 $26 453
Institution type
Liberal arts college 0.388 0.488 0.000 1.000
Doctoral institution 0.441 0.497 0.000 1.000
Master’s institution 0.124 0.330 0.000 1.000
Specialty institutions 0.047 0.212 0.000 1.000
Sources of funds (as a % of all revenues)
Tuition 44.3% 20.5% 2.4% 80.2%
Endowment income 6.0% 7.9% 0.0% 69.2%
Private giving 7.4% 5.4% 0.0% 40.0%
Federal grants 8.2% 7.0% 1.0% 35.4%
Federal appropriations 0.3% 1.7% 0.0% 27.6%
State grants 1.6% 1.7% 0.0% 9.2%
State appropriations 9.3% 15.8% 0.0% 56.2%
Local grants 0.2% 0.7% 0.0% 5.8%
Local appropriations 0.0% 0.4% 0.0% 6.3%
Auxiliary enterprises 13.9% 6.1% 0.0% 42.9%
Independent operations 0.9% 6.1% 0.0% 79.7%
Hospital revenues 3.3% 10.8% 0.0% 65.6%
Sales and services 1.6% 3.9% 0.0% 35.9%
Other sources 2.9% 3.2% 0.0% 41.0%
obtained from IPEDs.7Table 1 indicates that 44.1% of
the institutions grant doctoral degrees, 38.8% are liberal arts colleges, 12.4% offer a master’s degree as the high-est level of offering, and 4.7% are specialty schools.
4. The model and results
In order to test the relationship between educational quality and the non-tuition sources of funds, the “profs interesting” and “profs accessible” variables are regressed on the sources of funds variables, dummy
vari-7 Doctoral granting institutions include Carnegie classi-fications 11 (Research Universities I), 12 (Research Universities II), 13 (Doctoral Universities I), 14 (Doctoral Universities II). Master’s universities include Carnegie classifications 21 (Master’s I) and 22 (Master’s II). Liberal arts colleges include Carnegie classifications 31 (Baccalaureate I) and 32 (Baccalaureate II). The specialty institutions include schools of art, music, and design (Carnegie Classification 56), schools of business and management (Carnegie Classification 55), and schools of engineering and technology (Carnegie Classification 54). Specialty schools may offer advanced degrees.
ables for institution type, and the institution’s age. The percentage of total dollar revenues from tuition is omit-ted from the model to avoid the problem of linear depen-dence among the financing variables.
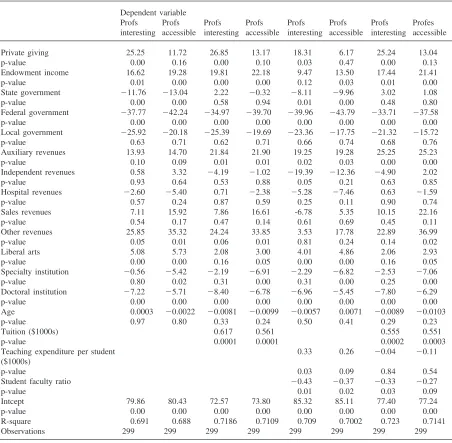
The results presented in Table 2 indicate that a greater reliance on private sources of income and endowment income have a positive impact on the teaching quality variables. A greater reliance on endowment income is associated with increased teaching quality. A one per-cent increase in the ratio of endowment income to tuition revenues increases the teaching ratings by 17 and 19 points. Other private sources of income have a similar effect but it is only significant for the “profs interesting” rating. The inability to separate private donations from private contracts may obscure the full effects of priv-ate giving.
A greater reliance on state and federal government funding is negatively and significantly related to the teaching quality variables.8 The coefficient estimates
Table 2
The relationship between teaching quality and the source of educational fundsa
Dependent variable
Profs Profs Profs Profs Profs Profs Profs Profes
interesting accessible interesting accessible interesting accessible interesting accessible
Private giving 25.25 11.72 26.85 13.17 18.31 6.17 25.24 13.04
p-value 0.00 0.16 0.00 0.10 0.03 0.47 0.00 0.13
Endowment income 16.62 19.28 19.81 22.18 9.47 13.50 17.44 21.41
p-value 0.01 0.00 0.00 0.00 0.12 0.03 0.01 0.00
State government 211.76 213.04 2.22 20.32 28.11 29.96 3.02 1.08
p-value 0.00 0.00 0.58 0.94 0.01 0.00 0.48 0.80
Federal government 237.77 242.24 234.97 239.70 239.96 243.79 233.71 237.58
p-value 0.00 0.00 0.00 0.00 0.00 0.00 0.00 0.00
Local government 225.92 220.18 225.39 219.69 223.36 217.75 221.32 215.72
p-value 0.63 0.71 0.62 0.71 0.66 0.74 0.68 0.76
Auxiliary revenues 13.93 14.70 21.84 21.90 19.25 19.28 25.25 25.23
p-value 0.10 0.09 0.01 0.01 0.02 0.03 0.00 0.00
Independent revenues 0.58 3.32 24.19 21.02 219.39 212.36 24.90 2.02
p-value 0.93 0.64 0.53 0.88 0.05 0.21 0.63 0.85
Hospital revenues 22.60 25.40 0.71 22.38 25.28 27.46 0.63 21.59
p-value 0.57 0.24 0.87 0.59 0.25 0.11 0.90 0.74
Sales revenues 7.11 15.92 7.86 16.61 -6.78 5.35 10.15 22.16
p-value 0.54 0.17 0.47 0.14 0.61 0.69 0.45 0.11
Other revenues 25.85 35.32 24.24 33.85 3.53 17.78 22.89 36.99
p-value 0.05 0.01 0.06 0.01 0.81 0.24 0.14 0.02
Liberal arts 5.08 5.73 2.08 3.00 4.01 4.86 2.06 2.93
p-value 0.00 0.00 0.16 0.05 0.00 0.00 0.16 0.05
Specialty institution 20.56 25.42 22.19 26.91 22.29 26.82 22.53 27.06
p-value 0.80 0.02 0.31 0.00 0.31 0.00 0.25 0.00
Doctoral institution 27.22 25.71 28.40 26.78 26.96 25.45 27.80 26.29
p-value 0.00 0.00 0.00 0.00 0.00 0.00 0.00 0.00
Age 0.0003 20.0022 20.0081 20.0099 20.0057 0.0071 20.0089 20.0103
p-value 0.97 0.80 0.33 0.24 0.50 0.41 0.29 0.23
Tuition ($1000s) 0.617 0.561 0.555 0.551
p-value 0.0001 0.0001 0.0002 0.0003
Teaching expenditure per student 0.33 0.26 20.04 20.11
($1000s)
p-value 0.03 0.09 0.84 0.54
Student faculty ratio 20.43 20.37 20.33 20.27
p-value 0.01 0.02 0.03 0.09
Intcept 79.86 80.43 72.57 73.80 85.32 85.11 77.40 77.24
p-value 0.00 0.00 0.00 0.00 0.00 0.00 0.00 0.00
R-square 0.691 0.688 0.7186 0.7109 0.709 0.7002 0.723 0.7141
Observations 299 299 299 299 299 299 299 299
a The financing variables are measured as a percentage of all institutional revenues. The state, federal and local government variables represent the total of appropriations, grants and contracts from that source. The government variables also include financing aid expenditures from these sources. Eliminating financial aid expenditures from the total does not alter the important results.
indicate that a similar increase in the ratio of federal government funding has a larger negative influence than an increase in the ratio of state government funds. How-ever, given the greater average reliance on state govern-ment funds and larger variation in this reliance across the institutions in the sample, the degree of reliance on state government funds is responsible for a much larger share of the actual variation in teaching quality ranks across institutions.
influ-ence is more difficult to interpret. Hospital revenues are negatively related to teaching quality but the effect is not significant.
Liberal arts colleges claim to devote greater attention to teaching undergraduate students. The results suggest that this is true; a liberal arts college is expected to have ratings that are five to six points higher than non-liberal arts colleges. Specialty schools have lower teaching rat-ings on average but the effect is only significant for the “profs accessible” variable. Institutions offering doctoral degrees have significantly lower teaching ratings. The presence of a doctoral program may signal a greater ability of faculty members to substitute research and con-sulting activities for undergraduate teaching. Classes at these institutions may be taught by less experienced graduate students instead of regular faculty members. There may also be other characteristics of these insti-tutions not directly related to graduate students that are responsible for the lower ratings. The age variable is not significant suggesting that age has little effect in con-junction with the other independent variables.
One potential problem with using students’ percep-tions to measure quality is that the students’ ratings may be based on their expectations. Students at less pres-tigious institutions may have lower expectations con-cerning teaching quality. In order to control for this prob-lem, the average tuition per student is added as an explanatory variable. The average tuition paid by stu-dents is positively and significantly related to perform-ance. With the exception of the state government financ-ing variable, the financfinanc-ing variables that were significant in the original specification are still significant and exhi-bit similar effects. There is a collinearity problem with tuition and state government revenues that may explain the lack of significance as tuition is significantly lower at state supported institutions.
An alternative explanation for these results is that they are not measuring the effects of financing but the total expenditures of the institution. In order to check the robustness of these results, the student-faculty ratio and teaching expenditures per student variables are included in the model as independent variables.9The
student-fac-ulty ratio is negative and significant in for both teaching quality measures while teaching expenditures are posi-tively and significantly related to performance. This sug-gests that student satisfaction with teaching quality is related to student-faculty ratios. The results for the public subsidy variables are the same with the additional con-trols. However, the private giving variable is no longer significant in “profs accessible” model and the endow-ment income variable is no longer significant in the “profs interesting” model.
9 Using total expenditures per student instead of teaching expenditures per student produces similar results.
To the extent that the estimates for the other expendi-ture variables differ, it is possible that the expendiexpendi-ture variable and the student faculty ratio may also be influ-enced by the sources of funds. For example, if higher endowment income results in lower student-faculty ratios and higher teaching expenditures per student, then this procedure may obscure the full effects of endowment income. In any case, the primary results concerning the effects of educational financing are not driven by differ-ences in resources. The results for the specification including average tuition are similar except that the teaching expenditures variable is no longer significant. This is not surprising in that higher tuition is generally associated with higher teaching expenditures.
5. Conclusions
As suggested by Smith, the results presented in this paper do find a relationship between revenue sources and teaching quality. However, a greater reliance on private funding and endowment income does not lead to lower teaching quality ratings as predicted. The results suggest private subsidies allow schools to be more selective and to devote more resources to individual students. Recent studies of higher education (McPherson, Winston, & Schapiro, 1993; Clotfelter, 1996) indicate that many elite institutions have attempted to do exactly this in recent years. These results suggest that such efforts increase teaching quality as predicted by Friedman and Fried-man (1979).
Increased reliance on either state or federal govern-ment funding is associated with teaching quality. Con-sistent with the predictions of Stubblebine (1965) and Lindsay (1976), educational policy outcomes decided in the political market place are not likely to achieve the outcomes desired by the ultimate consumers of the subsi-dized good. In addition, by reducing the correlation between an institution’s ultimate success and the satis-faction of the students, the government may allow the institution to pay less attention to student demands. How-ever, these results should be interpreted with some cau-tion. An increased reliance on either state or federal funding may be related to other institutional istics not controlled for in the analysis. These character-istics, and not the sources of funding, may be the primary influences driving student satisfaction.
Acknowledgements
I acknowledge financial support from the John and Dora Haynes Foundation and the Mayr Foundation. Jeff Chang and Ching Lim provided invaluable research sup-port. I would like to thank Janet Smith, Thomas Borch-erding, and seminar participants at Claremont McKenna College for comments and suggestions. The usual dis-claimer applies.
References
Alchian, A. (1968). The economic and social impact of free tuition.The New Industrialist Review 5, 42–52. Reprinted in A. AlchianEconomic Forces at work. Indianapolis: The Liberty Press, pp. 203–226.
Anderson, M. (1992). Imposters in the temple. New York: Simon and Schuster.
Clotfelter, C. C. (1996).Buying the best: cost escalation in elite higher education.Princeton: Princeton University Press. Friedman, M., & Friedman, R. (1979). Free to choose. New
York: Avon Books.
Lindsay, C. M. (1976). A theory of government enterprise. Journal of Political Economy,84, 1061–1077.
McPherson, M. S., Winston, G. C., & Schapiro, M. O. (1993). Paying the piper: productivity, incentives & financing in U.S. higher education. Ann Arbor: University of Michi-gan Press.
Peltzman, S. (1973). The effect of government subsidies-in-kind on private expenditures: The case of higher education. Jour-nal of Political Economy,81, 1–27.
Sav, T. (1987). Institutional structure, finance, and race in higher education: public-private sectoral differences.Public Choice,51, 257–264.
Sisk, D. (1981). A theory of government enterprise: university Ph.D. production.Public Choice,37, 357–363.
Smith, A. (1776).An inquiry into the nature and causes of the wealth of nations.New York: Oxford University Press 1993 World’s Classics Edition.
Stubblebine, W. C. (1965). Institutional elements in the financ-ing of education.Southern Economic Journal,32, 15–34. The Student Advantage Guide to The 310 Best Colleges(1997).
New York: The Princeton Review.
West, E. G. (1964). Private versus public education: A classical economic dispute.Journal of Political Economy,72, 465– 475.