FINANCIAL PERFORMANCE OF SUGARCANE COOPERATIVES
IN EAST JAVA
Kinerj a Finansial Koperasi T ebu di Jawa T imur
Ening Ariningsih
Indonesian Center for Agricultural Socio Economic and Policy Studies Jl. A. Yani 70, Bogor 16161
E-mail: [email protected]
Naskah diterima: 29 Januari 2014 Direvisi: 17 April 2014 Disetujui terbit: 20 Mei 2014
ABSTRAK
Jawa Timur merupakan produsen terbesar tebu di Indonesia di mana koperasi berperan penting dalam agribisnis tebu. Studi ini bertujuan untuk menganalisis kinerja finansial koperasi tebu di Jawa Timur. Rasio finansial (profitabilitas, likuiditas, dan solvensi) digunakan untuk menganalisis data panel koperasi tebu selama periode 2008–2011. Hasil studi menunjukkan bahwa secara umum profitabilitas koperasi tebu di Jawa Timur rendah dan memiliki aktiva yang likuid namun tidak solven. Akan tetapi, terdapatnya koperasi tebu yang mempunyai SHU yang relatif tinggi menunjukkan pertanda baik akan perkembangan koperasi tebu di Jawa Timur. Berdasarkan hasil studi, rekomendasi kebijakan yang disarankan untuk membantu dan memperbaiki kinerja koperasi tebu di Jawa Timur adalah (1) memperbaiki manajemen koperasi dan penerapan prinsip-prinsip koperasi, (2) membedakan secara signifikan pelayanan kepada anggota dan bukan anggota, (3) memperkuat modal yang bersumber dari anggota, dan (4) pemerintah tetap memberikan fasilitasi dan subsidi untuk mendukung pengembangan koperasi, dengan tetap mengarahkan koperasi menuju kemandirian.
Kata kunci: rasio, finansial, kinerja, koperasi, tebu, Jawa Timur
ABSTRACT
East Java is the largest sugarcane producing center in Indonesia where cooperatives have an important role on sugarcane agribusiness. This study aimed to analyze the financial performance of sugarcane cooperatives in East Java. Financial ratios related to profitability, liquidity and solvency coupled with a set of panel data over the period 2008-2011 were used in this study. The results of the study indicated that the majority of sugarcane cooperatives in East Java, both KPTRs and KUDs, had a relatively low profitability, and were liquid but not solvent. However, the existence of some sugarcane cooperatives in East Java that had relatively a high net surplus indicated a good sign on their development. Based on the results of this study, the suggestion to improve further implementation strategies of sugarcane cooperatives in East Java are as follows: (1) improvement of cooperative management and implementation of cooperative principles, (2) significant differentiation of services upon cooperative membership, (3) strengthening the members’ capital share, and (4) government support in terms of facility and subsidy as well as supporting their autonomy.
Keywords: ratio, financial, performance, sugarcane, cooperative, East Java
INTRODUCTION
East Java is the largest sugarcane producing center in Indonesia. In 2011, it was estimated that East Java Province contributed around 44.2 percent of sugarcane area and 41.4 percent of sugarcane production (Directorate General of Estate Crops, 2012). Around 85.5 percent of total sugarcane area in the province was cultivated by farmers which, in general,
tended to be less profitable for the development of sugarcane farming.
Sugar development in East Java, and in Indonesia in general, faces some problems. One of the major problems faced by this industry is inefficiency at both farmer level (on-farm) and sugar mill level (Sutrisno, 2009). According to Suyono (2008), problems at sugarcane farmer level are very complex. Small capital, unavailability of fertilizer at proper time, incapability in mastering post-harvest technology, lack of access to farming-related resources, weak bargaining position, and limited landholding are amongst the problems that the sugarcane farmers face. Study of Lestyani et al. (2012) showed that high land rent, large amount of capital needed, and long money revolving-time made farmers reluctant to plant sugarcane. Therefore, sugarcane farmers’ empowerment should be conducted. In this matter, enhancing the role of cooperatives is one effort that can be carried out (Hanani et al., 2012). These cooperatives which serve as farmer institutional organizations have developed and been growing in rural area.
The functions and roles of the cooperatives in sugarcane agribusiness are to: (1) empower sugarcane farmers through activities in sugarcane farming (on-farm); (2) play an active role in helping farmers/members to improve the quality of sugarcane farming; (3) facilitate farmers/ members with training, capital (credits/loans), procurement of inputs, machinery services, and other things needed in supporting sugarcane farming; and (4) act as a bridge between farmers, sugar factories, and the government (Ariningsih, 2013a). According to Hanani et al. (2012), sugarcane productivity is strongly affected by the role of cooperatives and the most outstanding role of the cooperatives is their backward linkage in the provision of production inputs.
Haryanto (2011) stated that the role of cooperative needs to be maximized by empowering the cooperative as a micro financial institution to rural areas. Cooperative also needs to take position as a professional organization which not merely manage cooperative exclusively, but also develop entrepreneurship that is channelled to the community. With this role, it is expected that the cooperative becomes community’s choice as a partner in their business. Furthermore, cooperatives are expected to share their significant part in efforts to reduce
unemployment and to alleviate poverty (Tambunan and Anik, 2009).
Asmara and Nurholifah (2010) revealed that sugarcane farmers join the cooperatives for credit of capital for their sugarcane farms, provision of production inputs, and better bargaining position with sugar mills. Wibowo (2013) found that farmers with credit had higher income than farmers without credit. Furthermore, Wijayanti (2014) found out that sugarcane farmers with both acceleration credit and KKPE (Kredit Ketahanan Pangan dan Energi = Credit for Food and Energy Security) had higher income than sugarcane farmers with only acceleration credit or KKPE alone. Yekti and Sulastyah (2009) found that majority of the farmers used credit for supporting their current business; only some that used credit for supporting new business. On the contrary, different conclusion reported by Dalilah (2013), that agricultural credit in KKPE program had not given significant implication on sugarcane farmers’ income in Malang Regency.
In spite of all good expectations from cooperatives; however, the performance of cooperatives in supporting sugarcane agribusiness is still not as expected. Many cooperatives do not run well and many others are not active anymore. The quality of the officers and management still becomes major constraints (Hanani et al., 2012). According to Saiman (Republika online, 01 Maret 2012), there are five factors that affect cooperative performance. The first factor is the quality of human resources (HR) of members, officers, manager and board of auditors. The other factors are lack of capital, lack of information technology, lack of global orientation, and lack of willingness to merge or consolidate.
To be noted, farmer-members of a cooperative are also consumers of the respective cooperative.
The sugarcane cooperatives in East Java Province should have healthy financial condition to be able to play their role as economic institutions and serve their farmer-members well. They should also have economic incentive to attract their farmer-members to participate because economic benefit has significant positive influence on member participation (Afriza, 2010; Kurniawan and Mahri, 2011). Based on the above explanation, the specific objective of the study was to analyze financial performance of sugarcane cooperatives in East Java Province.
METHODOLOGY
Location of the Study
East Java Province was purposively chosen as study site because it is the largest sugarcane producing center in Indonesia. In this province, cooperatives have important roles in sugarcane agribusiness. Unfortunately, data on the number and distribution of sugarcane cooperatives is not available.
Sampling Procedure
In this study, a sugarcane cooperative is defined as a cooperative with sugarcane agribusiness, either as its single business unit or one of its business units. Since there was no data on the number and distribution of the cooperatives
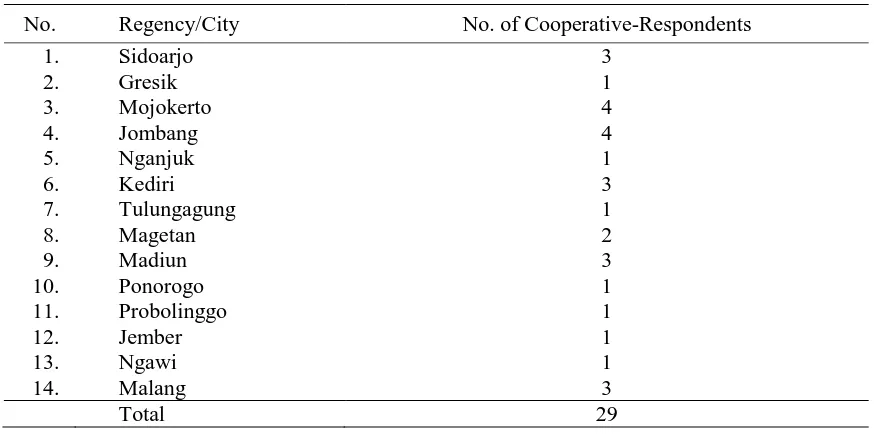
engaged in sugarcane agribusiness, this study focused on primary sugarcane cooperatives (both KUDs [Koperasi Unit Desa = Village Cooperative Unit] and KPTRs [Koperasi Petani Tebu Rakyat = People Sugarcane Farmer Cooperative]) that were members of KUB (Koperasi Usaha Bersama = Joint Venture Cooperative) Rosan Kencana, the biggest secondary sugarcane cooperative in East Java Province. The 46 primary sugarcane cooperative-members of KUB Rosan Kencana spread out in 22 regencies in East Java Provinces. Financial data of these cooperatives was collected from their Annual Report 2008-2011. Out of 46 primary sugarcane cooperative-members, data from 31 cooperatives were collected. However, data from two primary sugarcane cooperatives were dropped; one cooperative gave erroneous data while the other had very incomplete data. Data collection was held during October-November 2012. Distribution of the sugarcane cooperative-respondents is presented in Table 1.
Analytical Tools
Profitability, liquidity and solvency (or leverage) analyses, which are the most frequent tools used for financial ratio analysis, were used in the financial analysis of sugarcane cooperatives. Data from 29 primary sugarcane cooperatives during 2008-2011 were analyzed in this analysis. All the financial data were deflated to 2008 constant Indonesian rupiah using the Consumer Price Index of East Java.
Table 1. Distribution of Sugarcane Cooperative-Respondents in East Java, 2012
No. Regency/City No. of Cooperative-Respondents
1. Sidoarjo 3
2. Gresik 1
3. Mojokerto 4
4. Jombang 4
5. Nganjuk 1
6. Kediri 3
7. Tulungagung 1
8. Magetan 2
9. Madiun 3
10. Ponorogo 1
11. Probolinggo 1
12. Jember 1
13. Ngawi 1
14. Malang 3
Profitability Analysis
Profitability is the ability to produce over a certain time period (Olson, 2010). Net income (or in this case net surplus), return on assets (ROA), the rate of return to equity (ROE) are on the short list of the main measures of profitability. Net surplus is an absolute measure, while ROA and ROE are relative measures that provide two different views of profitability. In this study, net surplus, return on equity, and return on assets were used to assess the profitability of the cooperatives.
Net surplus (NS). A cooperative's net surplus is the difference between sales or total revenuer (TR) and total expenses (TE) (Castillo and Manila, 2007).
NS = TR - TE…………...………. (1)
In general, the higher the net surplus, the better, with some exceptions, is the performance of the cooperatives.
Return on assets (ROA). This ratio measures the overall effectiveness of the management in generating profits with its available assets. It is computed by dividing the net surplus (NS) by the total assets (TA) of the cooperative (Castillo and Manila, 2007).
ROA = NS/TA x 100% …….…….….. (2)
The higher the ROA, cooperative would be better. It means that the cooperative is doing a good job using its assets to generate profit.
Return on equity (ROE). ROE is another measure of the cooperative’s effectiveness. It measures the returns earned on the members’ investments in the cooperative. It is computed by dividing the net surplus (NS) by the members’ equity (ME) on share capital (Castillo and Manila, 2007).
ROE = NS/ME x 100% ………. (3)
In general, the higher the ROE, the better- off are the members because it means that the cooperative is doing a good job using its members’ equity.
Liquidity Analysis
Liquidity is the ability of a firm to meet its financial obligations in the next 12 months. Liquidity is measured by the working capital and the current ratio. Due to data limitations, this study only used current ratio as a measure of liquidity.
Current ratio (CR). Current ratio is a measure of the cooperative ability to repay its current debt. It compares the assets that will turn into cash within a year with the liabilities that must be settled within a year. It is computed by dividing current assets (CA) by current liabilities (CL) (Castillo and Manila, 2007).
CR = CA/CL....………….……..……... (4)
Generally, the higher the liquidity ratio, the higher is the margin of safety that the cooperative possesses to meet its current liabilities. Low value of current ratio (value less than 1) indicates that a cooperative may have a difficulty to meet its current obligations. Liquidity ratio greater than 1 indicates that the cooperative is in good financial health and it is less likely to fall into financial difficulties. The ideal current ratio is 2. It is a comfortable financial position for most enterprises.
Solvency Analysis
Solvency is the ability to pay all debts if assets were to be sold at a certain point in time. In this study, debt-to-asset ratio and debt-to-equity ratio were used as measures of solvency of the sugarcane cooperatives.
equity ratio (DTER). Debt-to-equity ratio measures the ratio of long-term debt to members’ equity. It is computed by dividing the total liabilities (TL) by members’ equity (ME) (Ready Ratios, 2012a).
DTER = TL/ME...………….. (5)
Optimal debt-to-equity ratio is considered to be about 1, i.e., liabilities = members’ equity, and for most firms the maximum acceptable debt-to-equity ratio is 1.5-2 and less. For cooperatives, the debt-to-equity ratio that is much more than 2is not acceptable. In general, a high debt-to-equity ratio indicates that a cooperative may not be able to generate enough cash to satisfy its debt obligations. However, a low debt-to-equity ratio may also indicate that a cooperative is not taking advantage of the increased profit that financial leverage may bring.
DTAR = TL/TA….……….. (6)
The optimal debt ratio is determined by the same proportion of total liabilities and members’ equity as a debt-to-equity ratio (debt-to asset ratio equals to 0.5). If the ratio is less than 0.5, most of the firm assets are financed through members’ equity. If the ratio is greater than 0.5, most of the firm assets are financed through debt. Maximum normal value is 0.6-0.7 (Ready Ratios, 2012b).
RESULTS AND DISCUSSION
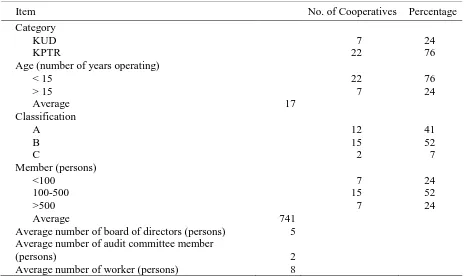
Characteristics of Sugarcane Cooperative-Respondents
Table 2 presents the general characteristics of the 29 primary sugarcane cooperative-respondents in East Java. Most of the sugarcane cooperatives interviewed were categorized as KPTR 76 percent which focused on sugarcane-related business activities. These activities included distribution of loans (for sugarcane seedlings, fertilizers, farming costs, harvesting and transporting) and subsidized fertilizer, transportation service, tractor service, sugar marketing (through auction), saving and borrowing, and other sugarcane related activities. The rest 24 percent of the sugarcane
cooperative-respondents were categorized as KUD, in which sugarcane-related business became one of their business units. Some other business units that KUDs engaged were rice milling unit, poultry, livestock, dairy, electricity payment, gas station, and others. The activities for some reasons might be different.
Age (based on years of operation period) of the cooperative-respondents was highly related to the category of cooperatives. All the KUDs were more than 15 years old, while all the KPTRs were less than 15 years. The oldest KUD was established in 1975, while the youngest in 1989. The Inpres (Presidential Instruction) No. 9/1975 on People Sugarcane Intensification (Tebu
Rakyat Intensifikasi/TRI) program was declared.
This regulated sugarcane farming in wetland as well as in dry land. The objectives of TRI program were to increase sugar production in order to meet sugar domestic needs and to improve farmers’ income through an increase in productivity. Through this program, the KUDs were given some privileges by the government, which supported the development of the KUDs. However, this program led to some problems both on-farm and off-farm, which led to controversy. As a result, this program was revoked and replaced by the Inpres No. 5/1998 which allowed the farmers to cultivate any crops
Table 2. General Characteristics of Sugarcane Cooperatives in East Java, 2011
Item No. of Cooperatives Percentage
Category
KUD 7 24
KPTR 22 76
Age (number of years operating)
< 15 22 76
> 15 7 24
Average 17
Classification
A 12 41
B 15 52
C 2 7
Member (persons)
<100 7 24
100-500 15 52
>500 7 24
Average 741
Average number of board of directors (persons) 5 Average number of audit committee member
(persons) 2
they want. The main consideration why the TRI program was revoked was due to its failure to make the farmers become self-reliant. The program even made the farmers become more dependent on the government.
The majority of KPTRs were established in 1998/1999, after the revocation of the Inpres No. 9/1975 on the TRI program. The revocation had made many KUDs collapse and even out of business because the preferential treatments from the government had been removed. As a result, sugarcane farmers could not obtain services from the cooperatives, and this was becoming a strong motivation to establish new cooperatives focusing on sugarcane business in the form of KPTR.
More than half (52%) of sugarcane cooperative-respondents were classified as good (B); 41 percent was classified as very good (A); and the remaining was classified as fair (C). This classification was set by the Ministry of Cooperatives and Small and Medium Enterprises based on the evaluation upon cooperatives’ performance in six aspects of quality cooperatives (active business entity, healthier business performance, member cohesiveness and participation, member-service orientation, community services, and contribution to regional development). Based on the Ministry Cooperatives and Small and Medium Enterprises Regulation No. 22/PER/M.KUKM/IV/2007, the evaluation was conducted by professional and competent independent institutions.
The size of membership of the sugarcane cooperative-respondents ranged from 65 to 5,602 persons over the period 2008-2011. Majority of the cooperative-respondents indicated a positive but slight growth in their membership size. Some others, however, had shown a zero or even negative growth. It seems that the growth in membership size was not so important for these cooperatives. It may happen because they also provided services for non-members, generally on the policies that favor members. The fact that the sugarcane cooperatives in East Java provide services also for non-members was criticized by Nugroho (2011) as inconsistency in the implementation of the cooperative principle related to member and non-member services. According to him, the principle is one of the unique value propositions of cooperative that should be tightly held.
Disregarding the criticism, it is more important to know why there are many farmers that are still reluctant to become member of cooperative even though they were able to access cooperative services. Field findings had shown that some of them thought that cooperatives will charge them with many costs of membership or services, and that may reduce their revenues. Some of them thought that become cooperative members will give them complexity, while some others thought that being cooperative members will make them lose their freedom to the market of their products. For these reasons, the cooperatives need to be able to prove and to convince the farmers about the benefits that the farmers can obtain by becoming members. For some cases where the cooperatives require a minimum landholding size of the sugarcane related to cooperative services, the farmers cannot become members of the cooperatives because of they cannot fulfill the requirement.
The size of membership was also highly associated with the category of sugarcane cooperatives. All cooperatives with more than 500 members were KUDs (24 percent of sugarcane cooperative-respondents), whereas the rest with less than 500 members were the KPTRs. Some cooperatives (24 percent) even had less than 100 members. However, for cooperatives with large membership size, it is difficult to involve all members in all cooperatives’ activities (including training) due to coordination constraints and some other limitations. This resulted in a larger proportion of inactive members for large membership-sized cooperatives. These sugarcane farmers handed over all the affairs of the cooperative to the leader of farmers’ groups so that they did not know the cooperative policies (Asmara and Nurholifah, 2010). This also made the farmers have less sense of belonging to the cooperative. It was found that in some cases the farmer-members were not aware upon their membership status in the cooperative. According to Nugroho (2011), this could be due to members’ lack of knowledge and commitment in joining cooperative business. Considering that membership participation and governance are clear indicators of a long-term cooperative business success, as well as to meet social objectives (Mellor, 2009), active membership participation should become a priority consideration for all cooperatives.
Board of directors was elected every three or five years. The members always participated in board selection which was usually held during general assembly. According to Mellor (2009), active member participation in selection of the board is one of the most basic measures of democratization. Moreover, competition among the members to serve as board of directors, as demonstrated by more than one candidate indicates a healthy cooperative. However, some of cooperative-respondents elected board of directors through acclamation because the members convinced that they were the right persons to hold that position. In some cases, since by the law allows for the directors to be re-elected in the next period, the members kept the directors in their position because they were seen as broadly representative and doing a good job. Generally, the persons chosen as board of directors were charismatic and considerably rich.
Auditing for the cooperative-respondents was carried out annually, usually by an internal audit committee consisted of one up to three members (on average, two members of audit committee). Only two cooperative-respondents had their annual report audited by a registered independent auditor. Selection of the internal audit committee was usually done at the same time with the election of the board of directors at the general assembly. Selection was generally done by the members. The selection of independent auditor, however, was conducted by the board of directors without the involvement of the members.
For this matter, Mellor (2009) stated that poor reputation of many cooperatives in the developing countries arises due to lack of an outside auditor. Furthermore, given that the board members may have special interests, membership involvement in choosing the outside auditor is desirable or may even essential for the success of cooperative. The members can select the auditors at the annual meeting and they should be able to deliver their report orally, as well as in writing.
The sugarcane cooperative-respondents had workers that ranged from 1 to 51, with average of eight workers. To be efficient, the cooperatives adjusted number of workers they employed based on the size and number of activities they had. However, from this study it was found that the majority of workers (approximately 66 percent of the cooperative-respondents) were underpaid.
This means that their monthly payment on the average was lower than the regional minimum wage set by the government for each corresponding regency/city.
Financial Condition of Sugarcane Cooperative-Respondents
Table 3 and Figure 1 present the financial condition of the primary sugarcane cooperative-respondents in East Java. Assets (current assets and non-current assets), liabilities (current liabilities and non-current liabilities), and members’ equity of the sugarcane cooperative-respondents were the subject of analysis. These financial characteristics were also being compared between the low and the high-performance group in which all the 29 sugarcane cooperative-respondents were divided into two groups based on their net surplus. Sugarcane cooperatives with average net surplus of less than IDR83 million during the period 2008-2011 were classified as low-performance sugarcane cooperatives (15 sugarcane cooperatives), whereas the sugarcane cooperatives with average of IDR83 million or more net surplus were classified as high-performance sugarcane cooperatives (14 sugarcane cooperatives).
Total assets of the high-performance sugarcane cooperatives were almost twice as much as those with low-performance. However, their total liabilities were also almost twice as much as those with the low-performance. Similarly, members’ equity of the high-performance sugarcane cooperatives was approximately twice and a half as much as those with low-performance.
Table 3. Financial Condition of the Primary Sugarcane Cooperative-Respondents by Level of Performance, East Java, 2008-2011 (IDR million)
Description Low Performance
a High Performancea Total
Averageb Growthb Averageb Growthb Averageb Growthb a. Assets
Current assetsc 6,369 6.17 12,181 3.85 9,175 4.00
(96) (93) (94)
Non-current assetsc 274 8.29 956 4.09 603 4.99
(4) (7) (6)
Total assets 6,644 6.25 13,137 3.74 9,778 4.01
b. Liabilities and Members’ Equity
Current liabilitiesd 3,817 14.24 8,874 7.25 6,258 7.69
(62) (74) (70)
Non-current liabilitiesd 2,383 -3.90 3,088 -5.47 2,723 -4.77
(38) (26) (30)
Total liabilitiese 6,201 6.08 11,963 3.67 8,982 3.81
(93) (919) (92)
Members’equitye 443 8.67 1,174 5.94 796 6.71
(7) (9) (8)
Total liabilities and members’ equity
(= Total assets) 6,643 6.25 13,137 3.74 9,778 4.01
a
Low performance cooperatives had net surplus less than IDR83 million; high performance cooperatives with the net surplus higher than IDR83 million.
b
During 2008-2011 period; growth in %/year
c
Figures in parentheses are percentage of total assets
d
Figures in parentheses are percentage of total liabilities
e
Figures in parentheses are percentage of total liabilities and members’ equity
Note: CA = Current assets; NCA = Non-current assets; CL = Current liabilities; NCL = Non-current liabilities; and EQUI = Members’ equity; Low = Low performance group; High = High performance group; and All = All cooperative-respondents (Source of basic data: Table 3)
Except for non-current liabilities, all other financial indicators show positive growth over the period 2008-2011, ensuring the sustainability of cooperatives in general. However, total assets of 10 out of 29 cooperative-respondents tend to decline during the study period, indicating unhealthy cooperatives’ condition. Moreover, eight cooperative-respondents had shown a negative growth in members’ equity, suggesting a worrisome sign, especially for one with consistent negative growth during the study period. Except for members’ equity, the growth rates of all other financial indicators of the low-performance sugarcane cooperatives were higher than those of the high-performance sugarcane cooperatives.
Financial Analysis of Sugarcane Cooperatives in East Java
Tables 4 to 6 and Appendices 1 to 3 present the results of financial analysis of the sugarcane cooperative-respondents in East Java over the study period of 2008-2011. Profitability ratios (return on equity and return on assets), liquidity ratio (current ratio), and solvency or leverage ratios (debt-to-equity ratio and debt-to-assets ratio) are the financial ratio used in this study.
Profitability ratio measures the success of a cooperative in earning a net return on its
operation and show a cooperative’s overall efficiency and performance. Cooperatives must operate profitably, although their definition of profitable might differ from an IOF’s. Cooperatives are generally not profit-oriented, but are more concerned towards serving member-owners. In order to serve their members well they could charge lower price for the inputs and other services they provide and give higher price for the outputs. As a result, net surplus generated by the cooperatives might be relatively low. However, since profit is an important objective of a cooperative, poor performance of cooperative indicates a basic failure that probably might resulted in the cooperative’s bankruptcy (Chesnick, 2000).
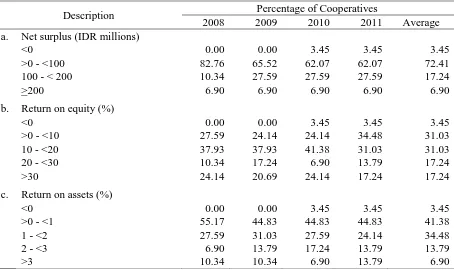
As shown in the Table 4 and Appendix 1 there was one cooperative that incurred loss in 2010 and 2011, whereas all other cooperative-respondents had a positive net surplus. Most of the cooperative-respondents fell under the net surplus bracket of less than IDR100 million, approximately 72 percent of total cooperative-respondents. Meanwhile, the remaining 24 percent of the cooperative-respondents were able to generate a net surplus of more than IDR100 and 6 percent of them were able to generate a net surplus of more than IDR200 million. The low net surplus generated by the majority of sugarcane cooperatives could be a sign of
Table 4. Profitability Ratios of Sugarcane Cooperative-Respondents, East Java, 2008-2011
Description Percentage of Cooperatives
2008 2009 2010 2011 Average
a. Net surplus (IDR millions)
<0 0.00 0.00 3.45 3.45 3.45
>0 - <100 82.76 65.52 62.07 62.07 72.41
100 - < 200 10.34 27.59 27.59 27.59 17.24
>200 6.90 6.90 6.90 6.90 6.90
b. Return on equity (%)
<0 0.00 0.00 3.45 3.45 3.45
>0 - <10 27.59 24.14 24.14 34.48 31.03
10 - <20 37.93 37.93 41.38 31.03 31.03
20 - <30 10.34 17.24 6.90 13.79 17.24
>30 24.14 20.69 24.14 17.24 17.24
c. Return on assets (%)
<0 0.00 0.00 3.45 3.45 3.45
>0 - <1 55.17 44.83 44.83 44.83 41.38
1 - <2 27.59 31.03 27.59 24.14 34.48
2 - <3 6.90 13.79 17.24 13.79 13.79
inefficiency in management and operational costs, and could also caused by the high proportion of liabilities relative to members’ equity as in the case of dairy cooperatives in East Java Province (Ismanto, 2005). High proportion of liabilities would reduce net surplus because some of cooperative’s income was allocated for the installment payment. This confirmed with the study of Ariningsih (2013b) that members’ equity was an important factor that may affect significantly upon the net surplus of sugarcane cooperatives.
The decrease in the percentage of cooperative-respondents which fell under the net surplus bracket of less than IDR100 million, while the increase in percentage of cooperative-respondents which fell under the net surplus bracket of IDR100-IDR200 million during the period 2008-2011 indicated that in general there was an increase in the net surplus generated by the cooperative-respondents. And this was a good sign for the development of cooperatives.
Negative net surplus generated by one sugarcane cooperative-respondent in 2010 and 2011 resulted in negative value of return on equity (ROE) and return on assets (ROA) generated by the cooperative in those years. ROE measures the return on the cooperative money members in the cooperative. Approximately 31 percent of the cooperative-respondents fell under the ROE bracket of 0–10 percent, and approximately another 31 percent of the cooperatives fell under ROE bracket of 10–20 percent, which together created a dominant condition on the return upon cooperative money members that had been put in the cooperatives. However, the remaining of 35 percent had ROE ratio higher than 20 percent.
Return on assets ratio measure the efficiency upon which the cooperative manage its investment in assets and using them to generate profit. It measures the amount of profit earned
relative to the cooperatives’ level of investment in the total assets (Harrison and Horngren, 2008). Most of the cooperative-respondents generated ROA less than 2 percent, in which approximately of 76 percent of them fell in the ROA bracket of 0–2 percent, while the remaining 21 percent had ROA ratio of more than 2 percent. This condition indicated low efficiency of the cooperatives to manage their investments on the assets and to use them for generating profit. This finding is similar to the result of study conducted by Tilahun (2007) that the profitability ratio of almost all the primary coffee marketing cooperatives in Dale District, SNNPRS-Southern Ethiopia was so low below the lending interest rate of the borrower, indicating inefficient business performance.
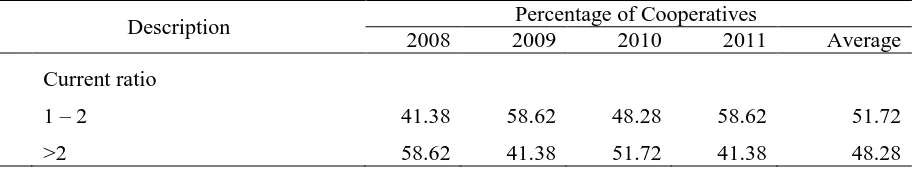
Liquidity ratio measure the ability of cooperative to fulfill short-term commitments with liquid assets. The ratio is the comparison of the assets that can be converted to cash quickly to finance maturing short-term obligation (Chesnick, 2000). As part of liquidity ratio, current ratio is a measure to determine whether or not a cooperative has enough resources to pay its debt over the next 12 months. It may also indicate the cooperative's operating cycle efficiency, the ability of the cooperative to turn its products into cash.
Table 5 and Appendix 2 show that all the sugarcane cooperatives during the period 2008-2011 were liquid. About half of the sugarcane cooperative-respondents fell under the current ratio bracket of 1-2 which indicates that the cooperatives were in a good financial health and they were unlikely to fall into financial difficulties. However, the other half of the cooperatives had current ratio of more than 2 or even higher, which indicates that the cooperatives may not be using their current assets or their short-term financial facilities efficiently. This condition may also indicate some problems in their working capital management.
Table 5. Liquidity Ratio of Sugarcane Cooperative-Respondents, East Java, 2008-2011
Description Percentage of Cooperatives
2008 2009 2010 2011 Average
Current ratio
1 – 2 41.38 58.62 48.28 58.62 51.72
Solvency or leverage ratio measure the extent of cooperative’s total debt burden. It reflects the cooperative’s ability to meet both short and long-term debt obligations (Chesnick, 2000). The higher the ratio, the greater the risk associated with the cooperative's operation. However, a low debt ratio indicates conservative financing with an opportunity to borrow in the future without any significant risk.
Table 6 and Appendix 3 indicate that majority of the sugarcane cooperative-respondents were not solvent. Almost all the assets of sugarcane cooperative-respondents’ were highly financed through debt, this was indicated by the debt-to-assets ratio (DTAR) values of more than 0.5. Moreover, most of the cooperatives (90 percent or more) had DTAR values more than acceptable maximum normal values, i.e., 0.6-0.7. It had shown that the cooperatives were highly dependent on debt to finance their assets. This high DTAR values also indicated that the cooperatives had a great risk associated with their operation.
The debt-to-equity ratio (debt/equity ratio, D/E), also known as financial leverage, is a financial ratio indicating the relative proportion of cooperative’s equity and debt used to finance cooperative's assets. Debt-to-equity ratio is the key of financial ratio and is used as a standard for a determination of cooperative's financial standing. It is also a measure of a cooperative's ability to repay its obligations.
The data indicated that 10 percent or less of the sugarcane cooperative-respondents had debt-to-equity ratio (DTER) of less than 1, whereas the optimal DTER is considered as 1, i.e., liabilities equal equity. This low DTER may indicate that the cooperatives were not taking
advantage of the increased profits that the financial leverage may bring. The data also had shown that only 3 percent or less of the sugarcane cooperative-respondents had maximum acceptable DTER (between 1.5 and 2), whereas more than 90 percent of the sugarcane cooperative-respondents had debt-to-equity ratio of more than 2, which is not acceptable for small and medium firms like the sugarcane cooperatives being analyzed. This high DTER indicates that the cooperatives may not be able to generate enough cash to satisfy their debt obligations.
From the Table 6, for every bracket of DTER, the percentage of cooperatives that fell under the corresponding bracket was similar from time to time. There was a consistent financial standing of the cooperatives. Different with DTER, there was a change in the pattern of DTAR during the period 2008-2011. One of the sugarcane cooperative that had DTAR value slightly higher than 0.7 in 2008 had a reduction in liabilities less than the amount that was able to change its DTER in 2009 and 2010. And this actually made the cooperative healthier. Unfortunately, in 2011 the DTAR fell back under the initial bracket.
CONCLUSIONS AND SUGGESTIONS
Conclusions
In spite of the low profitability of the majority of sugarcane cooperative-respondents in East Java, there were some sugarcane cooperatives that were able to generate relatively high net surplus of more than IDR100 million, i.e., 24 percent of the sugarcane cooperative-respondents. In Table 6. Solvency Ratios of Sugarcane Cooperative-Respondents in East Java, 2008-2011
Description Percentage of Cooperatives
2008 2009 2010 2011 Average a. Debt-to-equity ratio
<1 3.45 3.45 3.45 3.45 3.45
1 - <1.5 0.00 0.00 0.00 0.00 0.00
1.5 – 2 0.00 0.00 0.00 0.00 0.00
>2 96.55 96.55 96.55 96.55 96.55
b. Debt-to-assets ratio
<0.5 3.45 3.45 3.45 3.45 3.45
0.5 - 0.7 0.00 3.45 3.45 0.00 0.00
addition, 35 percent of sugarcane cooperative-respondents had return on equity (ROE) ratio of more than 20 percent and 22 percent of the sugarcane cooperative-respondents had return on assets (ROA) ratio of more than 2 percent. All the sugarcane cooperative-respondents had current ratio of more than 1, which indicated that the cooperatives were liquid. However, solvency analysis had shown that almost all the sugarcane cooperatives were not solvent which meant that the cooperatives did not have enough assets to fulfill their obligation in the long-run. Around 90 percent of the sugarcane cooperative-respondents’ assets had more than the acceptable normal debt-to-assets ratio (DTAR) values (0.6– 0.7), which indicated that the cooperatives were highly dependent on debt to finance their assets. Furthermore, more than 90 percent of the sugarcane cooperative-respondents had debt-to-equity ratio (DTER) values of more than 2, indicating that the cooperatives might not be able to generate enough cash to finance their debt obligations.
Suggestions
Based on the results of this study, what follows are some suggestions for the improvement of implementation strategies on sugarcane cooperatives in East Java:
1) Cooperative management improvement.
Improvement in cooperative management should be carried out to increase cooperative efficiency which leads to better financial performance as well as overall cooperative performance. Therefore, a periodic and continuous training and guidance should be carried out for the cooperatives, with regard to both administrative and financial management. The training and guidance can be facilitated by the government through the Office of Cooperative and Small and Medium Enterprises at the regency, provincial, or national level as well. It may also be facilitated by KUB Rosan Kencana as the secondary cooperative. The cooperative should also to be encouraged to have an external auditor to assure that the cooperative has a good financial management.
It should be noted that the presence of a manager is not enough but what is more important is a good quality of a manager. Therefore, the recruitment of a cooperative manager should be based on professionalism
principles to assure the delivery of service quality to the members. A manager should really understand his roles and functions to support the success of cooperative. Appropriate education and trainings for cooperative managers should be conducted intensively and continuously to increase their understanding on the tasks of cooperative managerial enterprise.
A cooperative with healthy and improved performance will be able to provide a good quality of services that the farmers need while generating considerably high net surplus. This net surplus will be distributed to the farmer-members according to their capital shares and participation in the cooperative’s economic activities based on the principle of net surplus distribution. The distribution of the net surplus should be set in the General Assembly; not merely determined by the Board of Officers. High net surplus will be an incentive for the farmer-members to share their capital and to be actively involved in the cooperative’s economic activities while also be an incentive for farmer non-members to become members of cooperative.
2) Significant cooperative membership
differentiation of services. In order to
promote cooperative membership differentiation of services given by the cooperatives to members and non-members should be taken at a certain level that would give some incentives for the farmers to become members of the cooperatives.
increase their capital share, the cooperatives should be able to convince them the benefits that they will obtain by showing a good performance. However, facilitation from the government, including KKPE is still needed considering the limitation of the members’ equity.
4) Government facilitation. The government has been providing facilities and subsidies, including subsidy for the KKPE interest rate, to support the development of cooperatives, not only for the sugarcane cooperatives, but also for all cooperatives in general. This support is needed and should be continued considering the different characteristic of cooperative than other economic institutions. However, in spite of the facility and subsidy, the cooperatives should also to be directed toward independence.
ACKNOWLEDGEMENT
The author would like to thank to Dr. Isabelita M. Pabuayon, Prof. Dr. Corazon Aragon, Dr. Zenaida M. Sumalde, and Prof. Dr. Mario V. Perilla for their invaluable insights during the research and the Indonesian Agency for Agricultural Research and Development for funding the research.
REFERENCES
Afriza, M. 2010. Pengaruh Kompetensi Pengurus dan Manfaat Ekonomi terhadap Partisipasi Anggota Koperasi (Suatu Kasus pada Koperasi Produsen Tempe Tahu Indonesia (KOPTI) Kota Bandung). Jurnal Pendidikan Ekonomi dan Terapan 5(1): 42-54.
Ariningsih, E. 2013a. Economies of Scale of Sugarcane Cooperatives in East Java Province. Jurnal Agro Ekonomi 31(1): 53-69.
Ariningsih, E. 2013b. Factors Affecting Net Surplus of Sugarcane Cooperatives in East Java Province. Jurnal SEPA 10(1): 132-139.
Asmara, R. and R. Nurholifah. 2010. Analisis Pendapatan dan Faktor-Faktor yang Mempengaruhi Pendapatan Petani Tebu dalam Keanggotaan Suatu Koperasi. Jurnal AGRISE 10(2): 108-120.
Castillo, E.T. and A.C. Manila. 2007. Cavite Farmers Feedmilling and Marketing Cooperative: A Community-Initiated Multi-Millionaire
Cooperative. Agricultural Credit and Cooperatives Institute. Los Baños, Philippines.
Chesnick, D.S. 2000. Financial Management and Ratio Analysis for Cooperative Enterprises. U.S. Department of Agriculture Research Report 175.
Dalilah, I.E. 2013. Implikasi Kredit Pertanian terhadap Pendapatan Petani (Studi Kasus: Program Kredit Ketahanan Pangan dan Energi pada Petani Tebu di Kabupaten Malang). Undergraduate Thesis. Brawijaya University. Malang.
Directorate General of Estate Crops. 2012. Tree Crop Estate Statistics 2009-2011.
Fitriani, Sutarni, and L. Irawati. 2013. Faktor-Faktor yang Mempengaruhi Produksi, Curahan Kerja dan Konsumsi Petani Tebu Rakyat di Propinsi Lampung. Jurnal Ilmiah ESAI 7(1): 1-11.
Hanani, N., Sujarwo, and R. Asmara. 2012. Peran Koperasi dalam Sistem Agribisnis Tebu Rakyat. In B. Krisnamurthi (Ed.). Sugar Economy. PT Gramedia Pustaka Utama. Jakarta.
Harrison, W.T. and C.T. Horngreen. 2008. Financial Accounting. 7th Edn. Pearson Prentice Hall. New Jersey.
Haryanto, R. 2011. Koperasi vs Kemiskinan di Indonesia. Tabloid Inspirasi, 27 September 2011.
http://inspirasitabloid.wordpress.com/2011/09/ 27/koperasi-vs-kemiskinan-di-indonesia/. (5 August 2013).
IAARD. 2007. Prospek dan Arah Pengembangan Agribisnis Tebu. 2nd Edition. Indonesian Agency for Agricultural Research and Development, Ministry of Agriculture. Jakarta.
Ismanto, N. 2005. Stategi Penyehatan Finansial Koperasi Susu Anggota Gabungan Koperasi Susu Indonesia di Jawa Timur. Thesis. Bogor Agricultural University. Bogor.
Kurniawan, H. and J.W. Mahri. 2011. Kualitas Pelayanan, Promosi Ekonomi Anggota, dan Pengaruhnya terhadap Partisipasi Anggota. Jurnal Ekonomi dan Pendidikan 6(1): 10-22.
Lestyani, D., Maria, and S.H. Priyanto. 2012. Keengganan Petani Berusahatani Tebu di Kabupaten Kendal, Jawa Tengah. AGRIC 24(1): 81-90.
Nugroho, A. 2011. Mengurai Belenggu pada Koperasi. Tabloid Inspirasi, 29 Juli 2011. http://inspirasitabloid.wordpress.com/2011/07/ 29/mengurai-belenggu-pada-koperasi/. (5 August 2013).
Olson, K.D. 2010. Economics of Farm Management in a Global Setting. John Wiley and Sons, Inc. The United States of America.
Ready Ratios. 2012a. Debt-to-Equity Ratio. http://www.readyratios.com/reference/profitabi lity/return_on_equity.html. (20 August 2012).
Ready Ratios. 2012b. Debt Ratio. http://www.readyratios.com/reference/debt/deb t_ratio.html. (20 August 2012).
Republika online. 01 Maret 2012. Duh, Kondisi Koperasi Indonesia Disebut Terbelakang. http://www.republika.co.id/berita/nasional/umu
m/12/02/29/m05ksr-duh-kondisi-koperasi-indonesia-disebut-terbelakang. (13 March 2013).
Suprayitno, B. 2007. Kritik Terhadap Koperasi (serta Solusinya) sebagai Media Pendorong Pertumbuhan Usaha Mikro, Kecil, dan Menengah (UMKM). Jurnal Ekonomi dan Pendidikan 4(2): 14-35.
Sutrisno, B. 2009. Analisis Faktor-Faktor yang Mempengaruhi Tingkat Pendapatan Petani Tebu Pabrik Gula Mojo Sragen. Jurnal Ekonomi Manajemen Sumber Daya 10(2): 155-164.
Suyono. 2008. Memberdayakan Petani Tebu Melalui Pengembangan Kapasitas Kelembagaan Koperasi Petani Tebu Rakyat (KPTR) (Studi Kasus di KPTR "Raksa Jaya" Kelurahan Paduraksa Kecamatan Pemalang Kabupaten
Pemalang). Thesis. Bogor Agricultural University. Bogor.
Tambunan, T. and C.M. Anik. 2009. Polemik Mengenai Koperasi: Penyebab Masih Buruknya Kinerja Koperasi di Indonesia. Policy Discussion Paper Series No. 10/08/09. Center for Industry, SME & Business Competition Studies Trisakti University. Jakarta.
Tempo.co. 2009. Petani Jawa Timur Sebagian Besar Petani Gurem. Tempo.co. Tuesday, 24 November, 2009.
http://www.tempo.co/read/news/2009/11/24/05 8210155/Petani-Jawa-Timur-Sebagian-Besar-Petani-Gurem. (13 March 2013).
Tilahun, D. 2007. Performance of Coffee Marketing Co-operatives and Members’ Satisfaction in Dale District: SNNPRS-Southern Africa. Thesis. Haramaya University. Alemaya, Ethiopia.
Wibowo, E. 2013. Pola Kemitraan antara Petani Tebu Rakyat Kredit (TRK) dan Mandiri (TRM) dengan Pabrik Gula Modjopanggoong Tulungagung. Jurnal Manajemen Agribisnis 13(1): 1-12.
Wijayanti, N. 2014. Pengaruh Pengambilan Kredit terhadap Pendapatan Usahatani Tebu di Koperasi Sido Makmur Kecamatan Pakem Kabupaten Sleman. Undergraduate Thesis. Gadjah Mada University. Yogyakarta.
APPENDICES
Appendix 1. Profitability Ratios of Sugarcane Cooperative-Respondents, East Java, 2008-2011
Description Actual Average Value
2008 2009 2010 2011 Average
a. Net surplus (IDR millions)
<0 - - -128.31 -60.56 -1.19
>0 - <100 56.22 59.38 53.04 58.11 64.81
100 - < 200 114.66 122.78 123.28 136.46 118.9
> 200 466.86 745.37 469.18 510.83 525.83
b. Return on equity (%)
<0 - - -46.32 -26.71 -14.26
>0 - <10 7.23 6.40 5.63 5.95 7.12
10 - <20 14.73 14.52 13.89 13.44 15.17
20 - <30 25.19 26.73 21.57 23.49 23.07
>30 39.05 47.36 36.03 39.31 40.53
c. Return on assets (%)
<0 - - -1.29 -0.61 -0.03
>0 - <1 0.58 0.62 0.55 0.54 0.58
1 - <2 1.31 1.33 1.43 1.24 1.53
2 - <3 2.05 2.2 2.55 2.37 2.25
>3 3.64 3.98 5.98 3.85 4.52
Appendix 2. Liquidity Ratio of Sugarcane Cooperative-Respondents, East Java, 2008-2011
Description Actual Average Value
2008 2009 2010 2011 Average
Current ratio
1 - 2 1.26 1.42 1.27 1.36 1.34
>2 9.29 4.97 11.49 6.95 7.38
Appendix 3. Solvency Ratios of Sugarcane Cooperative-Respondents in East Java, 2008-2011
Description Actual Average Value
2008 2009 2010 2011 Average
a. Debt-to-equity ratio (DTER)
<1 0.95 0.91 0.89 0.96 0.93
1 - <1.5 - - - - -
1.5 - 2 - - - - -
>2 21.93 18.96 16.77 15.29 17.56
b. Debt-to-assets ratio (DTAR)
<0.5 0.49 0.48 0.47 0.49 0.48
0.5 - 0.7 - 0.70 0.67 - -