Full Terms & Conditions of access and use can be found at
http://www.tandfonline.com/action/journalInformation?journalCode=cbie20
Download by: [Universitas Maritim Raja Ali Haji] Date: 17 January 2016, At: 23:58
Bulletin of Indonesian Economic Studies
ISSN: 0007-4918 (Print) 1472-7234 (Online) Journal homepage: http://www.tandfonline.com/loi/cbie20
Survey of recent developments
B. Raksaka Mahi & Suahasil Nazara
To cite this article: B. Raksaka Mahi & Suahasil Nazara (2012) Survey of recent developments, Bulletin of Indonesian Economic Studies, 48:1, 7-31, DOI: 10.1080/00074918.2012.654482 To link to this article: http://dx.doi.org/10.1080/00074918.2012.654482
Published online: 14 Mar 2012.
Submit your article to this journal
Article views: 374
View related articles
ISSN 0007-4918 print/ISSN 1472-7234 online/12/010007-25 © 2012 Indonesia Project ANU http://dx.doi.org/10.1080/00074918.2012.654482
SURVEY OF RECENT DEVELOPMENTS
B. Raksaka Mahi and Suahasil Nazara*
University of Indonesia, Jakarta
SUMMARY
Despite a turbulent global economy and expectations that declining exports would cause an economic slowdown, the Indonesian economy grew at 6.5% in 2011. The growth rate was supported by high consumer conidence – the result of lower inlation of just 3.8% in 2011. Nevertheless, there were indications that the global inancial crisis had had an impact on Indonesia in the last quarter of 2011, notably on the growth of exports and imports.
In October 2011, President Yudhoyono reshufled his cabinet, citing a need to improve its performance in the administration’s remaining three years. The reshufle showed that the president is still subject to political party pressures. Moreover, the governing coali
-tion of parties remains weak. Agreements made within coali-tion meetings are often broken in the parliament, and coalition parties are frequently distracted by media polemics. The case of former Democrat Party treasurer Nazaruddin, arrested in Colombia following a two-month manhunt, has revealed the magnitude of the money politics surrounding the Democrat Party, whose ratings are declining rapidly.
Indonesia enters 2012 bolstered by the restoration of its investment-grade credit rating. This will expose Indonesia to increased capital lows, since many funds are permitted to invest only in investment-grade countries. The effects on foreign direct investment (FDI) are not automatic, however. These investors evaluate the wider business climate and eco
-nomic governance in making their investment decisions.
The fuel subsidy remains a challenge for Indonesia in 2011/12. Parliament rejected a pro
-posal to limit fuel consumption from April 2012 over doubts about the government’s readi
-ness to handle the policy’s technical complexity. Now the government is again considering a fuel price increase, and will have to seek parliamentary approval soon.
Indonesia faces a long-term problem of regional inequality. After four decades of eco
-nomic development there is little variation in the shares of GDP across regions, but GDP per capita in some regions is slipping behind that of Java. Regional development policy needs to generate more economic activities in the outer islands, and to learn from the mistakes of past initiatives to promote economic development and growth centres in the regions. It is important to align policies with the current decentralisation arrangements.
The government is revising Law 33/2004 on Intergovernmental Finance with the aim of improving some dimensions of decentralisation in Indonesia. Revenue certainty is to be enhanced in part through changes to the general allocation grant (DAU) formula and the disbursement mechanism for intergovernmental transfers. The planned revision has not, however, addressed suficiently the problem of ineficiency in regional spending. In fact, some of the proposed solutions may well create further spending ineficiency.
The main barrier to increased FDI is infrastructure development, whose progress has been slowed by land procurement problems. Unfortunately, Law 2/2012 on Land Procurement for Public Purposes seems unlikely to deliver a clear solution to the key problem of determining fair prices for land compensation. What is needed is the creation of more independent price-setting committees, with suficient capacity to disentangle the problems of land acquisition.
* The authors thank Witri Indriyani and Astrid Dita for data assistance. Special thanks go to Anton H. Gunawan and Abdurrochman for valuable help and advice.
POLITICAL DEVELOPMENTS
In October 2011, President Susilo Bambang Yudhoyono (SBY) reshufled his cabinet. The announcement of the planned reshufle about three weeks earlier provoked much media speculation. While oficially intended to improve the per -formance of the cabinet in the three remaining years of the SBY administration, the reshufle showed that the president is still subject to political party pressures. The number of ministries in the reshufled cabinet remains at 34. There were changes in two ministerial portfolios: the former Ministry of National Education becomes the Ministry of Education and Culture, while the Ministry of Tourism and Culture has become the Ministry of Tourism and Creative Economy.
From an economic policy perspective, a signiicant feature of the reshufle was the transfer of Mari Pangestu from the Ministry of Trade to the Ministry of Tourism and Creative Economy. This suggests a change in President SBY’s trade policy direction. On many occasions, despite the international focus of his busi -ness experience and of his role as chair of the Investment Coordinating Board, the new Minister of Trade, Gita Wirjawan, has stressed the need to improve and strengthen the domestic market.1 His appointment was seen by some as an indi -cation of weakened commitment to free trade, and thus a source of concern that Indonesia will adopt more protectionist trade policies (Hill and Wihardja 2011).
Another notable aspect of the reshufle was the appointment of several new deputy ministers. According to Presidential Regulation 76/2011 – which was enacted speciically for this reshufle – the post of deputy minister, established in 2009 (Patunru and Von Luebke 2010: 13), is a career, irst-echelon position, and hence deputy ministers are not members of the cabinet. There are now 19 deputy ministers, up from 10 previously. The appointment of new deputy ministers began with interviews, and upon leaving the interview sessions the prospective appoin -tees were instructed to announce their appointments to the media. It is widely believed that the respective ministers were not consulted about the appointments. This contrasts with the appointment of other irst-echelon positions such as those of director general and secretary general, over which the relevant minister has considerable inluence.
It is not entirely clear how the expansion of deputy-ministerial positions will affect the quality of policy-making processes. The move poses risks for coordina -tion among top management in the ministries, especially in the two that acquired an additional deputy minister – the Ministry of Finance and the Ministry of Edu -cation and Culture. In these cases, each deputy minister has been tasked with coordinating a group of directorates general within the ministry.
The impact of this cabinet reshufle on the markets was markedly differ -ent from that of the reshufle in 2005, when the curr-ent vice presid-ent, Boedi -ono, was appointed coordinating minister for economic affairs and Sri Mulyani Indrawati was made inance minister. This time, the rupiah gained only 0.2%, to reach Rp 8,801/$, whereas in 2005, because of high expectations that the two new ministers could implement prudent and coherent economic policies, the rupiah appreciated by 7.5%, from around Rp 10,000/$ on 5 December to Rp 9,245/$ on 21 February (Kuncoro and Resosudarmo 2006: 9).
1 For example, on food production (Jakarta Post, 21/10/2011) and on Indonesian manufac
-turing being unready for global competition (Jakarta Post, 18/11/2011).
The reshufle did not result in a signiicant overhaul of the balance of political parties in the cabinet but, rather, ‘served the coalition parties’ political interests’ and missed an opportunity to establish ‘a structure of power based on Indonesia’s reform priorities’ (Wihardja and Kristiadi 2011). Some in the inner circles of the Justice and Prosperity Party (PKS) and the president’s Democrat Party (Partai Demokrat, PD), including their parliamentary members, had been bickering in public for months before the reshufle about issues that were supposedly already settled in coalition meetings.2 PD members accused PKS of disloyalty to the coali -tion because its members continued to criticise the president and the Democrat Party. Yet despite these disagreements, PKS members had been convinced that the president would keep the same number of PKS ministers in the cabinet because the party was part of the coalition. When the president announced the new min -isterial positions, there was one less minister from PKS, but this could have been seen as being balanced by a reduction of one in PD’s ministerial positions. PKS did consider pulling out of the coalition, but evidently pragmatism prevailed.
Nevertheless, the president’s broad-based coalition remains weak. Agreements made within Setgab meetings are not necessarily followed during policy-mak -ing processes in the parliament, and coalition parties often disagree publicly in the media. An example of the coalition’s ineffectiveness in meeting PD’s goals was evident during the selection of the leadership of the Corruption Eradication Commission (KPK). PD’s candidate was neither elected as a KPK leader nor even appointed as a commissioner.
Another test for Setgab is the preparation of a revised election law, likely to be considered by parliament in March. A contentious issue within the coalition is the parliamentary threshold – the minimum percentage of votes that a party needs to be represented in the parliament. The smaller parties are ighting for a 3% thresh -old, while the larger parties, such as Golkar and the Indonesian Democratic Party of Struggle (Partai Demokrasi Indonesia – Perjuangan, PDI–P),want the thresh -old to be set at 5%. PD supports the government’s proposed 4% thresh-old (Jakarta Post, 22/12/2011).
PD does face serious reputational challenges. In addition to the challenges at Setgab, it now faces a potentially damaging corruption scandal. Its former treas -urer, Nazaruddin, is on trial after a two-month manhunt by the KPK, leading to his arrest last August in Colombia. During the investigation and the trial, Naz -aruddin has accused several members of parliament, notably the PD chair, Anas Urbaningrum, of being part of a high-level web of corruption, involving the par -liament and political parties in rent-seeking business activities. Nazaruddin has also alleged that Anas’s appointment as party chair involved vote buying. Dis -cussion about replacing the party chair has mushroomed just at a time when the party is beginning to prepare for the 2014 elections.
2 The coalition meets in the Joint Secretariat or Sekretariat Gabungan (abbreviated as ‘Setgab’). The parties in the coalition, apart from PD and PKS, are the Golkar Party (one of the major post–New Order parties) and three smaller parties, the National Mandate Party (PAN), the United Development Party (PPP) and the National Awakening Party (PKB) .
MACROECONOMIC DEVELOPMENTS Growth
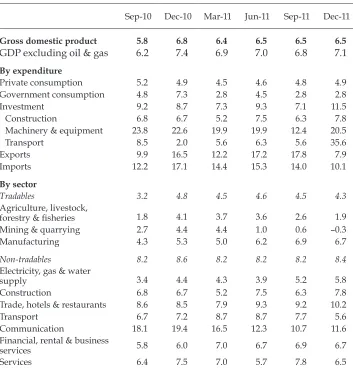
Despite turbulence in the global economy, and contrary to expectations of an eco -nomic slowdown driven by declining export receipts, growth in the fourth quar -ter (Q4) of 2011 remained constant at 6.5% (table 1). In the same quar-ter, export growth fell to 7.9% from the rate of 17.8% recorded in Q3 2011, while import growth slowed to 10.1% from the Q3 igure of 14.0%. Private consumption picked up slightly in Q4 2011 (4.9% compared with 4.8% in Q3), in response to lower inla -tion and rising consumer conidence.3 Growth of investment soared from 7.1% in Q3 to 11.5% in Q4, with strong contributions from the machinery and equipment and transport sub-sectors. Machinery and equipment growth was, however, still lower than a year earlier because of its relatively slow growth in Q3 2011. The high growth in transport was spurred by signiicant growth in foreign transport (49.8%); domestic transport actually contracted by 9.1% (CEIC Asia Database).
The signiicantly lower growth of exports in Q4 2011 was due to a decline in global commodity prices in response to weakening global demand. The fall in commodity prices, together with slower economic growth in Indonesia’s trading partners, resulted in a slowdown in non-oil and gas exports (Danamon 2012: 2). There were, however, signs of rising global commodity prices in January 2012,4 and therefore one can expect Indonesian export growth to recover in the near future. Although the growth of total imports slowed in Q4 2011, over the whole of 2011 merchandise imports increased faster (30.7%) than merchandise exports (29.1%) (Danamon 2012: 2). The increase in imports was led by capital goods and consump -tion goods, driven by vibrant growth in domestic investment and consump-tion.
The growth of government consumption spending in Q4 2011 remained con -stant at 2.8%. The budget deicit for 2011 was 1.3% of GDP, lower than the planned 2.1% (Bisnis Indonesia, 3/1/2012). Low disbursement of budgeted funds continued to cause concern. The Coordinating Minister for Economic Affairs, Hatta Rajasa, himself admitted that government was not yet playing an optimal role in boosting economic growth (Kompas, 19/12/2011).
On the production side, the growth of non-tradables continued to outstrip that of tradables, at almost twice their rate. Over the whole of 2011, all non-tradables sectors except the small utilities (electricity, gas and water supply) sector grew more rapidly than total GDP. The primary sector (agriculture and mining and quarrying) is holding back economic growth, with mining and quarrying record -ing a contraction of 0.3% in Q4 2011. The growth of this sector has been declin-ing
3 Bank Indonesia’s December consumer survey (BI 2012) showed an increase in the con
-sumer conidence index in relation to current economic conditions, and also for the six months ahead, despite an expectation of inlationary pressures over the next two quarters (to March and June 2012, respectively). The consumer conidence index in December 2011 reached its highest level for three years. Bank Indonesia’s November 2011 retail sales sur
-vey (BI 2011) predicted a rise in retail sales in the following three months and six months (to February and May 2012, respectively).
4 After an overall decline in December 2011, the World Bank’s ‘Commodity Markets’ web
-site at <http://go.worldbank.org/4ROCCIEQ50> reports: ‘[i]n January 2012 most com
-modity price indices posted modest gains. Energy prices rose by 2.6%, non-energy prices ... by 2.9%, and food ... by 2.2%; beverages edged up by 1.3%, raw materials rose by 2.5% and metals strengthened by 5.6%, but [fertiliser] fell by 2.7%’.
since Q2 2011. This may be a relection of the fall in international commodity prices. However, it may also relect problems with the implementation of the 2009 Mining Law, which still causes some uncertainty for investors in relation to benchmark pricing and asset divestment.
Thus far Indonesia is weathering the global uncertainty fairly well. The global crisis has had an impact on emerging markets primarily through trade and inan -cial lows. However, Indonesia’s main trading partners, notably China, have not experienced a sharp decline in imports, although China’s year-on-year GDP growth slowed to 8.9% in Q4 2011 from 9.1% in the previous quarter. Most of Indonesia’s exports to China are primary commodities, mainly for domestic con -sumption and investment. China’s exports to the European Union, on the other hand, are primarily manufacturing products with minimal inputs from Indonesia. The indirect trade impact on Indonesia of the EU slowdown via China is therefore likely to be minimal.
TABLE 1 Components of GDP Growth (2000 prices; % year on year)
Sep-10 Dec-10 Mar-11 Jun-11 Sep-11 Dec-11
Gross domestic product 5.8 6.8 6.4 6.5 6.5 6.5
GDP excluding oil & gas 6.2 7.4 6.9 7.0 6.8 7.1 By expenditure
Private consumption 5.2 4.9 4.5 4.6 4.8 4.9
Government consumption 4.8 7.3 2.8 4.5 2.8 2.8
Investment 9.2 8.7 7.3 9.3 7.1 11.5
Construction 6.8 6.7 5.2 7.5 6.3 7.8
Machinery & equipment 23.8 22.6 19.9 19.9 12.4 20.5
Transport 8.5 2.0 5.6 6.3 5.6 35.6
Exports 9.9 16.5 12.2 17.2 17.8 7.9
Imports 12.2 17.1 14.4 15.3 14.0 10.1
By sector
Tradables 3.2 4.8 4.5 4.6 4.5 4.3
Agriculture, livestock,
forestry & isheries 1.8 4.1 3.7 3.6 2.6 1.9
Mining & quarrying 2.7 4.4 4.4 1.0 0.6 –0.3
Manufacturing 4.3 5.3 5.0 6.2 6.9 6.7
Non-tradables 8.2 8.6 8.2 8.2 8.2 8.4
Electricity, gas & water
supply 3.4 4.4 4.3 3.9 5.2 5.8
Construction 6.8 6.7 5.2 7.5 6.3 7.8
Trade, hotels & restaurants 8.6 8.5 7.9 9.3 9.2 10.2
Transport 6.7 7.2 8.7 8.7 7.7 5.6
Communication 18.1 19.4 16.5 12.3 10.7 11.6
Financial, rental & business
services 5.8 6.0 7.0 6.7 6.9 6.7
Services 6.4 7.5 7.0 5.7 7.8 6.5
Source: CEIC Asia Database.
Inlation, monetary and exchange rate policy
Inlationary pressure continued to decrease in the second half of 2011. The year-on-year (December 2010 – December 2011) inlation rate was 3.8%, a marked decline from 7.0% a year earlier, and below the 5±1% inlation target of the central bank and the government.5 Core inlation6 for the whole year was 4.3%, close to that recorded in 2010. There was, however, a notable decline in administered price inlation,7 from 5.4% in 2010 to 2.8% in 2011. Even more signiicant was the decline in volatile goods inlation,8 from 17.7% in 2010 to 3.4% in 2011. Rice is still the highest con -tributor to annual inlation. In 2011, the rice price contributed 0.5% to total inla -tion, a marked difference from the contribution of 1.3% in 2010. In 2011 the Central Statistics Agency (BPS) recorded a rice price increase of 11.2%, just over one-third of the increase in 2010 (30.9%). Since rice is an important commodity affecting poverty, there may be a signiicant decline in the poverty rate in the results of the upcoming 2012 National Socio-Economic Survey (Susenas).
In light of these lower inlationary pressures, Bank Indonesia (BI) cut its policy rate in October and November 2011 (by 25 and 50 basis points, respectively) and again in February 2012 (by 25 basis points) to the current level of 5.75% (igure 1). BI used the momentum of declining inlation throughout 2011, and especially the October delation, for its aggressive November policy rate cut, with an expecta -tion that this would further lower bank lending rates. Such an outcome is by no means certain, however. Commentators have pointed out that other factors such as the cost of funds and minimum reserve requirements have a greater impact than the policy rate on lending rates (Jakarta Post, 17/10/2011).
Despite the declining policy rate, the nominal (6-month) Bank Indonesia Cer -tiicate (SBI) rate remains constant at slightly below 6.1% (igure 1). With declining inlation, the SBI rate continued to increase in real terms through to January 2012. This lowered money growth rates after the monetary easing in August–September 2011. Entering 2012, there is room to lower the SBI rate. This should serve as a disin -centive for banks to place their excess liquidity with the central bank, and also allow BI to reduce the cost of monetary operations. It is important to watch for potential inlationary pressures in 2012, as the government pursues its plan to cut energy sub -sidies. In the month of January 2012 alone inlation was 0.8% (Danamon 2012: 1), and the rice price increased by 3.4% over its December 2011 level.
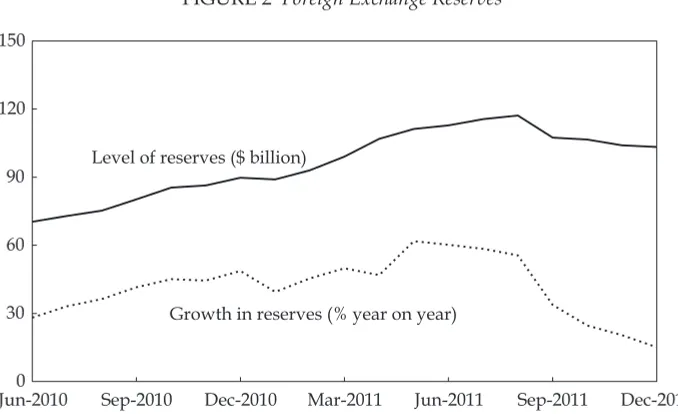
The American and European debt crises contributed to high capital inlow to Indonesia. Many funds that had invested in the US or Europe transferred to Indonesia, and foreign exchange reserves continued to grow until September 2011. High economic growth, increasing real SBI rates and a stable exchange rate made Indonesia an attractive investment destination. Foreign reserves showed a fairly consistent upward trend to August 2011 (igure 2). Pressures due to the
5 This paragraph draws extensively on BPS (2012).
6 Core inlation relects price changes caused by fundamental factors such as demand– supply interaction, expectations, the exchange rate, international commodity prices, and inlation in trading partner countries.
7 Administered price inlation relects changes in government-regulated prices of goods and services such as fuel, electricity and transport.
8 Volatile goods inlation (sometimes called volatile foods inlation) represents the food price changes that are related to harvests, disruptions caused by natural events, or move
-ments in domestic and international food commodity prices.
FIGURE 2 Foreign Exchange Reserves
Jun-20100 Sep-2010 Dec-2010 Mar-2011 Jun-2011 Sep-2011 Dec-2011 30
60 90 120 150
Level of reserves ($ billion)
Growth in reserves (% year on year)
Source: CEIC Asia Database.
FIGURE 1 Monetary Policy and Inlationa
(% p.a.)
Jan-2011 Mar-2011 May-2011 Jul-2011 Sep-2011 Nov-2011 Jan-2012 -2
0 2 4 6 8
0 5 10 15 20 25 30
SBI rate 6 months
BI policy rate
Currency in circulation (rhs)
Real SBI rate CPI inflation
a Currency in circulation is used as the indicator of money supply in preference to base money
because of the distorting impact of occasional changes in banks’ minimum reserve requirements on the effective supply of base money; currency is the major component (about 75%) of base money. The growth rate shown has been smoothed based on the 2-month moving average values to clarify the underlying trend. The real SBI (Bank Indonesia Certiicate) rate is approximated by the nominal rate less the contemporaneous CPI (consumer price index) inlation rate.
Source: CEIC Asia Database.
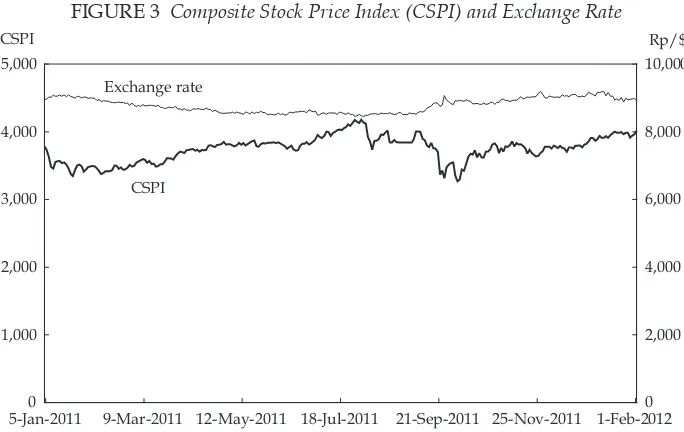
FIGURE 3 Composite Stock Price Index (CSPI) and Exchange Rate
5-Jan-2011 9-Mar-2011 12-May-2011 18-Jul-2011 21-Sep-2011 25-Nov-2011 1-Feb-2012 0
1,000 2,000 3,000 4,000 5,000
0 2,000 4,000 6,000 8,000 10,000
CSPI Rp/$
CSPI Exchange rate
Source: Indonesia Stock Exchange; Paciic Exchange Rate Service.
global crisis can be seen from the decline in the stock market index in the third quarter (igure 3). In September 2011 foreign investors reduced their holdings of Indonesian stocks in response to emerging market risk sentiment. The composite index bottomed at 3,316 on 26 September, a 21% dip from the record high on 1 August. It recovered as Indonesia fared reasonably well through Q3 2011. By 2 February 2012, the composite index had increased 4.1% from its opening level on 3 January.
The rupiah came under pressure in Q3 2011, especially in September, driven primarily by global risk. It depreciated by 2.3% to Rp 8,804/$ in Q3 2011, with high volatility, and by 3.1% to Rp 9,080/$ in Q4 2011 (igure 3). BI conducted aggressive foreign exchange market intervention, especially in August and September, and foreign reserves fell by $10 billion. The depreciation in the second half of 2011 was still in line with movements in other countries’ exchange rates in the region. In early 2012 the rupiah began appreciating again, in January alone by 1.2%.
Anticipating the need for better foreign exchange monitoring, BI has modiied its exchange rate policy. In September 2011, BI issued Bank Indonesia Regulation (Peraturan Bank Indonesia, PBI) 13/20/PBI/2011 on Foreign Exchange Export Proceeds and Foreign Exchange Debt Drawdown. The PBI stipulates that, effec -tive 2 January 2012, all foreign exchange export proceeds should go into foreign exchange banks in Indonesia. Exporters must report their export activities to the banks, which in turn are required to report foreign exchange disbursements to BI. There is neither a minimum length of time to keep the proceeds in Indonesia nor an obligation to convert them into rupiah. This regulation would allow BI to have better records of export-related foreign exchange transactions. One should therefore expect quality improvement in statistics on exports, imports, foreign debt and the balance of payments.
Indonesia’s overall balance of payment lows reversed sharply in Q3 2011, mov -ing from record inlows to outlows. Portfolio capital outlows over August and
September contributed to an overall balance of payments deicit of $4.0 billion in Q3 2011 (World Bank 2011). This was the irst quarterly deicit since the height of the inancial crisis that followed the collapse of Lehman Brothers in Q4 2008. The deicit was driven by a sharp reversal in portfolio lows, as foreign investors sold down their shares and government bonds in the wake of heightened uncertainty surrounding the euro zone debt crisis (World Bank 2011).
Nevertheless, a major positive factor has been the achievement of investment-grade status, with the announcement by Fitch Ratings on 15 December 2011 of a change in Indonesia’s long-term foreign and regional currency rating to BBB–. On 17 January 2012, Moody’s Investors Service also upgraded Indonesia’s for -eign and regional currency rating, to Ba1. Indonesia is now back at investment grade after losing this status in December 1997 during the Asian inancial crisis. It is expected that Standard & Poor’s will eventually follow suit with a status upgrade. Such ratings upgrades should expose Indonesia to many funds that are restricted to investing in investment-grade countries. Portfolio investors and pen -sion funds are likely to be among the irst to respond, but in the medium term the positive effect of the investment-grade status may be outweighed by the impact of the European economic crisis. By contrast, foreign direct investors are likely to attach less weight to the investment grade. Direct investors evaluate a wider range of factors, including the business climate and economic governance, and make their investment decisions accordingly. Corruption problems and weak infrastructure in particular will need serious attention if Indonesia is to beneit from its investment-grade status.
The fuel subsidy
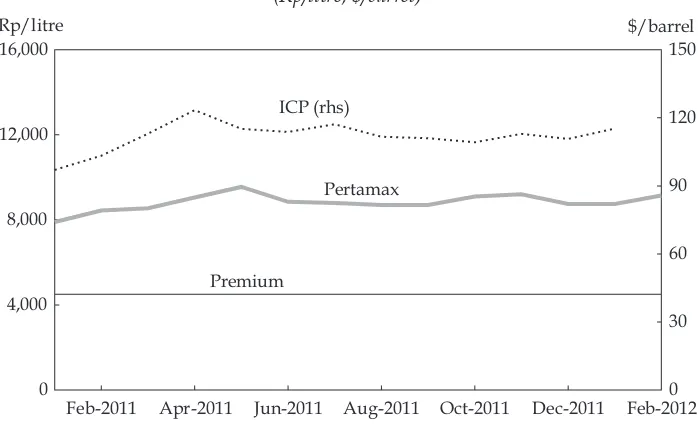
The fuel subsidy is once again a problematic element of the budget. In 2011, actual fuel subsidy expenditure reached Rp 165.2 trillion, or 127.4% of the revised budget target of Rp 129.7 trillion (Manning and Purnagunawan 2011: 317; Antara News, 5/1/2012). The 2011 quota of 40.5 million kilolitres was exceeded by 1.4 million kilolitres, and the $111.55/barrel ICP (Indonesian crude price) average for Janu -ary–December 2011 (igure 4) was well above the revised 2011 budget assump -tion of $95/barrel. There was an internal government discussion about whether to increase the subsidised fuel price in December, but this was not done on the grounds that the budget could sustain the extra subsidy. However, the result is a continuing misallocation of budget funds that would be better used for activities such as building infrastructure and improving social protection programs and their coverage.
In the 2012 budget, the government set the subsidy at Rp 123.6 trillion and the quota at 40 million kilolitres. These targets do not seem feasible if the government wishes to keep the price of Premium fuel at the current level. The budget assumes an oil price of $90/barrel (Manning and Purnagunawan 2011: 317), which is well below the January 2012 ICP of $115.21. Instead of increasing the subsidised price, the government has revived an initiative to end the sale of subsidised fuel to pri -vate cars in Greater Jakarta from April 2012.9 Subsidised fuel would be available only to public transport vehicles, motorcycles and ishing vessels (Jakarta Post, 3/1/2012). The limitation for private cars would in due course be expanded
9 Suryadarma and Sumarto (2011) analyse a similar initiative in 2010.
further to cover all of Java, and later the regions outside Java. This initiative failed to gain parliamentary approval in January, because of doubts about the government’s readiness to handle the policy’s technical complexity (Jakarta Post, 31/1/2012). This judgment relates in part to the lack of infrastructure to produce and distribute the non-subsidised Pertamax fuel. There may not be a problem for Jakarta, but there would be for the rest of Java and much more so for the outer islands. Another option, namely fuel-to-gas conversion for vehicles, also suffers from a lack of infrastructure, or even of a plan. Despite these problems, the parlia -ment’s rejection of the government proposal was a disappointing outcome, espe -cially given that it was based on technical issues. The parliament requested the government to conduct a comprehensive study of the impact of restrictions on the use of Premium fuel, and to produce a complete roadmap for the conversion from oil to gas fuels. In reality, this is merely another way for the parliament to avoid taking a much-needed yet unpopular decision.
There is an urgent need to curb consumption of the highly subsidised Premium fuel, and end the serious misallocation of budgetary resources that the subsidy represents. Given the high dependency that Indonesians have on this subsidy, not to mention its intricate link with the electricity subsidy,10 no comprehensive plan could address all the potential negative effects of a reduction in the subsidy. Limits on consumption, price increases, oil-to-gas conversion and other meas -ures need to be taken gradually. The potential impact on the poor needs serious consideration. However, past experience with compensation measures, existing
10 Some electricity generators are fuel-based. Higher fuel prices would therefore imply a higher electricity subsidy.
FIGURE 4 Premium and Pertamax Prices and Indonesian Crude Price (ICP)a
(Rp/litre; $/barrel)
Feb-2011 Apr-2011 Jun-2011 Aug-2011 Oct-2011 Dec-2011 Feb-2012 0
4,000 8,000 12,000 16,000
0 30 60 90 120 150
ICP (rhs)
Pertamax
Premium
Rp/litre $/barrel
a Pertamax prices are those on the irst day of each month for the Jakarta area.
Source: Premium and Pertamax: Pertamina; ICP: Ministry of Energy and Mineral Resources.
policies and programs on social protection, and the availability of the latest data on potential social protection beneiciaries11 should all give the government and the parliament suficient conidence to allow them to adopt this much-needed policy. The government plans to submit an early budget revision, anticipating the need to increase fuel prices before too long (Jakarta Post, 4/2/2012).
REGIONAL INEQUALITY
Deep-seated regional inequality may cause social problems, especially if the imbalances are associated with regional differences in natural resource endow -ments. It is important for the government to protect marginalised groups in soci -ety, including especially backward areas that face speciic economic challenges. Indonesia has witnessed the use of sentiments about regional inequality as a basis for separatist claims or requests for special regional autonomy status.
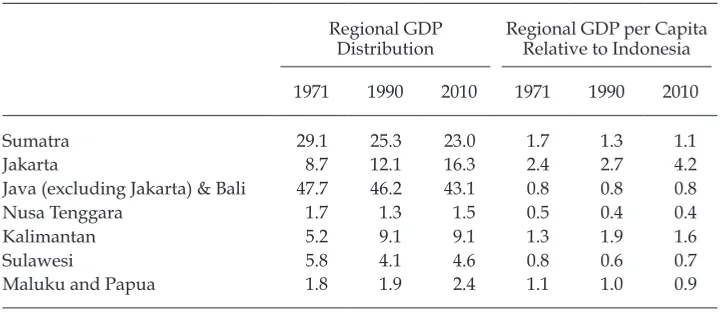
Regional inequality is a long-term phenomenon in Indonesia.12 Table 2 shows that there has been no signiicant redistribution of regional GDP in Indonesia for four decades. In 2010, Java (including Jakarta), Bali and Sumatra generated about
11 The government has established a single registry system for its social protection pro
-grams. The registry is now administered by the Secretariat of the National Team for the Acceleration of Poverty Reduction in the Ofice of the Vice President. (For a discussion of this National Team, see Suryadarma and Sumarto 2011.) The registry is based on the Social Protection Registration (PPLS) conducted by BPS in 2011, and covers approximately 25 million households in the lowest socio-economic status groups.
12 Regional inequality within a country is an international phenomenon. In many coun
-tries, the majority of economic activities are centred on certain regions. In China, eight coastal provinces accounted for more than 40% of total GDP in 2010. In Thailand, approxi
-mately 44% of 2005 GDP was produced in greater Bangkok.
TABLE 2 Distribution of Regional GDP, and Regional GDP per Capita Relative to Indonesia, by Major Island Groupa
(%)
Regional GDP
Distribution Regional GDP per CapitaRelative to Indonesia
1971 1990 2010 1971 1990 2010
Sumatra 29.1 25.3 23.0 1.7 1.3 1.1
Jakarta 8.7 12.1 16.3 2.4 2.7 4.2
Java (excluding Jakarta) & Bali 47.7 46.2 43.1 0.8 0.8 0.8
Nusa Tenggara 1.7 1.3 1.5 0.5 0.4 0.4
Kalimantan 5.2 9.1 9.1 1.3 1.9 1.6
Sulawesi 5.8 4.1 4.6 0.8 0.6 0.7
Maluku and Papua 1.8 1.9 2.4 1.1 1.0 0.9
a Proportions are calculated based on current price regional GDP.
Source: BPS, Statistik Indonesia, various years.
82.4% of Indonesia’s total GDP. Jakarta’s share alone in 2010 was 16.3% of the total, almost twice that of four decades earlier. An interesting phenomenon is apparent in the trends in regional GDP per capita between 1971 and 2010. As a share of the country’s per capita income, Jakarta’s GDP per capita grew very rapidly (table 2), leaving all the other regions behind. Sumatra’s GDP per capita is on a marked declining trend, while the rest of Indonesia shows a virtually unchanging share of GDP per capita over four decades. Java has a high concentration of economic activity and population, and this places intense pressure on the environment. The conversion of Java’s fertile land to non-agricultural uses threatens food produc -tion capacity, primarily in respect of rice. Although such conversion is essential to support population growth and economic activity, it may also limit the island’s ability to support the economy in the future.
There is evidence of regional catch-up, but at a slower rate in the last decade. For the period prior to the Asian inancial crisis, García and Soelistianingsih (1998) and Nazara (1999) conirmed the presence of income convergence, on a per capita basis, across provinces. Recently, Resosudarmo and Vidyattama (2006), Hill, Reso -sudarmo and Vidyattama (2008) and Suii (2008), while further conirming the existence of convergence, also noted that the speed of convergence is declining.
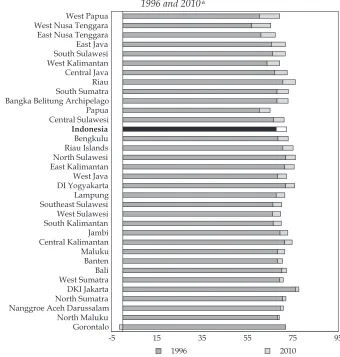
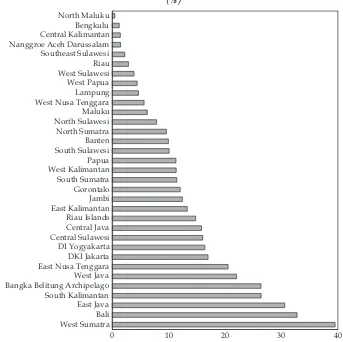
Income is not the only dimension of inter-regional inequality. Inequality is also apparent in the provincial Human Development Index (HDI), which relects achievements on three dimensions: income, education and health. Figure 5 shows the increase in HDI values between 1996 and 2010. Higher values were apparent for West Papua and West and East Nusa Tenggara, and also for some provinces in Java and Sumatra. Twelve provinces improved at a faster rate than the nation-wide igure, ive of them in Java and Sumatra. Gorontalo was the only province to record a decline.13 Overall, these igures support the hypothesis that inter-provin -cial convergence is occurring.
The economic dominance of Java involves more than just total income and population. Java’s economy beneits signiicantly from investments in other parts of Indonesia. Studies conducted by Hulu and Hewings (1993) and Nazara (2006) show that a positive shock such as investment outlays in off-Java regions will in turn increase Java’s output. Java is a major source of raw materials and other production inputs, and at the same time it is the main market for selling products.
Policy options
It is therefore important to assess the government’s strategic policy options for addressing inter-regional inequality. The major policy response to date has of course been regional autonomy and decentralisation. Yet even though horizontal equity was one of decentralisation’s main objectives, a decade after its effective implementation in 2001, decentralisation has not signiicantly changed the pro -vincial shares of regional GDP.
There have been numerous government initiatives to foster regional eco -nomic development by establishing new growth centres in the outer islands, and lessons can be learned from these initiatives. They have included the Batam Authority and the concept of integrated economic development zones (kawasan pengembangan ekonomi terpadu, or Kapet). Currently in Batam there is the free trade
13 Gorontalo province, established in 2001, was previously part of North Sulawesi.
zone and the Free Port Area (Kawasan Perdagangan Bebas dan Pelabuhan Bebas, or KPBPB), the successor to the Batam Authority. Another initiative to promote regional development is the Rehabilitation and Reconstruction Agency (Badan Rehabilitasi dan Rekonstruksi, or BRR) in Aceh–Nias.
The success of these experiments depends on two factors. First, the institu -tional setup must identify clearly the respective roles of the institutions and the regional autonomous government. Contradictory or overlapping roles will only result in disputes among the parties. On the other hand, full acquisition of one of these institutions by the regional government potentially diminishes the effectiveness of the initiative, because of the bureaucratic nature of government. FIGURE 5 Improvement in Provincial Human Development Indicators (HDI) between
1996 and 2010a
change in HDI values between 1996 and 2010. The provinces are sorted in descending order of the values in the latter series. New provinces established after 1996 (Riau Islands, Bangka Belitung Archi
-pelago, Banten, Gorontalo, West Sulawesi, North Maluku and West Papua) show the 1996 HDI values of their respective provinces of origin.
Source: Central Statistics Agency (BPS).
Secondly, any form of regional economic growth centre must be part of a business solution. Indonesia should learn from the Kapet initiative. Established by Presi -dential Decree 89/1996 – later amended by Presi-dential Decree 150/2000 – the Kapet zones were intended to redistribute economic activities to less developed regions. However, they proved to have weak links with local economic activities and hence were never a successful model for new economic growth centres.
The recently enacted Law 39/2009 on Special Economic Zones (Kawasan Ekonomi Khusus, or KEK) faces similar challenges. KEK proposals submitted by many provinces are still very much bureaucracy-driven rather than business-driven. Moreover, various agencies within the central government are still reluc -tant to provide strong incentives such as tax reductions, fearing an erosion of their tax base. This fear is groundless: tax reductions should be granted only within the zone, which in turn should promote linkages with other taxable economic activi -ties outside the zone. On the other hand, the identiication of primary products for processing in these zones is based more on potential than on established results. It is important that KEK status, along with its regulatory and iscal privileges, should be granted only to a well-established processing zone that has previously been supported by the local government.
Another means of promoting more balanced regional economic development is through the provision of infrastructure in less developed areas, to improve the investment climate and boost growth. Two types of infrastructure need to be given priority in the outer islands (Nazara 2010). The irst is energy, particularly electricity, since its availability is the key to many new economic activities. The second is transport infrastructure, as a means of improving inter-regional connec -tivity (Baird and Wihardja 2010: 159–61), and hence regional equality.
REVISIONS TO THE INTERGOVERNMENTAL FINANCE LAW
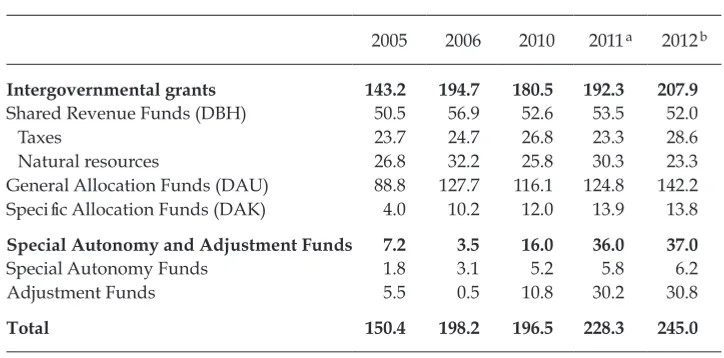
It is now more than 11 years since Indonesia embarked on its major decentralisa -tion program. Since 2000 the government has consistently increased iscal trans -fers to the regions (table 3). In 2006, intergovernmental trans-fers rose sharply as a result of the oil price windfall in 2005. The oil price hike boosted central government revenues from non-tax income as well as from income tax, further increasing the level of general-purpose grants and shared revenues going to the regions.14 Under the SBY administration, iscal transfers per capita grew at around 6% annually in real terms for the period 2005–12.15 Intergovernmental transfers in the 2012 budget are projected to be 32.8% of total expenditure (MOF 2012: 2), or approximately 6% of GDP.
For the last seven years, the implementation of decentralisation in Indonesia has been guided by Law 32/2004 on Regional Government and Law 33/2004 on Central–Regional Government Fiscal Balance. There is a need to revise the laws because of dificulties with implementation. Despite the rise in transfers from the central government, regional governments often demand additional
14 ‘Shared revenues’ are taxes and natural resource revenues shared between the centre and the regions.
15 This rate is calculated from data provided by the Directorate General of Central– Regional Financial Balance, Ministry of Finance.
increases. They also express concern about the uncertainty and unpredictability of intergovernmental transfers from the central government. Regional welfare has improved little over this period, because there has been both allocative and productive ineficiency in regional spending (Mahi 2010). Allocative ineficiency results from mismatches between what is needed and what the budget expendi -ture provides; productive ineficiency refers to low quality in the outcomes of the spending, resulting, for example, from corruption. Surveys and studies of basic health indicators and access to public health services in the regions show that con -ditions are deteriorating (Jakarta Post, 11/2/2012). Weaknesses in regional inance management constitute a serious problem in the implementation of decentralisa -tion (Antara News, 6/7/2011). In addition to implementation issues, there is also a need to accommodate changes in laws and regulations pertaining to regional government that affect the central–local relationship.16
These factors have motivated the government to revise the two decentralisa -tion laws. The Ministry of Home Affairs is in charge of drafting the revisions to Law 32/2004, while the Ministry of Finance is responsible for the revision of Law 33/2004. We now discuss several important elements of the revisions pertaining to Law 33/2004.17
16 Examples include Law 39/2007 on Excise Tax, which regulates revenue sharing for the tobacco excise tax, and Law 28/2009, which changed the property tax from a central gov
-ernment tax shared with local gov-ernments to a local tax.
17 The latest draft of the revision is available at <http://www.djpk.depkeu.go.id>. TABLE 3 Intergovernmental Transfers
(Rp trillion, 2005 prices)
2005 2006 2010 2011a 2012b
Intergovernmental grants 143.2 194.7 180.5 192.3 207.9
Shared Revenue Funds (DBH) 50.5 56.9 52.6 53.5 52.0
Taxes 23.7 24.7 26.8 23.3 28.6
Natural resources 26.8 32.2 25.8 30.3 23.3
General Allocation Funds (DAU) 88.8 127.7 116.1 124.8 142.2
Speciic Allocation Funds (DAK) 4.0 10.2 12.0 13.9 13.8
Special Autonomy and Adjustment Funds 7.2 3.5 16.0 36.0 37.0
Special Autonomy Funds 1.8 3.1 5.2 5.8 6.2
Adjustment Funds 5.5 0.5 10.8 30.2 30.8
Total 150.4 198.2 196.5 228.3 245.0
a Revised budget. b Planned budget.
Source: Adapted from data provided by the Directorate General of Central–Regional Financial Balance, Ministry of Finance.
Eliminating the salary component of the DAU formula
The formula for calculating the general allocation fund (Dana Alokasi Umum, DAU) consists of two main parts. The irst part is the basic allocation, which is determined by the salary expenditure of the regional government, and the second part is the iscal gap, which is calculated as the difference between the iscal needs and the iscal capacity of the regional government. The calculation of iscal needs is based on several indicators, such as the region’s population, area, HDI and gross regional domestic product. Fiscal capacity is the sum of the regional govern -ment’s own revenues and shared revenue.
Since the formula for calculating the DAU includes the basic allocation, which is for civil service salaries, this implies that civil service salaries are guaranteed by the DAU transfers, sending a signal to regional governments that increases in the number of civil servants will always be met by additional DAU transfers from the central government. Currently the basic allocation is about half of the total DAU. The revisions to Law 33/2004 eliminate salaries from the basic allocation. This change is designed to encourage regional governments to save on personnel spending, partly by reducing new recruitment. With salaries eliminated, the for -mula for calculating the DAU will be determined solely by the iscal gap.
The revised DAU plan looks promising, but it would be more effective if it were accompanied by civil service reform. According to the National Civil Ser -vice Agency, there are about 4.6 million civil servants in Indonesia, representing approximately 4.2% of the country’s employed workers. About 80% of these are regional government civil servants. Teachers, whose salaries are paid by regional governments, represent the largest portion of the government’s payroll, account -ing for 36.5% of total civil servants. Table 4 indicates that the number of civil serv -ants is increasing, especially at the regional level.
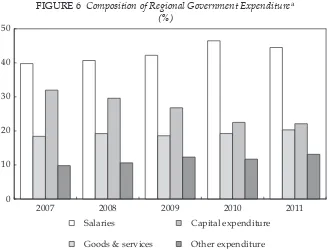
The increasing number of regional government oficials results in rising annual personnel spending, the largest category of regional government expenditure (igure 6). This has prompted the National Bureaucracy Reform Team to urge
TABLE 4 Central and Regional Government Civil Servants (‘000)
2007 2008 2009 2010 2011a
Central government 850 836 907 916 939
Regional government 3,217 3,247 3,618 3,682 3,699
Total 4,067 4,083 4,525 4,598 4,638
Rate of change (%) 0.4 10.8 1.6 0.9
Teachers 1,469 1,601 1,724 1,689 1,695
Share of total (%)
Central government 20.9 20.5 20.0 19.9 20.2
Regional government 79.1 79.5 80.0 80.1 79.8
Teachers 36.1 39.2 38.1 36.7 36.5
a For 2011, data are available to June.
Source: National Civil Service Agency.
a moratorium on civil servant recruitment (Jakarta Globe, 27/6/2011), aimed at ‘improving the system and … avoid[ing] unqualiied workers holding positions in state institutions’. The team also suggested that the government ‘thoroughly evaluate the organisational structures of central and regional government institu -tions’. McLeod (2005: 155–6) proposes a number of reforms to improve the per -formance of the bureaucracy. They include allowing recruitment from outside the civil service at all levels; reforms to pay structures to make them more transpar -ent; the use of fair and transparent performance evaluation procedures in pro -motion decisions; and ‘returning to a system in which all civil service positions are professionally classiied … allowing recruitment to be matched to the skill requirements of each part of the bureaucracy’.
In response, the government has issued an agreement letter signed by the Ministers of Finance, State Administrative and Bureaucracy Reforms, and Home Affairs, declaring a moratorium on civil service recruitment, effective from Sep -tember 2011 to 31 December 2012. Exceptions will be possible in selected cat -egories such as teachers and lecturers, because of high numbers of impending retirements (Antara News, 24/8/2011).
Promoting capital expenditure
In order to promote infrastructure development, the government plans to encourage larger capital expenditures by regional governments. For this purpose, the revisions to Law 33/2004 propose that a minimum of 20% of regional budgets be dedicated to capital expenditure (including goods and services expenditure for maintenance). Given the diverse needs of regional governments across the country, setting a
FIGURE 6 Composition of Regional Government Expenditurea
(%)
2007 2008 2009 2010 2011
0 10 20 30 40 50
Salaries
Goods & services
Capital expenditure
Other expenditure
a The 2011 igure is from the revised budget.
Source: As for table 3.
ixed minimum expenditure for capital will reduce iscal discretion at the regional level, potentially creating another type of allocative ineficiency. Instead of setting a minimum percentage of capital expenditure, the government could use the spe -cial purpose grants (Dana Alokasi Khusus, DAK) to encourage regions to allocate more funds to capital expenditure. The DAK is a regional transfer whose objectives include encouraging regional governments to fulil national priorities such as the development of infrastructure. Since the DAK requires matching regional budget shares, regional governments receiving DAK funds for infrastructure purposes would need to allocate part of their capital expenditure budgets to DAK projects.
Improving budget disbursement
A large proportion of government expenditures occur in the fourth quarter (Baird and Wihardja 2010: 156). In the case of infrastructure projects, this often impairs FIGURE 7 Regional Government Budget Realisation Surpluses as a Share of Regional
Government Total Budgeted Spending for 2009a
(%)
a Spending data: 2009 regional budgets. The surplus is calculated using 2009 budget realisation data.
Source: As for table 3
the quality of implementation, since projects have to be completed quickly. To address this problem, the revised law proposes two policies. First, there will be multi-year general guidelines on the use of the DAK. This policy is intended to eliminate the need for speciic and rigid technical guidelines for DAK projects, which in the past have caused delays in their realisation. Second, the new law plans to eliminate idle funds, which usually arise from the accumulation of regional government surpluses (igure 7). The permitted level of surpluses will be restricted to the equivalent of no more than three months of routine expenditure. This will be achieved by halting grant transfers, or by shifting a portion of the transfers into government bonds.
These regional government surpluses are usually deposited in private banks, and their levels are relected in increased regional government time deposits in the banks. Bank Indonesia data show that these bank deposits have increased over time at both district and provincial levels (igure 8).
Constructing guidelines for a multi-year DAK will present challenges, partic -ularly in relation to implementation, since regional budgets still use an annual rather than a multiple-year planning and accounting system. Implementing the policy of restricting surpluses will also be dificult, because the surpluses are not always the result of weak regional government management, but may also be a consequence of late disbursement of funds by the central government. Furthermore, the revision will require the government to develop a regulation to shift a portion of the transfers into government bonds, and this will neces -sitate close coordination with the government agency responsible for managing these bonds.
FIGURE 8 Regional Government Bank Deposits (Rp trillion)
Mar-2010 Jun-2010 Sep-2010 Dec-2010 Mar-2011 Jun-2011 Sep-2011 Dec-2011 0
10 20 30 40 50
Provinces Cities/districts
Source: Bank Indonesia.
Improving the predictability of regional revenue
At present, because of changes in the weights of the determinant components of the DAU, regional governments face annual uncertainty. The revision of Law 33/2004 aims to improve the predictability of intergovernmental grants through the introduction of a multi-year formula for the DAU, in which the weights of the components are not changed annually, but rather adhere to the Medium Term Expenditure Framework (a multi-year budgeting framework, under which min -istries must include forward estimates for their funding needs for a prescribed number of years following the budget year). The new weights for variables in the DAU formula would be valid for at least three years.
Another element of unpredictability pertains to natural resource revenue shar -ing (a system under which resource-rich regions receive a certain share of the rev -enue the central government has earned from the exploitation of their resources). Currently, the transfers are disbursed quarterly and are based on the realised expenditure of the previous quarter’s revenue. The latter usually takes time to report, resulting in the late disbursement of revenue sharing funds to regional governments. The problem arises in part from luctuations in the oil price (Mahi 2009). To ix this problem, under the revised law the disbursement of these funds in the irst three quarters will be based not on the realised expenditure but on the approved budget igures. The fourth quarter transfer will be based on an estimate calculated using data on the realisation of the shared revenue and the amount transferred in the previous three quarters.
The attainment of minimum service standards
The government plans to reformulate the DAK as an allocation aimed at the attain -ment of regional minimum service standards in areas such as education, health, road infrastructure, bridges, sanitation, irrigation and water. Current ad hoc inter -governmental transfers such as adjustment funds (dana penyesuaian), which are not regulated under Law 33/2004, would become a component of the DAK, and hence would also be directed towards achieving minimum service standards.
Various types of adjustment funds have emerged since 2007. Because of their ad hoc and unregulated nature, they are of debatable value and have consider -able potential for misuse. Adjustment funds were originally introduced under a ‘hold-harmless’ provision, to ensure that no regional government would suffer a reduction in revenue under the new decentralisation arrangements; originally intended to be temporary, the provision was retained (Bahl and Martinez-Vazquez 2006: 12). Since 2010, adjustment funds have also been provided for the pur -pose of developing regional infrastructure. In real terms, the amount of adjust -ment funds rose from Rp 5.5 trillion in 2005 to Rp 30.8 trillion in 2012 (table 3), an increase by a factor of 5.6 in seven years. The Indonesian Forum for Budget Transparency (Fitra) argues that adjustment funds are being used as a form of ‘pork barrel funding’ (Globe Journal, 19/9/2011) to beneit the constituents of local politicians in return for electoral support. Because the allocation of adjust -ment funds is not based on the real needs of the regions, it has the potential to create ineficiencies in regional budgeting. However, adjustment funds have attracted support from poor regions because, unlike the DAK, this type of trans -fer does not require matching regional government funds.
There is an overlap between the DAK and the Regional Infrastructure Adjust -ment Fund, because the activities supported by the adjust-ment funds have similar categories to those inanced by the DAK. To avoid such duplication, under the revised law the regional infrastructure adjustment funds, like other adjustment funds, will become a component of DAK, and be directed towards achieving minimum service standards. The allocation of the funds to regions will therefore follow the provisions of the DAK legislation. To ensure the eficient operation of regional budgets it is essential that the allocation of DAK funds avoid any link with pork barrel politics. This issue is not addressed clearly in the current draft revision of the law.
LAND PROCUREMENT
On 16 December 2011, the parliament ratiied Law 2/2012 on Land Procurement for Public-Purpose Development. The law was enacted on 14 January 2012, and contains a set of regulations on planning, preparation and implementation of the procurement of land for public-purpose development. It has long been awaited for its potential to boost infrastructure, which has lagged behind since the 1997–98 inancial crisis. For example, the road network has failed to keep pace with popu -lation growth. During the period 1999–2006, the length of paved roads grew by just 0.4% annually, and that of total roads by only 0.8%. As a result, Indonesia’s road density contracted by 0.5% (Resosudarmo and Yusuf 2009).
In his second term, President SBY pledged to undertake massive infrastructure development within the Master Plan framework known as MP3EI (Manning and Purnagunawan 2011: 328–30).18 Between May and December 2011, 94 major eco -nomic and infrastructure projects – worth Rp 490.5 trillion ($550 million) – were initiated. These consisted of government projects worth Rp 71.6 trillion (24 pro -jects); state-owned enterprise projects worth Rp 131 trillion (24 pro-jects); private projects worth Rp 168.6 trillion (38 projects); and joint projects worth Rp 128.3 tril -lion (8 projects). The majority of the government and the state-owned enterprise projects are in infrastructure.
Land procurement has long been a serious cause of delay in infrastructure projects. Previously, land procurement for public-purpose development was reg -ulated by Presidential Regulation 36/2005, later modiied by Presidential Reg -ulation 65/2006. These reg-ulations were intended to smooth the way for land acquisition for infrastructure development by private companies. They stipulate that ‘compensation given by the government must be based on market valuation, and they allow land-owners to appeal the amount or type of compensation offered. The regulations deine compensation as being in the form of money, substitute land or resettlement, or any other form agreed by government and land-owners’ (Narjoko and Jotzo 2007: 160). Presidential Regulation 65/2006 also altered the composition of the land procurement committee to include a representative from the BPN (Badan Pertanahan Nasional, National Land Agency).
18 ‘MP3EI’ stands for Masterplan Percepatan dan Perluasan Pembangunan Ekonomi Indonesia 2011–2025 (Master Plan for the Acceleration and Expansion of Indonesian Eco
-nomic Development 2011–2025).
After ive years of ineffective implementation, the government decided to replace Presidential Regulation 65/2006 with a provision in the new Law 2/2012. The previous regulation was considered ineffective because land negotiation pro -cesses often ended in disagreement between communities and the government, and neither government nor the community had suficient legal power to bring about a resolution.19
The major problem was the valuation process that determines a fair compensa -tion price for land. Appeals were often triggered by a community percep-tion that the government always under-estimates the value of their land. The government is represented in the valuation process by an independent land pricing commit -tee, and is legally bound by a series of regulations, such as that requiring the negotiated price to be based on a land price estimate used for property tax calcu -lation, which usually falls below the market price.
The absence of a meeting point between the parties has resulted in delayed project development in the construction of roads, ports, and airports. For exam -ple, the construction of a toll road between Surabaya and Mojokerto has been halted since 2007, because landowners are unwilling to release their land at the price determined by the Gresik district land procurement committee (Kompas, 27/4/2011). A similar problem has occurred in the development of the new Toraja Airport in Sulawesi. The communities have disagreed with the Toraja municipal -ity land procurement committee about the correctness of the land price estimate used for property tax calculation (Ujung Pandang Express, 4/5/2011). The most recent dispute is over the development of a new access road to the Tanjung Priok port in Jakarta (Antara News, 21/10/2011).
The independence of the land acquisition team under Presidential Regulation 65/2006 has also been questioned; since its members are generally government oficials, the team tends to be biased in favour of the government, especially in dealing with disputes related to land procurement for government-run projects. Another point of contention has been the absence from the regulation of clear criteria on the eligibility of land acquisition team members.
The new Law 2/2012 categorises 18 types of infrastructure development activi -ties as ‘public-purpose’:
• defence and national security;
• public roads, highways, tunnels, railway lines, railway stations, railway operation facilities;
• reservoirs, dams, dykes, irrigation, drinking water supply, drainage and sanitation, and other water-related construction;
• ports, airports and terminals;
• oil, gas and geothermal infrastructure;
• electric generators, transmission, sub-stations, networks, and distribution of electricity;
• government telecommunications and information networks; • landill and sewage treatment works;
• central government or regional government hospitals ;
19 ‘Property: land acquisition law’, Global Business Guide Indonesia, available at <http:// www.gbgindonesia.com/en/property/article/2011/land_acquisition_law.php>.
• public safety facilities;
• public cemeteries run by the central government or regional governments; • social facilities, public facilities and public green open space;
• nature reserves and cultural reserves;
• central government or regional government or village ofices;
• rebuilding of urban slums and/or consolidation of land, as well as rental housing for low-income communities;
• school education infrastructure operated by the central government or regional governments;
• sports infrastructure managed by the central government or regional governments; and
• public markets and public parking lots.
The government claims that the new law provides a clear deadline for the land procurement process, and sets a time frame for every acquisition process without ignoring the rights of the public. Under this new law, all legal proceedings per -tinent to land acquisition for a government-commissioned infrastructure project must be completed within 436 working days (Jakarta Post, 8/2/2012). However, judging from the processes allowed for under the law, there is a likelihood that implementation may take even longer than this: the law requires a mandatory public consultation in the land planning stage of the land procurement process. If the public consultation does not result in agreement, the party entitled to the land may ile an objection to the government. The government, through the gov -ernor, may form a team to review and decide on the objection. If the objection is rejected, the party entitled to the land still has the opportunity to appeal to the State Administrative Court, and further to the Supreme Court.
The new law also poses some risks in terms of implementation. It does not explicitly stipulate sanctions that can be applied when violations occur in the implementation of land acquisition. In the absence of sanctions, there is a high probability of deadlock in an extended negotiation process, as has occurred in the implementation of the previous regulations.
Since a major problem with the previous regulations was how to determine a fair price for compensation (McLeod 2005), Law 2/2012 should have proposed the creation of a more independent land procurement committee, with suficient capacity to disentangle the problems of land acquisition. However, it has not done this. Without a more independent team whose members have expertise in land valuation, implementation problems are likely to continue.
The new law allows for affected communities to choose the form of compensa -tion they receive. The alternatives to cash include replacement land, resettlement, stock ownership, or another form approved by both parties. Several of the alterna -tives are in fact less effective than cash and would complicate the process. When parties are given alternatives whose measurement is dificult to assess in terms of monetary equivalent, the negotiation process is likely to be more complex. For example, land replacement requires valuation of the land that is to replace the acquired land. Furthermore, when compensation takes the form of stock owner -ship, the valuation of stock will be problematic, since the value of the shares is uncertain and can luctuate rapidly. A preferable alternative would be something whose equivalent monetary value can be easily calculated.
REFERENCES
Bahl, R.W. and Martinez-Vazquez, J. (2006) ‘Sequencing iscal decentralization’, World Bank Policy Research Working Paper No. 3914, World Bank, Washington DC, available at <http://ssrn.com/abstract=917485>.
Baird, M. and Wihardja, M.M. (2010) ‘Survey of recent developments’, Bulletin of Indonesian Economic Studies 46 (2): 143–70.
BI (Bank Indonesia) (2011) ‘Retail sales survey, November 2011’, Bank Indonesia, Jakarta, available at <http://m.bi.go.id/NR/rdonlyres/1F175045-AACC-4C46-8298-AE
-68A0C3254B/25095/SPE11e.pdf>.
BI (Bank Indonesia) (2012) ‘Consumer survey, December 2011’, Bank Indonesia, Jakarta, available at <http://www.bi.go.id/web/en/Publikasi/Survei/Survei+Konsumen/ cs_1211.htm>.
BPS (Central Statistics Agency) (2012) Berita Resmi Statistik [Oficial Statistical News], No. 01/01/Th.XV, 2 January, available at <http://www.bps.go.id/brs_ile/inlasi_02jan12. pdf>.
Danamon (2012) ‘Indonesia economic brieing’, PT Bank Danamon, Jakarta, February. García, G.J. and Soelistianingsih, L. (1998) ‘Why do differences in provincial incomes per
-sist in Indonesia?’, Bulletin of Indonesian Economic Studies 34 (1): 95–120.
Hill, H., Resosudarmo, B.P. and Vidyattama, Y. (2008) ‘Indonesia’s changing economic geography’, Bulletin of Indonesian Economic Studies 44 (3): 407–35.
Hill, H. and Wihardja, M. (2011) ‘Indonesia’s reform reversal’, Wall Street Journal,
30 November.
Hulu, E. and Hewings, G.J.D. (1993) ‘The development and use of interregional input–out
-put models for Indonesia under conditions of limited information’, Review of Urban and Regional Development Studies 5: 135–53.
Kuncoro, A. and Resosudarmo, B.P. (2006) ‘Survey of recent developments’, Bulletin of Indo-nesian Economic Studies 42 (1): 7–31.
Mahi, B.R. (2009), ‘Oil price luctuations and regional inance in Indonesia’, in Local Govern-ance under Stress: Fiscal Retrenchment and Expanding Public Demands on Government, ed. A. Nakamura, EROPA Local Government Center, Tokyo.
Mahi, B.R. (2010) ‘Intergovernmental relations and decentralization in Indonesia: new arrangements and their impacts on local welfare’, Economics and Finance Indonesia 58 (2): 149–72.
McLeod, R. (2005) ‘Survey of recent developments’, Bulletin of Indonesian Economic Studies 41(2): 133–57.
Manning, C. and Purnagunawan, R.M. (2011) ‘Survey of recent developments’, Bulletin of Indonesian Economic Studies (47) 3: 303–32.
MOF (Ministry of Finance) (2012) ‘Data pokok APBN 2006–2010 [Basic data from the 2006 to 2012 budgets]’, Ministry of Finance, Jakarta.
Narjoko, D.A. and Jotzo, F. (2007) ‘Survey of recent developments’, Bulletin of Indonesian Economic Studies (43) 2: 143–69.
Nazara, S. (1999) Provincial convergence within the neoclassical growth theory in Indo
-nesia, Paper presented at 21st Conference of the Northeast Section of Regional Science Association International (RSAI), Cornell University and SUNY Binghamton, Ithaca NY, 7–8 May.
Nazara, S. (2006) ‘The importance of a region: do other regions matter?’, in Natural Dis-asters’ Impact and Challenges for Recovery: Economic Aids, Governance, Infrastructure, ed. S. Nazara, Proceedings of 7th Indonesian Regional Science Association (IRSA) Inter
-national Conference, Jakarta.
Nazara, S. (2010) Pemerataan antardaerah sebagai tantangan utama transformasi struk
-tural pembangunan ekonomi Indonesia masa depan [Interregional equity as the main
challenge of the structural transformation of Indonesian economic development in the future], Professorial Inauguration Speech, University of Indonesia, 10 March.
Patunru, Arianto A. and Von Luebke, C. (2010) ‘Survey of recent developments’, Bulletin of Indonesian Economic Studies 46 (1): 7–31.
Resosudarmo, B.P. and Yusuf, A.A. (2009) ‘Survey of recent developments’, Bulletin of Indo-nesian Economic Studies 47 (3): 287–315.
Resosudarmo, B.P. and Vidyattama, Y. (2006) ‘Regional income disparity in Indonesia: a panel data analysis’, ASEAN Economic Bulletin 23 (1): 31–44.
Suii, S. (2008) Konvergensi Ekonomi Regional di Indonesia Tahun 1985–2006 [Regional economic convergence in Indonesia 1985–2006], Unpublished Master’s Thesis, Plan
-ning and Public Policy, Faculty of Economics, University of Indonesia, Jakarta. Suryadarma, D. and Sumarto, S. (2011) ‘Survey of recent developments’, Bulletin of
Indo-nesian Economic Studies 47 (2): 155–81.
Wihardja, M.M. and Kristiadi, J. (2011) ‘Indonesia’s cabinet reshufle: how low can it go?’, East Asia Forum, 1 November, <http://www.eastasiaforum.org/2011/11/01/ indonesia-s-cabinet-reshufle-how-low-can-it-go/>.
World Bank (2011) Indonesia Economic Quarterly, December 2011, World Bank, Washington DC.