The effect of the age of Japanese quails on certain egg quality traits
The effect of the age of Japanese quails on certain egg quality traits
and their relationships
and their relationships
Lukáš Zita*, Zdeněk Ledvinka, and Ludmila Klesalová Lukáš Zita*, Zdeněk Ledvinka, and Ludmila Klesalová
Depa rtment of Animal Husbandry, Faculty of Agrobiology, Food and Natural Resources Czech University of Depa rtment of Animal Husbandry, Faculty of Agrobiology, Food and Natural Resources Czech University of
Life Sciences, Prague, Czech Republic Life Sciences, Prague, Czech Republic
________________________________________________________________________________________ ________________________________________________________________________________________
ZITA, L., Z. LEDVINKA, L. KLESALOVÁ
ZITA, L., Z. LEDVINKA, L. KLESALOVÁ:: The effect of the age of Japanese quails The effect of the age of Japanese quails on certain egg quality traits and their relationships
on certain egg quality traits and their relationships. Vet. arhiv 83, 223-232, 2013.. Vet. arhiv 83, 223-232, 2013.
ABSTRACT ABSTRACT
The effect of age on the egg quality traits of Japanese quails (
The effect of age on the egg quality traits of Japanese quails (Coturnix coturnix japonicaCoturnix coturnix japonica) were investigated. ) were investigated.
One hundred female quails were used in the study. The quails were placed in wire cages (3 females per cage) One hundred female quails were used in the study. The quails were placed in wire cages (3 females per cage) and fed a mixture with 11.2 MJ ME and 19.7% of crude protein throughout the experiment. Feed and water and fed a mixture with 11.2 MJ ME and 19.7% of crude protein throughout the experiment. Feed and water were given
were given ad libitumad libitum. Eggs were collected on 2 consecutive days during the 4-week period when the quails . Eggs were collected on 2 consecutive days during the 4-week period when the quails were from 9 to 49 weeks of age. A total of 2,060 eggs were examined. Egg quality traits were signifi cantly were from 9 to 49 weeks of age. A total of 2,060 eggs were examined. Egg quality traits were signifi cantly affected by the age of the quails, with the exception of egg shape index and yolk colour. A rapid increase affected by the age of the quails, with the exception of egg shape index and yolk colour. A rapid increase in the egg weight was found at the beginning of laying, the highest weight (13.02 g) was found in the 25 in the egg weight was found at the beginning of laying, the highest weight (13.02 g) was found in the 25thth
week of age, with a subsequent gradual decrease in egg weight until the end of the laying period at 49 weeks week of age, with a subsequent gradual decrease in egg weight until the end of the laying period at 49 weeks of age. Despite frequent fl uctuations, the albumen index, albumen weight, albumen proportion, Haugh units of age. Despite frequent fl uctuations, the albumen index, albumen weight, albumen proportion, Haugh units score, eggshell weight and eggshell strength decreased with increasing age, but the yolk proportion, eggshell score, eggshell weight and eggshell strength decreased with increasing age, but the yolk proportion, eggshell proportion increased with the quails’ age. The egg weight was positively correlated (P≤0.001) with yolk weight, proportion increased with the quails’ age. The egg weight was positively correlated (P≤0.001) with yolk weight, albumen weight and eggshell weight (0.70, 0.90 and 0.58, respectively). The Haugh unit score was positively albumen weight and eggshell weight (0.70, 0.90 and 0.58, respectively). The Haugh unit score was positively correlated with the albumen index (0.94; P≤0.001).
correlated with the albumen index (0.94; P≤0.001). Key words:
Key words: Japanese quail, age, yolk, albumen, eggshell Japanese quail, age, yolk, albumen, eggshell
________________________________________________________________________________________ ________________________________________________________________________________________
Introduction Introduction
Several factors infl uencing the production and quality characteristics of quail eggs Several factors infl uencing the production and quality characteristics of quail eggs have been reported. However, information about the relationship between the external have been reported. However, information about the relationship between the external and internal traits of eggs and the age of the quail are rather limited (
and internal traits of eggs and the age of the quail are rather limited (NARAYANANKUTTYNARAYANANKUTTY et al., 1989;
et al., 1989; NAZLIGULNAZLIGUL et al., 2001 et al., 2001).).
The age of quails infl uences egg weight.
The age of quails infl uences egg weight. NAGARAJANNAGARAJAN et al. (1991), et al. (1991), GONZALEZGONZALEZ (1995),
(1995), ALTANALTAN et al. (1998), et al. (1998), NAZLIGULNAZLIGUL et al. (2001) et al. (2001) and and ORHANORHAN et al. (2001) et al. (2001) found that egg found that egg *Corresponding author:
Ing. Lukáš Zita, PhD., Department of Animal Husbandry, Faculty of Agrobiology, Food and Natural Resources, Czech University of Life Sciences Prague, Kamycka 129, 165 21, Prague 6 - Suchdol, Czech Republic, Phone: +420 224383 053;
weight increased with the age of the quail. The shape index of the eggs may be affected weight increased with the age of the quail. The shape index of the eggs may be affected by the age of layers in many poultry species.
by the age of layers in many poultry species. GONZALEZGONZALEZ (1995) (1995) and and ORHANORHAN et al. (2001) et al. (2001) describe a decrease in the egg shape index with the age of Japanese quails. On the other describe a decrease in the egg shape index with the age of Japanese quails. On the other hand,
hand, ALTANALTAN et al. (1998) et al. (1998) reported that the egg shape index did not change with the quails’ reported that the egg shape index did not change with the quails’ age.
age.
The albumen weight increased with the quails’ age
The albumen weight increased with the quails’ age ((NAZLIGULNAZLIGUL et al., 2001) et al., 2001). Quail . Quail eggs have lower proportions of albumen than those from hens (
eggs have lower proportions of albumen than those from hens (FLETCHERFLETCHER et al., 1983 et al., 1983). ). A decrease in albumen index with age was reported by
A decrease in albumen index with age was reported by SACHDEVSACHDEV et al. (1989) et al. (1989). On the . On the other hand,
other hand, NAGARAJANNAGARAJAN et al. (1991) et al. (1991) and and ORHANORHAN et al. (2001) et al. (2001) observed that the albumen observed that the albumen index increased with the quails’ age. The Haugh unit score is the accepted unit for index increased with the quails’ age. The Haugh unit score is the accepted unit for measuring the albumen quality of eggs. Of all the egg quality traits, only the Haugh unit measuring the albumen quality of eggs. Of all the egg quality traits, only the Haugh unit score is considered the best objective mathematical expression to measure egg quality score is considered the best objective mathematical expression to measure egg quality ((KONDAIAHKONDAIAH et al., 1983 et al., 1983). With the increasing age of the quails, the Haugh unit score may ). With the increasing age of the quails, the Haugh unit score may decrease (
decrease (NAZLIGULNAZLIGUL et al., 2001; et al., 2001; ORHANORHAN et al., 2001 et al., 2001) or not change () or not change (ALTANALTAN et al., 1998 et al., 1998).). The yolk weight in Japanese quail increased with their age (
The yolk weight in Japanese quail increased with their age (NAZLIGULNAZLIGUL et al., 2001 et al., 2001). ). Qua il eggs have higher proportions of yolk than those from hens (
Qua il eggs have higher proportions of yolk than those from hens (FLETCHERFLETCHER et al., 1983 et al., 1983). ). The yolk index increased with the quails’ age (
The yolk index increased with the quails’ age (NAGARAJANNAGARAJAN et al., 1991; et al., 1991; GONZALEZGONZALEZ, , 1995
1995). In contrast, ). In contrast, ORHANORHAN et al. (2001) et al. (2001) found that the yolk index decreased with the age. found that the yolk index decreased with the age. Eggshell quality characteristics are also affected by the age of the quails. Many Eggshell quality characteristics are also affected by the age of the quails. Many authors have reported that eggshell weight increases and eggshell thickness decreased authors have reported that eggshell weight increases and eggshell thickness decreased with quails’ age (
with quails’ age (GONZALEZGONZALEZ, 1995; , 1995; ALTANALTAN et al., 1998; et al., 1998; NAZLIGULNAZLIGUL et al., 2001; et al., 2001; ORHANORHAN et al., 2001
et al., 2001). Eggshell thickness, however, was not in). Eggshell thickness, however, was not inflfl uenced by the age of the quail uenced by the age of the quail ((NAGARAJANNAGARAJAN et al., 1991 et al., 1991). Compared to hens’ eggs, those from quail had poorer shell ). Compared to hens’ eggs, those from quail had poorer shell quality, as judged by shell thickness and shape (
quality, as judged by shell thickness and shape (FLETCHERFLETCHER et al., 1983 et al., 1983).).
The aim of the present study was to determine the infl uence of the age of Japanese The aim of the present study was to determine the infl uence of the age of Japanese quails on the characteristics of their eggs. Correlations between some egg quality traits quails on the characteristics of their eggs. Correlations between some egg quality traits were also determined.
were also determined.
Materials and methods Materials and methods
Conditions of the experiment.
Conditions of the experiment. The monitoring was carried out on 100 female The monitoring was carried out on 100 female Japanese quails (
Japanese quails (Coturnix coturnix japonicaCoturnix coturnix japonica). The quails (Pharaoh strain) used for the ). The quails (Pharaoh strain) used for the study were the progeny of generation 32 obtained from a single hatching and were placed study were the progeny of generation 32 obtained from a single hatching and were placed in wire cages (3 females per cage - 400 cm
in wire cages (3 females per cage - 400 cm22 per quail). A temperature of 14 to 23 °C per quail). A temperature of 14 to 23 °C
was maintained. The lighting regime consisted of 16 h of light and 8 h of darkness. The was maintained. The lighting regime consisted of 16 h of light and 8 h of darkness. The quails were fed a mixture with 11.2 MJ ME and 19.7% crude protein throughout the quails were fed a mixture with 11.2 MJ ME and 19.7% crude protein throughout the experimental period. Feed and water were given
Egg quality analysis.
Egg quality analysis. A total of 2,060 eggs of the quails were used during the A total of 2,060 eggs of the quails were used during the experiment, and all measurements were performed on each egg. The eggs were collected experiment, and all measurements were performed on each egg. The eggs were collected over 2 consecutive days during the 4-week periods when the quails were from 9 to 49 over 2 consecutive days during the 4-week periods when the quails were from 9 to 49 weeks of age and weighed using an electronic scale with an accuracy of 0.01 g. The weeks of age and weighed using an electronic scale with an accuracy of 0.01 g. The length and width of the eggs were measured with a digital calliper to the nearest 0.01 mm. length and width of the eggs were measured with a digital calliper to the nearest 0.01 mm. Deformation of the eggshell and its strength were evaluated using the QC-SPA device Deformation of the eggshell and its strength were evaluated using the QC-SPA device (TSS England). Eggshell thickness was measured with a the QCT device (TSS England). (TSS England). Eggshell thickness was measured with a the QCT device (TSS England). The length and width of the thick albumen and yolk were measured by digital calliper. The length and width of the thick albumen and yolk were measured by digital calliper. The albumen height was determined by the QCH and QCM+ device (TSS England). The albumen height was determined by the QCH and QCM+ device (TSS England). The height of the thick yolk was recorded with a spherometer. The colour of the yolk The height of the thick yolk was recorded with a spherometer. The colour of the yolk was determined according to the La Roche scale (scores 1-15). The albumen and yolk was determined according to the La Roche scale (scores 1-15). The albumen and yolk were weighed, but the eggshell was weighed after removal of the rest the albumen. The were weighed, but the eggshell was weighed after removal of the rest the albumen. The weight of each albumen, yolk and eggshell was recorded to an accuracy of 0.01 g. The weight of each albumen, yolk and eggshell was recorded to an accuracy of 0.01 g. The proportions of yolk, albumen, and eggshell were calculated in relation to egg weight and proportions of yolk, albumen, and eggshell were calculated in relation to egg weight and expressed as percentages. The egg shape index (ESI), albumen index (AI), yolk index expressed as percentages. The egg shape index (ESI), albumen index (AI), yolk index (YI) and Haugh units score (HU) were also computed.
(YI) and Haugh units score (HU) were also computed. Calculations and statistical analysis.
Calculations and statistical analysis. The egg shape index (ESI) was determined The egg shape index (ESI) was determined using the following equation (
using the following equation (ANDERSONANDERSON et al., 2004 et al., 2004):): ESI = width of egg 100 (%)
length of egg
The albumen index (AI) and yolk index (YI) were calculated the same as for laying The albumen index (AI) and yolk index (YI) were calculated the same as for laying hen eggs in accordance with
hen eggs in accordance with HEIMANHEIMAN and and CARVERCARVER (1936) (1936) and and FUNKFUNK (1948) (1948), respectively:, respectively:
AI = albumen height 100 (%)
(long diameter of albumen + short diameter of albumen) / 2
YI = yolk height 100 (%)
yolk diameter
Haugh units scores (HU) were calculated per replicate from the values obtained from Haugh units scores (HU) were calculated per replicate from the values obtained from albumen height (in millimeters) and egg weight (in grams) by employing the formula albumen height (in millimeters) and egg weight (in grams) by employing the formula ((HAUGHHAUGH, 1937, 1937):):
HU = 100 * log (albumen height + 7.57 - 1.7 * egg weight HU = 100 * log (albumen height + 7.57 - 1.7 * egg weight0.370.37))
All the data of egg quality were analysed using the Univariate, Means, and GLM All the data of egg quality were analysed using the Univariate, Means, and GLM procedures (SAS 9.2; 2010). The signifi cance of differences between the weeks of the procedures (SAS 9.2; 2010). The signifi cance of differences between the weeks of the laying period was tested by the Scheffe’s test at the levels of signifi cance of P≤0.05, laying period was tested by the Scheffe’s test at the levels of signifi cance of P≤0.05, 0.01 and 0.001. Correlations between egg quality traits were determined according to the 0.01 and 0.001. Correlations between egg quality traits were determined according to the
PROC CORR procedure of the SAS 9.2 statistical package (2010) by Pearson correlation PROC CORR procedure of the SAS 9.2 statistical package (2010) by Pearson correlation coeffi cients by linear estimation.
coeffi cients by linear estimation.
Results Results
Table 1 shows that the average egg weight was signifi cantly (P≤0.001) infl uenced Table 1 shows that the average egg weight was signifi cantly (P≤0.001) infl uenced by the week of age. A rapid increase in the egg weight was found at the beginning of by the week of age. A rapid increase in the egg weight was found at the beginning of laying period in 9
laying period in 9thth week of age, highest weight in the 25 week of age, highest weight in the 25thth week of age, with a subsequent week of age, with a subsequent
gradual decrease in egg weight until the end of the laying period in the 49
gradual decrease in egg weight until the end of the laying period in the 49thth week of age. week of age.
The egg shape index was not signifi cantly infl uenced by the week of age. The albumen The egg shape index was not signifi cantly infl uenced by the week of age. The albumen index signifi cantly (P≤0.001) decreased with the progression of the laying period. The index signifi cantly (P≤0.001) decreased with the progression of the laying period. The albumen weight increased to the 25
albumen weight increased to the 25thth week of age, with a subsequent gradual decrease week of age, with a subsequent gradual decrease
until the end of the laying period. The albumen proportion gradually decreased, opposite until the end of the laying period. The albumen proportion gradually decreased, opposite to that of the yolk. The Haugh unit score demonstrated a declining trend during the laying to that of the yolk. The Haugh unit score demonstrated a declining trend during the laying period.
period.
Table 1. Average values of egg weight, egg shape index and parameters of albumen quality in Table 1. Average values of egg weight, egg shape index and parameters of albumen quality in
consecutive weeks of age (Mean ± SEM) consecutive weeks of age (Mean ± SEM)
Week Week of age of age Egg weight (g) Egg shape index (%) Albumen index (%) Albumen weight (g) Albumen Albumen proportion (%) proportion (%) Haugh unit Haugh unit score score 99 11.96b ± 0.32 77.97 ± 0.28 12.47a ± 0.21 7.07ab ± 0.28 58.8758.87aa ± 0.35 ± 0.35 90.1390.13abab ± 0.69 ± 0.69 13 13 12.69ab ± 0.21 77.64 ± 0.19 12.33a ± 0.14 7.30ab ± 0.19 57.4757.47abab ± 0.23 ± 0.23 90.8890.88aa ± 0.46 ± 0.46 17 17 12.29ab ± 0.54 78.77 ± 0.47 12.38a ± 0.36 7.11ab ± 0.47 57.7857.78abab ± 0.59 ± 0.59 90.5090.50abab ± 1.17 ± 1.17 21 21 13.00a ± 0.30 77.54 ± 0.26 10.47b ± 0.20 7.38ab ± 0.27 56.6556.65abab ± 0.33 ± 0.33 85.9885.98cdcd ± 0.65 ± 0.65 25 25 13.02a ± 0.31 77.38 ± 0.27 10.54b ± 0.20 7.53a ± 0.27 57.7957.79abab ± 0.33 ± 0.33 87.1387.13bcbc ± 0.66 ± 0.66 29 29 12.78ab ± 0.33 77.37 ± 0.28 9.86b ± 0.22 7.25ab ± 0.28 56.4556.45abab ± 0.36 ± 0.36 85.1085.10cdcd ± 0.70 ± 0.70 33 33 12.46ab ± 0.27 77.84 ± 0.24 10.29b ± 0.18 7.10ab ± 0.24 56.8856.88abab ± 0.30 ± 0.30 85.4785.47cdcd ± 0.59 ± 0.59 37 37 12.39ab ± 0.24 78.24 ± 0.21 9.53b ± 0.16 7.09ab ± 0.21 57.0857.08abab ± 0.27 ± 0.27 83.8983.89cdcd ± 0.52 ± 0.52 41 41 12.40ab ± 0.26 78.02 ± 0.22 8.92b ± 0.17 6.98ab ± 0.22 56.1956.19abab ± 0.28 ± 0.28 82.9882.98dd ± 0.55 ± 0.55 45 45 12.36ab ± 0.26 77.82 ± 0.23 8.88b ± 0.17 6.92b ± 0.23 55.8255.82bb ± 0.29 ± 0.29 82.9082.90dd ± 0.57 ± 0.57 49 49 12.23ab ± 0.27 78.23 ± 0.24 9.84b ± 0.18 6.91b ± 0.24 56.1756.17abab ± 0.30 ± 0.30 85.1585.15cdcd ± 0.59 ± 0.59 Overall Overall mean mean 12.52 77.85 10.39 7.14 56.9356.93 86.1586.15 P≤ P≤ 0.001 NS 0.001 0.05 0.0010.001 0.0010.001 SEM SEM 0.03 0.08 0.07 0.03 0.100.10 0.130.13
NS - non signifi cant; SEM - standard error of mean;
NS - non signifi cant; SEM - standard error of mean; abcd abcd means with common superscripts do not differ means with common superscripts do not differ
signifi cantly, determined by Scheffe’s test signifi cantly, determined by Scheffe’s test
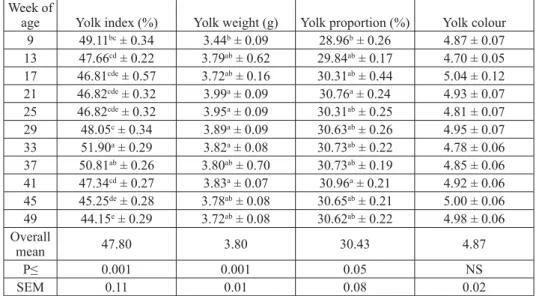
Age was a signifi cant (P≤0.001) factor, clearly affecting the yolk index (Table 2). The Age was a signifi cant (P≤0.001) factor, clearly affecting the yolk index (Table 2). The yolk index reached a relatively high value in the fi rst week of the laying period, followed yolk index reached a relatively high value in the fi rst week of the laying period, followed by a marked drop in the 13
approximately steady value until the 33
approximately steady value until the 33thth week of age when the highest value was reached. week of age when the highest value was reached.
From the 37
From the 37thth week of age onwards, the index continued to decrease signi week of age onwards, the index continued to decrease signififi cantly. The cantly. The
yolk weight was signifi cantly (P≤0.001) infl uenced by the week of age, when the lowest yolk weight was signifi cantly (P≤0.001) infl uenced by the week of age, when the lowest weight was found at the beginning of the laying period, with subsequent gradual increase weight was found at the beginning of the laying period, with subsequent gradual increase with age. At the end of the laying period a slight decrease in yolk weight was determined. with age. At the end of the laying period a slight decrease in yolk weight was determined. The yolk proportion increased intensively during the fi rst four weeks of the laying period The yolk proportion increased intensively during the fi rst four weeks of the laying period (P≤0.05). From week 17, the proportion remained steady and high until the end of the (P≤0.05). From week 17, the proportion remained steady and high until the end of the laying period. The yolk colour was not infl uenced by the age.
laying period. The yolk colour was not infl uenced by the age.
Table 2. Average values of some traits of yolk quality in consecutive weeks of age (Mean ± SEM) Table 2. Average values of some traits of yolk quality in consecutive weeks of age (Mean ± SEM)
Week of
age Yolk index (%) Yolk weight (g) Yolk proportion (%) Yolk colour
9 49.11bc ± 0.34 3.44b ± 0.09 28.96b ± 0.26 4.87 ± 0.07 13 47.66cd ± 0.22 3.79ab ± 0.62 29.84ab ± 0.17 4.70 ± 0.05 17 46.81cde ± 0.57 3.72ab ± 0.16 30.31ab ± 0.44 5.04 ± 0.12 21 46.82cde ± 0.32 3.99a ± 0.09 30.76a ± 0.24 4.93 ± 0.07 25 46.82cde ± 0.32 3.95a ± 0.09 30.31ab ± 0.25 4.81 ± 0.07 29 48.05c ± 0.34 3.89a ± 0.09 30.63ab ± 0.26 4.95 ± 0.07 33 51.90a ± 0.29 3.82a ± 0.08 30.73ab ± 0.22 4.78 ± 0.06 37 50.81ab ± 0.26 3.80ab ± 0.70 30.73ab ± 0.19 4.85 ± 0.06 41 47.34cd ± 0.27 3.83a ± 0.07 30.96a ± 0.21 4.92 ± 0.06 45 45.25de ± 0.28 3.78ab ± 0.08 30.65ab ± 0.21 5.00 ± 0.06 49 44.15e ± 0.29 3.72ab ± 0.08 30.62ab ± 0.22 4.98 ± 0.06 Overall mean 47.80 3.80 30.43 4.87 P≤ 0.001 0.001 0.05 NS SEM 0.11 0.01 0.08 0.02
NS - non signifi cant; SEM - standard error of mean;
NS - non signifi cant; SEM - standard error of mean; abcdeabcde means with common superscripts do not differ means with common superscripts do not differ
signifi cantly, determined by Scheffe’s test signifi cantly, determined by Scheffe’s test
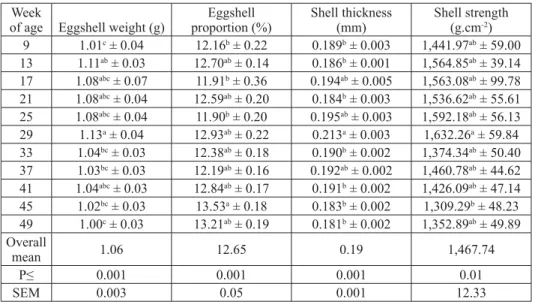
Eggshell quality is an important indicator of egg value (Table 3). The week of age Eggshell quality is an important indicator of egg value (Table 3). The week of age had a signifi cant (P≤0.001) effect on the eggshell weight. Eggshell weight increased with had a signifi cant (P≤0.001) effect on the eggshell weight. Eggshell weight increased with age, and reached its peak in the 29
age, and reached its peak in the 29thth week of age, with a subsequent gradual decrease week of age, with a subsequent gradual decrease
in eggshell weight until the end of the laying period. The eggshell proportion tended in eggshell weight until the end of the laying period. The eggshell proportion tended to increase towards the end of the laying period (P≤0.001). Eggshell thickness, despite to increase towards the end of the laying period (P≤0.001). Eggshell thickness, despite frequent fl uctuations, demonstrated a declining tendency, in particular towards the end of frequent fl uctuations, demonstrated a declining tendency, in particular towards the end of the laying period (P≤0.001). Eggshell strength was also affected (P≤0.01) by the week the laying period (P≤0.001). Eggshell strength was also affected (P≤0.01) by the week of age. Despite frequent fl uctuations, the eggshell strength decreased in the course of the of age. Despite frequent fl uctuations, the eggshell strength decreased in the course of the laying period.
Table 3. Average values of traits of eggshell quality in consecutive weeks of age (Mean ± SEM) Table 3. Average values of traits of eggshell quality in consecutive weeks of age (Mean ± SEM)
Week
of age Eggshell weight (g) proportion (%)Eggshell Shell thickness (mm) Shell strength (g.cm-2)
9 1.01c ± 0.04 12.16b ± 0.22 0.189b ± 0.003 1,441.97ab ± 59.00 13 1.11ab ± 0.03 12.70ab ± 0.14 0.186b ± 0.001 1,564.85ab ± 39.14 17 1.08abc ± 0.07 11.91b ± 0.36 0.194ab ± 0.005 1,563.08ab ± 99.78 21 1.08abc ± 0.04 12.59ab ± 0.20 0.184b ± 0.003 1,536.62ab ± 55.61 25 1.08abc ± 0.04 11.90b ± 0.20 0.195ab ± 0.003 1,592.18ab ± 56.13 29 1.13a ± 0.04 12.93ab ± 0.22 0.213a ± 0.003 1,632.26a ± 59.84 33 1.04bc ± 0.03 12.38ab ± 0.18 0.190b ± 0.002 1,374.34ab ± 50.40 37 1.03bc ± 0.03 12.19ab ± 0.16 0.192ab ± 0.002 1,460.78ab ± 44.62 41 1.04abc ± 0.03 12.84ab ± 0.17 0.191b ± 0.002 1,426.09ab ± 47.14 45 1.02bc ± 0.03 13.53a ± 0.18 0.183b ± 0.002 1,309.29b ± 48.23 49 1.00c ± 0.03 13.21ab ± 0.19 0.181b ± 0.002 1,352.89ab ± 49.89 Overall mean 1.06 12.65 0.19 1,467.74 P≤ 0.001 0.001 0.001 0.01 SEM 0.003 0.05 0.001 12.33
SEM - standard error of mean;
SEM - standard error of mean; abcabc means with common superscripts do not differ signi means with common superscripts do not differ signififi cantly, determined by cantly, determined by
Scheffe’s test Scheffe’s test
Table 4.
Table 4. Correlations between the averages of some egg quality traitsCorrelations between the averages of some egg quality traits
Trait weight (g)Yolk weight (g)Albumen weight (g)Eggshell
Yolk proportion (%) Albumen proportion (%) Eggshell proportion (%) index (%)Albumen Egg weight (g) 0.70*** 0.90*** 0.58*** -0.12*** 0.28*** -0.37*** -Yolk weight (g) - 0.36*** 0.39*** 0.61*** -0.38*** -0.23*** -Albumen weight (g) - - 0.44*** -0.48*** 0.67*** -0.54*** -Eggshell weight (g) - - - -0.10*** -0.01NS 0.18*** -Haugh unit score - - - 0.94***
*** P≤0.001; NS - non signifi cant *** P≤0.001; NS - non signifi cant
The correlations between some egg quality traits are presented in Table 4. Egg The correlations between some egg quality traits are presented in Table 4. Egg weight positively correlated with yolk weight, albumen weight and eggshell weight. The weight positively correlated with yolk weight, albumen weight and eggshell weight. The correlation of egg weight with yolk proportion and eggshell proportion were negative, but correlation of egg weight with yolk proportion and eggshell proportion were negative, but that of egg weight with albumen proportion was positive. The albumen weight positively that of egg weight with albumen proportion was positive. The albumen weight positively
correlated with the albumen proportion, but negatively with yolk proportion and eggshell correlated with the albumen proportion, but negatively with yolk proportion and eggshell proportion. The Haugh unit correlated highly positively with the albumen index. proportion. The Haugh unit correlated highly positively with the albumen index.
Discussion Discussion
In the present study, egg quality traits were affected by the age of the quails, with the In the present study, egg quality traits were affected by the age of the quails, with the exception of egg shape index and yolk colour. There was an increase observed in the egg exception of egg shape index and yolk colour. There was an increase observed in the egg weight to the 25
weight to the 25thth week of age, with a subsequent gradual decrease in egg weight until the week of age, with a subsequent gradual decrease in egg weight until the
end of the laying period. Numerous authors (
end of the laying period. Numerous authors (NAGARAJANNAGARAJAN et al., 1991; et al., 1991; GONZALEZGONZALEZ, 1995; , 1995; ALTAN
ALTAN et al., 1998; et al., 1998; NAZLIGUL NAZLIGUL et al., 2001; et al., 2001; ORHANORHAN et al., 2001 et al., 2001) have reported egg weight ) have reported egg weight continuously increasing with increasing age. Our results thus correspond more to those continuously increasing with increasing age. Our results thus correspond more to those reported by
reported by RIRI et al. (2005) et al. (2005), who reported increasing egg weight only between the 6, who reported increasing egg weight only between the 6thth and and
32
32ndnd weeks of age. The egg shape index was not signi weeks of age. The egg shape index was not signififi cantly in cantly inflfl uenced by the week of uenced by the week of
age and this corresponds with the fi ndings by
age and this corresponds with the fi ndings by ALTANALTAN et al. (1998) et al. (1998). However, . However, GONZALEZGONZALEZ (1995)
(1995), and , and ORHANORHAN et al. (2001) et al. (2001) all con all confifi rm a decreasing tendency in the egg shape index rm a decreasing tendency in the egg shape index with increasing age.
with increasing age.
The albumen index decreased with the progression of the laying period. A decrease in The albumen index decreased with the progression of the laying period. A decrease in albumen index with age was reported by
albumen index with age was reported by SACHDEVSACHDEV et al. (1989) et al. (1989). Both . Both NAGARAJANNAGARAJAN et al. et al. (1991)
(1991) and and ORHANORHAN et al. (2001) et al. (2001) reported, however, that the albumen index increased with reported, however, that the albumen index increased with age. The albumen weight increased to the 25
age. The albumen weight increased to the 25thth week of age, with a subsequent gradual week of age, with a subsequent gradual
decrease in the albumen weight until the end of the laying period. Our results found decrease in the albumen weight until the end of the laying period. Our results found only partial correspondence with the fi ndings of
only partial correspondence with the fi ndings of NAZLNAZLİİGULGUL et al. (2001) et al. (2001), who reported , who reported increasing albumen weight with age. The albumen proportion gradually decreased. A increasing albumen weight with age. The albumen proportion gradually decreased. A decreasing tendency of the albumen proportion was also reported by
decreasing tendency of the albumen proportion was also reported by FLETCHERFLETCHER et al. et al. (1983)
(1983), who reported a lower albumen proportion in Japanese quails compared to hens. , who reported a lower albumen proportion in Japanese quails compared to hens. Despite numerous deviations, the Haugh unit scores demonstrated a declining trend, Despite numerous deviations, the Haugh unit scores demonstrated a declining trend, corresponding with the results reported by
corresponding with the results reported by NAZLIGULNAZLIGUL et al. (2001), et al. (2001), ORHANORHAN et al. (2001 et al. (2001), ), and this is in contrast with
and this is in contrast with ALTANALTAN et al. (1986) et al. (1986), who observed no changes in the Haugh , who observed no changes in the Haugh unit values in the course of the laying period.
unit values in the course of the laying period.
The yolk index reached a relatively high value in the 9
The yolk index reached a relatively high value in the 9thth week of age and in the week of age and in the
33
33rdrd week of age, when the highest value was reached. From the 37 week of age, when the highest value was reached. From the 37thth week onwards, the week onwards, the
index continued to decrease signifi cantly. The results of yolk index showed that the yolk index continued to decrease signifi cantly. The results of yolk index showed that the yolk index was affected by age of quails. This fi nding is partially in agreement with
index was affected by age of quails. This fi nding is partially in agreement with ORHANORHAN et al. (2001)
et al. (2001), who reported a decreasing yolk index with increasing age. However, both , who reported a decreasing yolk index with increasing age. However, both
NAGARAJAN
NAGARAJAN et al. (1991) et al. (1991) and and GONZALEZGONZALEZ (1995) (1995) reported increasing yolk index values reported increasing yolk index values with the increasing age of quails. The lowest yolk weight was found at the beginning of with the increasing age of quails. The lowest yolk weight was found at the beginning of the laying period, with a subsequent gradual increase with age. At the end of the laying the laying period, with a subsequent gradual increase with age. At the end of the laying period a slight decrease in yolk weight was determined.
period a slight decrease in yolk weight was determined. NAZLNAZLİİGULGUL et al. (2001) et al. (2001) found found that the weight of the yolk increased with age. A signifi cantly higher yolk proportion to that the weight of the yolk increased with age. A signifi cantly higher yolk proportion to
egg weight, compared to hens‘ eggs, was reported by
egg weight, compared to hens‘ eggs, was reported by FLETCHERFLETCHER et al. (1983) et al. (1983). The yolk . The yolk colour values showed irregular fl uctuations which is in agreement with
colour values showed irregular fl uctuations which is in agreement with NAGARAJANNAGARAJAN et et al. (1991)
al. (1991)..
Eggshell weight increased with age, and reached its peak in the 29
Eggshell weight increased with age, and reached its peak in the 29thth week of the week of the
laying period, with a subsequent gradual decrease in eggshell weight until the end of the laying period, with a subsequent gradual decrease in eggshell weight until the end of the laying period. Our results only partially correspond with the fi ndings of
laying period. Our results only partially correspond with the fi ndings of NAZLNAZLİİGULGUL et et al. (2001)
al. (2001), who reported a higher eggshell weight with age. Eggshell thickness, despite , who reported a higher eggshell weight with age. Eggshell thickness, despite frequent fl uctuations, demonstrated a declining tendency, in particular towards the end of frequent fl uctuations, demonstrated a declining tendency, in particular towards the end of the laying period. Similar conclusions were reported in the works of
the laying period. Similar conclusions were reported in the works of GONZALEZGONZALEZ (1995), (1995), ALTAN
ALTAN et al. (1998), et al. (1998), NAZLIGULNAZLIGUL et al. (2001) et al. (2001) and and ORHANORHAN et al. (2001) et al. (2001). . YANNAKOPOULOSYANNAKOPOULOS and
and TSERVENI-GOUSITSERVENI-GOUSI (1987) (1987), on the other hand, reported eggshell thickness increasing , on the other hand, reported eggshell thickness increasing with age in hens.
with age in hens. NAGARAJANNAGARAJAN et al. (1991) et al. (1991) found no relationship between the age and the found no relationship between the age and the eggshell thickness in Japanese quails.
eggshell thickness in Japanese quails.
Egg weight positively correlated with yolk weight, albumen weight and Egg weight positively correlated with yolk weight, albumen weight and eggshell weight. The results of our experiment are in accordance with the fi ndings of eggshell weight. The results of our experiment are in accordance with the fi ndings of
BAUMGARTNER
BAUMGARTNER (1994) (1994) and and MINVIELLEMINVIELLE et al. (1997) et al. (1997), who found correlations between , who found correlations between egg weight and the weights of its component parts to be well above 0.5. On the other egg weight and the weights of its component parts to be well above 0.5. On the other hand,
hand, BAUMGARTNERBAUMGARTNER et al. (2008) et al. (2008) demonstrated that the correlation between egg weight demonstrated that the correlation between egg weight and the yolk weight, albumen weight and eggshell weight (computed from the averages and the yolk weight, albumen weight and eggshell weight (computed from the averages of investigated traits in 20 generations) was non-signifi cantly lower (0.432, 0.438 of investigated traits in 20 generations) was non-signifi cantly lower (0.432, 0.438 and 0.234, respectively). Egg weight was positively correlated with albumen weight and 0.234, respectively). Egg weight was positively correlated with albumen weight ((YANNAKOPOULOSYANNAKOPOULOS and and TSERVENI-GOUSITSERVENI-GOUSI, 1987, 1987). In hens‘ eggs signi). In hens‘ eggs signififi cant correlations cant correlations were reported between the Haugh unit scores and other egg quality traits (
were reported between the Haugh unit scores and other egg quality traits (BARKERBARKER et al., et al., 1962;
1962; KOTAIAHKOTAIAH et al., 1975 et al., 1975).).
Conclusion Conclusion
Monitoring of the quality traits of Japanese quails‘ eggs is important when considering Monitoring of the quality traits of Japanese quails‘ eggs is important when considering health and food safety, and storage stability. In our study, despite frequent fl uctuations, the health and food safety, and storage stability. In our study, despite frequent fl uctuations, the albumen index, albumen weight, albumen proportion, Haugh units, eggshell weight, and albumen index, albumen weight, albumen proportion, Haugh units, eggshell weight, and eggshell strength decreased with increasing age, but the egg shape index, yolk proportion, eggshell strength decreased with increasing age, but the egg shape index, yolk proportion, and eggshell proportion increased. The change in some egg quality traits of Japanese and eggshell proportion increased. The change in some egg quality traits of Japanese quails with age may affect the eggs´ storage length or perhaps even their hatchability. Like quails with age may affect the eggs´ storage length or perhaps even their hatchability. Like other poultry species, hatching results are largely dependent on the quality of the eggs. other poultry species, hatching results are largely dependent on the quality of the eggs. With the increasing age of the quails, the biological value and quality of eggs needed for With the increasing age of the quails, the biological value and quality of eggs needed for successful development of the embryo slowly decrease. In order to obtain more results successful development of the embryo slowly decrease. In order to obtain more results and draw more clear-cut conclusions, it is necessary to conduct further investigations into and draw more clear-cut conclusions, it is necessary to conduct further investigations into the problems associated with the storage of Japanese quails‘ eggs and changes in their the problems associated with the storage of Japanese quails‘ eggs and changes in their quality in combination with hatchability results.
_______ _______ Acknowledgements Acknowledgements
The study was supported by “S” grant of Ministry of Education, Youth and Sports of the Czech Republic. We The study was supported by “S” grant of Ministry of Education, Youth and Sports of the Czech Republic. We thank Mrs. Lois Russell for her editorial help with this manuscript.
thank Mrs. Lois Russell for her editorial help with this manuscript.
References References
ALTAN, O., I. OGUZ, Y. AKBAS
ALTAN, O., I. OGUZ, Y. AKBAS (1998): Effects of selection for high body weight and age of hen (1998): Effects of selection for high body weight and age of hen on egg characteristics in Japanese quail
on egg characteristics in Japanese quail (Coturnix coturnix japonica)(Coturnix coturnix japonica). Turk. J. Vet. Anim. Sci. . Turk. J. Vet. Anim. Sci.
22, 467-473. 22, 467-473.
ANDERSON, K. E., J. B. THARRINGTON, P. A. CURTIS, F. T. JONES
ANDERSON, K. E., J. B. THARRINGTON, P. A. CURTIS, F. T. JONES (2004): Shell characteristics (2004): Shell characteristics of eggs from historic strains of single comb white leghorn chickens and relationship of egg of eggs from historic strains of single comb white leghorn chickens and relationship of egg shape to shell strength. International J. Poultry Sci. 3, 17-19.
shape to shell strength. International J. Poultry Sci. 3, 17-19. BARKER, R. C., S. L. DAVIS, D. R. MORBLE
BARKER, R. C., S. L. DAVIS, D. R. MORBLE (1962): A comparison of different methods of (1962): A comparison of different methods of measuring internal quality using eggs from 23 strains of Single Comb White Leghorns. Poultry measuring internal quality using eggs from 23 strains of Single Comb White Leghorns. Poultry Sci. 41, 1624-&.
Sci. 41, 1624-&.
BAUMGARTNER, J. (1994): Japanese quail production, breeding and genetics. World Poultry Sci. BAUMGARTNER, J. (1994): Japanese quail production, breeding and genetics. World Poultry Sci.
J. 50, 269 J. 50, 269-274.-274.
BAUMGARTNER, J., J. KONCEKOVA, J. BENKOVA, D. PESKOVICOVA, J. SIMENOVOVA, BAUMGARTNER, J., J. KONCEKOVA, J. BENKOVA, D. PESKOVICOVA, J. SIMENOVOVA, J. SCUKA (2008): Changes in egg quality traits associated with long-term selection for lower J. SCUKA (2008): Changes in egg quality traits associated with long-term selection for lower yolk cholesterol content in Japanese quail. Czech J. Anim. Sci. 53,
119-yolk cholesterol content in Japanese quail. Czech J. Anim. Sci. 53, 119-127.127.
FLETCHER, D. L., W. M. BRITTON, G. M. PESTI, A. P. RAHN, S. I. SAVAGE (1983): The FLETCHER, D. L., W. M. BRITTON, G. M. PESTI, A. P. RAHN, S. I. SAVAGE (1983): The
relationship of layer fl ock age and egg weight on egg component yields and solids content.
relationship of layer fl ock age and egg weight on egg component yields and solids content.
Poultry Sci. 62, 1800-1805. Poultry Sci. 62, 1800-1805.
FUNK, E. M. (1948): The relation of yolk index determined in natural position to the yolk index as FUNK, E. M. (1948): The relation of yolk index determined in natural position to the yolk index as
determined after separating the yolk from the albumen. Poultry Sci. 27, 367. determined after separating the yolk from the albumen. Poultry Sci. 27, 367.
GONZALEZ, M. (1995): Infl uence of age on physical traits of Japanese quail
GONZALEZ, M. (1995): Infl uence of age on physical traits of Japanese quail (Coturnix coturnix (Coturnix coturnix japonica)
japonica) eggs. Ann. Zootech. 44, 307-312. eggs. Ann. Zootech. 44, 307-312.
HAUGH, R. R. (1937): The Haugh unit for measuring egg quality. US Poultry Mag. 43, 552-573. HAUGH, R. R. (1937): The Haugh unit for measuring egg quality. US Poultry Mag. 43, 552-573. HEIMAN, V., J. S. CARVER (1936): The albumen index as a physical measurement of observed HEIMAN, V., J. S. CARVER (1936): The albumen index as a physical measurement of observed
egg quality. Poultry Sci. 15, 141-148. egg quality. Poultry Sci. 15, 141-148.
KONDAIAH, N., B. PANDA, R. A. SINGHAL (1983):
KONDAIAH, N., B. PANDA, R. A. SINGHAL (1983): I Internal egg-quality measure for quail eggs. nternal egg-quality measure for quail eggs. Indian J. Anim. Sci. 53, 1261-1264.
Indian J. Anim. Sci. 53, 1261-1264.
KOTAIAH, T., V. B. AVYAGARI, IQBALUDIN, S. C. MOHAPATRA (1975): Egg-quality traits as KOTAIAH, T., V. B. AVYAGARI, IQBALUDIN, S. C. MOHAPATRA (1975): Egg-quality traits as
affected by method of housing. Indian J. Poultry Sci. 10,
78-affected by method of housing. Indian J. Poultry Sci. 10, 78-84.84.
MINVIELLE, F., J. L. MONVOISIN, J. COSTA, A. FRENOT (1997):
MINVIELLE, F., J. L. MONVOISIN, J. COSTA, A. FRENOT (1997): Q Quail lines selected for egg uail lines selected for egg number based on pureline or crossbred performance. Proceedings of the 12
number based on pureline or crossbred performance. Proceedings of the 12thth Symposium on Symposium on
Current Problems in Avian Genetics (Aviagen), Pruhonice (Czech Republic). pp.
NAGARAJAN, S., D. NARAHARI, I. A. JAYAPRASAD, D. THYAGARAJAN (1991): Infl uence
NAGARAJAN, S., D. NARAHARI, I. A. JAYAPRASAD, D. THYAGARAJAN (1991): Infl uence
of stocking density and layer age on production traits and egg quality in Japanese quail. Brit. of stocking density and layer age on production traits and egg quality in Japanese quail. Brit. Poultry Sci. 32, 243-248.
Poultry Sci. 32, 243-248.
NARAYANANKUTTY, K., A. JALALUDEEN, A. RAMAKRISHNAN (1989): Effect of age on NARAYANANKUTTY, K., A. JALALUDEEN, A. RAMAKRISHNAN (1989): Effect of age on
quality characteristics of Japanese quail
quality characteristics of Japanese quail (Coturnix coturnix japonica)(Coturnix coturnix japonica) eggs. Cheiron 18, 97-98. eggs. Cheiron 18, 97-98.
NAZLIGUL, A., K. TURKYILMAZ, H. E. BARDAKÇIOGLU (2001): A study on some production NAZLIGUL, A., K. TURKYILMAZ, H. E. BARDAKÇIOGLU (2001): A study on some production traits and egg quality characteristics of Japanese quail. Turk. J. Vet. Anim. Sci. 25, 1007-1013. traits and egg quality characteristics of Japanese quail. Turk. J. Vet. Anim. Sci. 25, 1007-1013. ORHAN, H., C. ERENSAYIN, S. AKTAN (2001): Determining egg quality characteristics of ORHAN, H., C. ERENSAYIN, S. AKTAN (2001): Determining egg quality characteristics of
Japanese quails
Japanese quails (Coturnix coturnix japonica)(Coturnix coturnix japonica) at different ages. Hayvansal Üretim. 1, 44-49. at different ages. Hayvansal Üretim. 1, 44-49.
RI, E., K. SATO, T. OIKAWA, T. KUNIEDA, H. UCHIDA (2005):
RI, E., K. SATO, T. OIKAWA, T. KUNIEDA, H. UCHIDA (2005): Effects of dietary protein levels Effects of dietary protein levels on production and characteristics of Japanese quail eggs. J. Poultry Sci. 42, 130-139.
on production and characteristics of Japanese quail eggs. J. Poultry Sci. 42, 130-139. SACHDEV, A. K., S. D. AHUJA, R. GOPAL (1989): Feed consumption, egg production and SACHDEV, A. K., S. D. AHUJA, R. GOPAL (1989): Feed consumption, egg production and
egg-quality traits as infl uenced by cage-tier locations of Japanese quail. Indian J. Anim. Sci. 59,
quality traits as infl uenced by cage-tier locations of Japanese quail. Indian J. Anim. Sci. 59,
860-865. 860-865.
SAS INSTITUTE INC. (2010):
SAS INSTITUTE INC. (2010): The SAS System for Windows. Release 9.2.The SAS System for Windows. Release 9.2. TSERVENI-GOUSI, A. S.
TSERVENI-GOUSI, A. S. (1987):(1987): Relationship between parentel age, egg weight and hatching Relationship between parentel age, egg weight and hatching weight of Japanese quail. Brit. Poultry Sci. 28, 749-752.
weight of Japanese quail. Brit. Poultry Sci. 28, 749-752.
YANNAKOPOULOS, A. L., A. S. TSERVENI-GOUSI (1987): Effect of breeder quail age and egg YANNAKOPOULOS, A. L., A. S. TSERVENI-GOUSI (1987): Effect of breeder quail age and egg
weight on chick weight. Poultry Sci. 9, 1558-1560. weight on chick weight. Poultry Sci. 9, 1558-1560.
Received: 27 March 2012 Received: 27 March 2012 Accepted: 5 December 2012 Accepted: 5 December 2012 ________________________________________________________________________________________ ________________________________________________________________________________________
ZITA, L., Z. LEDVINKA, L. KLESALOVÁ
ZITA, L., Z. LEDVINKA, L. KLESALOVÁ:: UUččinak dobi japanskih prepelica na inak dobi japanskih prepelica na
određena obilježja kakvoće jaja i njihovi međusobni odnosi
određena obilježja kakvoće jaja i njihovi međusobni odnosi. Vet. arhiv 83, 223-232, . Vet. arhiv 83, 223-232, 2013.
2013.
Istražen je učinak dobi japanskih prepelica (
Istražen je učinak dobi japanskih prepelica (Coturnix coturnix japonicaCoturnix coturnix japonica) na odre) na određđena obilježja kvalitete ena obilježja kvalitete
njihovih jaja. Istraživanje je provedeno na sto prepelica. Prepelice su tijekom pokusa bile smještene u žičane njihovih jaja. Istraživanje je provedeno na sto prepelica. Prepelice su tijekom pokusa bile smještene u žičane kaveze (tri ženke po kavezu) i hranjene mješavinom s 11,2 MJ ME i 19,7% sirovih proteina. Hranu i vodu kaveze (tri ženke po kavezu) i hranjene mješavinom s 11,2 MJ ME i 19,7% sirovih proteina. Hranu i vodu dobivale su
dobivale su ad libitumad libitum. Jaja su bila sakupljana dva uzastopna dana tijekom . Jaja su bila sakupljana dva uzastopna dana tijekom ččetiri tjedna kad su prepelice bile u etiri tjedna kad su prepelice bile u
dobi od 9 to 49 tjedana. Ukupno je bilo pretraženo 2060 jaja. Dob prepelica značajno je utjecala na pokazatelje dobi od 9 to 49 tjedana. Ukupno je bilo pretraženo 2060 jaja. Dob prepelica značajno je utjecala na pokazatelje kvalitete jaja osim na oblik i boju žumanjka. Brzo povećanje mase jaja ustanovljeno je u početnoj fazi nesenja. kvalitete jaja osim na oblik i boju žumanjka. Brzo povećanje mase jaja ustanovljeno je u početnoj fazi nesenja. Najveća masa (13,02 g) bila je dostignuta u dobi od 25 tjedana, a potom se postupno smanjivala sve do kraja Najveća masa (13,02 g) bila je dostignuta u dobi od 25 tjedana, a potom se postupno smanjivala sve do kraja razdoblja leženja odnosno do dobi od 49 tjedana. Unatoččestim kolebanjima, indeks bjelanjka, masa bjelanjka, razdoblja leženja odnosno do dobi od 49 tjedana. Unatoččestim kolebanjima, indeks bjelanjka, masa bjelanjka, proporcija bjelanjka, vrijednosti Haughove jedinice, masa ljuske i čvrstoća ljuske smanjivali su se s povećanjem proporcija bjelanjka, vrijednosti Haughove jedinice, masa ljuske i čvrstoća ljuske smanjivali su se s povećanjem dobi, dok su se proporcija žumanjka i proporcija ljuske povećavali s dobi prepelica. Masa jajeta bila je u dobi, dok su se proporcija žumanjka i proporcija ljuske povećavali s dobi prepelica. Masa jajeta bila je u pozitivnoj korelaciji (P≤0,001) s masom žumanjka (0,70), masom bjelanjka (0,90), i masom ljuske (0,58). pozitivnoj korelaciji (P≤0,001) s masom žumanjka (0,70), masom bjelanjka (0,90), i masom ljuske (0,58). Omjer Haughove jedinice bio je u pozitivnoj korelaciji s indeksom bjelanjka (0,94; P≤0,001).
Omjer Haughove jedinice bio je u pozitivnoj korelaciji s indeksom bjelanjka (0,94; P≤0,001). Ključne riječi:
Ključne riječi: japanska prepelica, dob, žumanjak, bjelanjak, ljuska jajeta japanska prepelica, dob, žumanjak, bjelanjak, ljuska jajeta
________________________________________________________________________________________ ________________________________________________________________________________________