Mechanical properties of functionally graded hierarchical bamboo structures
T. Tan
a,b, N. Rahbar
c, S.M. Allameh
d, S. Kwofie
e, D. Dissmore
a,b, K. Ghavami
f, W.O. Soboyejo
b,g,⇑ aDepartment of Civil and Environmental Engineering, Princeton University, Princeton, NJ 08544, USAbPrinceton Institute for the Science and Technology of Materials, Princeton University, Princeton, NJ 08544, USA
cDepartment of Civil and Environmental Engineering, University of Massachusetts Dartmouth, North Dartmouth, MA 02747, USA dDepartment of Physics and Geology, Northern Kentucky University, Highland Heights, KY 41099, USA
eDepartment of Materials Engineering, Kwame Nkrumah University of Science and Technology, Kumasi, Ghana fDepartment of Civil Engineering, Pontifical Catholic University, Rio de Janeiro, Brazil
gDepartment of Mechanical and Aerospace Engineering, Princeton University, Princeton, NJ 08544, USA
a r t i c l e
i n f o
Article history: Received 7 March 2011
Received in revised form 25 May 2011 Accepted 7 June 2011
Available online xxxx
Keywords: Bamboo
Mechanical properties Young’s moduli Strength
Resistance curve behavior
a b s t r a c t
This paper presents the results of a series of multi-scale experiments and numerical models concerning the mechanical properties of moso culm functionally graded bamboo structures. On the nano- and micro-scales, nanoindentation techniques are used to study the local variations in the Young’s moduli of moso culm bamboo cross-sections. These are then incorporated into finite element models in which the actual variations in Young’s moduli are used to model the deformation and fracture of bamboo during fracture toughness experiments. Similarly, the measured gradations in moduli are incorporated into crack bridg-ing models that predict the toughenbridg-ing observed durbridg-ing resistance curve tests. The implications of the results are discussed for the bio-inspired design of structures that mimic the layered, functionally graded structure of bamboo.
!2011 Acta Materialia Inc. Published by Elsevier Ltd. All rights reserved.
1. Introduction
In recent years there has been increasing interest in and re-search into the use of bamboo as an eco-friendly material in a wide range of applications in engineering and in civil construction[1–3]. These include application as scaffolding[1], fiber-reinforced com-posites[2], and bridges[3]. Bamboo has also been used for the fab-rication of bicycles[4]due to its efficient combination of strength and stiffness to weight ratio, besides its hollow tube form structure and relatively high shape factors[2], which are important for the structural design of high strength structures in bending and torsion.
Significant research has been carried out recently on the phys-ical and basic macro-mechanphys-ical properties of bamboo[5–11]. Ear-lier work by Ghavami et al.[11]identified the functionally graded distributions of fibers in bamboo. Gradations were observed in the longitudinal and radial directions. Bamboo in its natural habitat acts as a cantilever beam with a fixed support in the earth and sub-jected to its own weight and wind load. Therefore, it has a naturally optimized structure to resist bending moments. The strengths are highest along the outside and lowest in the inside surfaces,
respectively. In general the strengths are also highest in those sec-tions closer to the ground.
There have also been few prior studies of the fracture and tough-ening mechanisms in bamboo structures [12,13]. These studies have shown that bamboo is susceptible to inter-laminar fracture, but the effects of bridging mechanisms have not been quantified.
Furthermore, the effects of microstructure on the micromecha-nisms of crack growth have not been studied in detail for any spe-cies of bamboo prior to this investigation.
This paper presents the results of a combined experimental, theoretical and computational study of crack growth and toughen-ing mechanisms in the species moso (Phyllostachys pubescens) culm bamboo. Nanoindentation techniques are used to identify the vari-ations in the Young’s moduliEalong the functionally graded struc-ture of bamboo. Predictions of resistance curve behavior obtained from mechanism-based crack bridging models are shown to be in good agreement with the experimental measurements obtained from fracture mechanics experiments in which the cracking driv-ing forces are computed usdriv-ing analytical solutions and/or a finite element method. The implications of the results are then discussed for the bio-inspired design of functionally graded structures.
2. Materials
Moso (P. pubescens) culm bamboo specimens were obtained from Pontifícia Universidade Católica, Rio de Janeiro, Brazil. The
1742-7061/$ - see front matter!2011 Acta Materialia Inc. Published by Elsevier Ltd. All rights reserved. doi:10.1016/j.actbio.2011.06.008
⇑ Corresponding author at: Princeton Institute for the Science and Technology of Materials, Princeton University, Princeton, NJ 08544, USA. Tel.: +1 609 258 5609.
E-mail address:[email protected](W.O. Soboyejo).
Contents lists available atScienceDirect
Acta Biomaterialia
j o u r n a l h o m e p a g e : w w w . e l s e v i e r . c o m / l o c a t e / a c t a b i o m a t
bamboo samples were prepared from culms cut from a plantation of about 5 years of age. Samples were cut from the bottom to the top of the culm. Since microstructural information is required for an understanding of the fracture properties and toughening mech-anisms in bamboo transverse cross-sections of the moso culm bamboo were cut and diamond polished down to a 10
l
m surface finish. The polished samples were examined under a Motic model DM-52 optical microscope (National Instruments, Austin, TX). This revealed a graded distribution of vascular bundles of hemicellu-lose/cellulose fibers in a matrix of lignin, as shown inFig. 1.Most significantly, the mesostructure was highly graded, with the volume fraction of the fibers in the bamboo culm increasing from the ground to the top[11]. The volume fraction of fibers also increases across the thickness of the bamboo culm, from the out-side to inout-side surface. InFig. 1three regions in the cross-section of the fiber density can be seen. The regions are classified as: (a) high fiber density (at and near the outside surface); (b) low fiber density (at and near inside surface); (c) medium fiber density (be-tween regions (a) and (b)).
The microstructural features of the fiber bundles were charac-terized using a Dimension 3100 atomic force microscope (Bruker Instruments, Kennewick, WA) [14,15]. Prior to atomic force microscopy (AFM) analyses, the samples were diamond polished down to 1
l
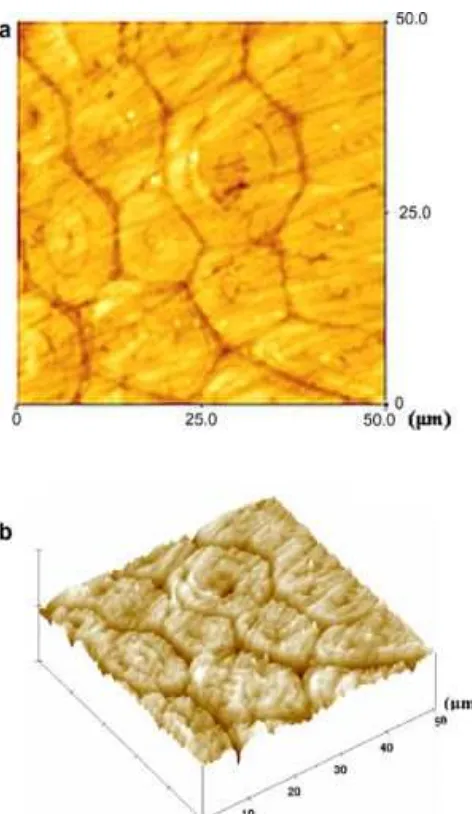
m surface finish. The surface morphologies of the sam-ples were then characterized in tapping mode. Both two -dimensional (2-D) and three-dimensional (3-D) images were ob-tained, as shown inFig. 2. The 2-D and 3-D images reveal a struc-ture that consists of individual fibers in the vascular bundles. The surface topography of the region that was examined had a root mean square (RMS) roughness of!14.3 nm.3. Experimental procedures
3.1. Nanoindentation
Nanoindentation experiments[16–18]were used to measure the Young’s moduli across the moso culm bamboo cross-section. These employed a TriboScope Nanomechanical Testing System (Hysitron Inc., Minneapolis, MN) with a cube corner tip[19]. Before starting the experiments the tip area function was calibrated by performing nanoindentation tests on quartz, which exhibits size-independent moduli.
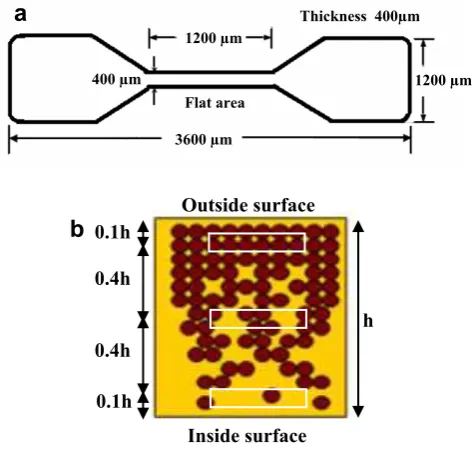
Nanoindentation experiments were then performed on polished cross-sections of bamboo samples. A matrix was adopted for the nanoindentation geometry with 10 points in a row of in the tan-gential direction and five rows along the radial direction (Fig. 3a and b). The tests were performed under load control. Contact mode AFM scans were obtained before and after each indentation point. A load–depth curve was also recorded accordingly. A maximum force of 700
l
N, reached after about 5 s, was applied during the indentation process. Following a 2 s holding period the load was decreased to 0, also over 5 s.The Young’s moduli and hardness data were extracted from plots of load versus displacement in the unloading region. The hardnessHand Young’s moduliEwere defined as[19]:
H¼Fmax
Ap
ð1Þ
E¼1 b
ffiffiffiffi
p
p2 1
ffiffiffiffiffi Ap p
dP
dh ð2Þ
whereFmaxis the maximum load,Apis the projected contact area,b
is a geometrical constant, which is 1.034 for a cube corner tip[19], and dP/dHis the initial stiffness in the unloading region.
3.2. Micro-tensile testing
Although prior researchers have measured the tensile proper-ties of bamboo[20–22], there have been very few previous inves-tigations to measure the microtensile properties of plies within the bamboo. The ply properties of the moso culm bamboo structure were, therefore, measured using an Instron model 5878 (Canton, MA) microtester. Bamboo slices were first obtained along the lon-gitudinal direction. Then they were separated with equal space in the cross-section using a cutting machine. Finally, dog bone shaped
Fig. 1.An optical image of the functionally graded mesostructure of bamboo.
Fig. 2.Atomic force microscopy (AFM) images: (a) 2-D surface image of vascular bundles; (b) 3-D surface image of vascular bundles.
specimens used for tensile experiment were machined from these bamboo slices as inFig. 4a and b. Samples with high, medium and low fiber density regions were fabricated. The specimens were loaded continuously to failure at a displacement rate of 0.01 mm s%1. The tensile tests were performed three times for
specimens from the low, medium and high density regions. The
resulting force–displacement data were then recorded on a computer.
3.3. Resistance curve experiment
In order to understand the resistance curve behavior for moso culm bamboo four point bending experiments were carried out on single edge notched bend (SENB) specimens[23]with dimen-sions of 4.2&4.0&40.0 mm. A loading span of 18 mm was used. The SENB specimens had initial notch to width ratios a/W of
!0.45 (Fig. 5a). In order to explore the resistance behavior along different orientations the specimens notched on the outside sur-face orthogonal to the fiber orientation are referred to as ‘‘outside crack’’, while those notched on the inside surface orthogonal to the fiber orientation are referred to as ‘‘inside crack’’. Specimens notched on the side surface orthogonal to the fiber orientation are referred to as ‘‘side crack’’.
The four point bending tests[23]were performed using an In-stron model 5878 (Canton, MA) servo-hydraulic testing machine. The tests were operated under displacement control with a loading rate of 0.01 mm s%1. A Celestron (Torrrance, CA) digital microscope [24]was used to obtain in situ videos of crack growth and crack/ material interactions, which produced the resistance curves from measurements of load and crack extension.
4. Modeling
4.1. Finite element method
The finite element method[25,26]was used to calculate the en-ergy release rates for SENB specimen crack geometries. Using the
Fig. 3.Schematics of (a) the samples prepared from bamboo and (b) cross-section of the samples and nanoindentation matrix.
1200 µm 1200 µm
Flat area
3600 µm 400 µm
Thickness 400µm
Outside surface
Inside surface
0.1h
0.4h
0.4h
0.1h
h
a
b
Fig. 4.(a) A schematic of the dog bone tensile test sample. (b) A schematic of microtensile sample locations (samples are fabricated along the fiber orientations).
T. Tan et al. / Acta Biomaterialia xxx (2011) xxx–xxx
ABAQUS™ software package (Simulia, Warwick, RI) a 2-D model with elements (CPE8) [26] was established. The crack tip zone was distributed with collapsed elements (CPE6M)[26]to capture the stress concentrations around the crack tip. Due to its symmetry
only half of the four point bending specimen was modeled. A sym-metrical condition was also enforced to inhibit horizontal displace-ment along the center line. A roller support was applied to fix the vertical displacement. No tractions were applied on the crack sur-faces. The finite element simulations were based on actual loads that were applied and the crack lengths obtained on video during the resistance curve experiments, respectively. Also, in order to analyze the effect of functional graded moduli on the energy re-lease rates a 10 layer model was used with varying Young’s moduli obtained from the nanoindentation experiments. The finite ele-ment simulations were used to calculate the crack driving forces
Gusing the stress contours around the crack tip[26].
4.2. Analytical solutions
Charalambides et al.[27]have studied the fracture resistance of bi-material interfaces, as shown inFig. 5b. They proposed an ana-lytical solution for the energy release rate for interfacial crack geometries between biomaterial specimen geometries tested un-der four point bending. This gives the energy release rate of the de-flected crack along the interface as:
G¼M
2ð1
%
t
2 2Þ2E2
1
I2
%k
Ic
" #
ð3Þ
where
M¼ Pl
2b ð4Þ
k¼E2ð1%
t
2 1Þ E1ð1%
t
22Þð5Þ
Ic¼
h31
12þk
h32
12þk
h1h2ðh1þh2Þ2
4ðh1þkh2Þ
ð6Þ
I2¼ h32
12 ð7Þ
Fig. 5.(a) Schematics of the four point bending sample from the outside, inside and side crack orientations. (b) A schematic of the experimental set-up and beam cross-section for the four point bending experiment.
Fig. 6.The Young’s moduli distribution along the radial direction of the bamboo cross-section.
wherePis the applied load,lis the spacing between inner and outer load lines,bis the thickness of the beam,E1andE2are the Young’s
moduli for materials 1 and 2,
t
1andt
2are the Poisson ratios ofmaterials 1 and 2, andh1 andh2 are the heights of materials 1
and 2. Hence, using Eq.(3)it can be shown that the energy release rate is related to the load but not the crack length.
The entire functionally graded beams were treated as two layer beams with different elastic moduli in the analytical modeling. In this model h is the height of the four point SENB sample. h1,
the notch length, is 0.45h. h2 is equal to 0.55h. Samples with
side notches were treated as one layer beams with uniformly effec-tive elastic moduli. The effeceffec-tive modulus is obtained by applying the basic composite materials principles for orthotropic materials
[23].
4.3. Toughening models
Since crack bridging was observed in the outside, inside and side cracked samples the role of crack bridging was modeled using an idealized elastic–plastic spring model, proposed originally by Budiansky et al.[28], and used by Li and Soboyejo[29]and Kung et al.[30]to study toughening due to small scale bridging (SSB). A large scale bridging model developed by Bloyer et al.[31,32], used in an earlier work by Lou and Soboyejo[33]and Savastano et al.[34], was used to estimate the toughening due to large scale bridging (LSB) effects.
For SSB, in which the size of the bridging zone is much smaller than the crack length (bridge length60.5 mm)[28], ductile phase
toughening may be expressed in terms of the maximum stress intensity factor that the material can sustain before failure. The fracture toughness of the compositeKccan also be expressed as
the sum of the matrix fracture toughnessKmand the toughening
due to SSBDKSSB. This gives:
where
a
is the constraint/triaxiality factor (taken to be 1 in this study)[28,29],Vfis the volume fraction of the ductile phase,Listhe length of the ridging ligament,
r
yis the uniaxial yield stress,andxis the distance from the crack tip.
For LSB the toughening due to ligament bridging is given by
[31,32]:
D
KLSB¼VfZ L
0
ar
yhða;xÞdx ð9Þwhereh(a,x) is the weight function for the bridging tractions given by Fett and Munz[35]. This is given by:
where the coefficientsAtlare given in Fett and Munz[35]for a SENB specimen. Hence, for LSB the fracture toughness of the com-posite bamboo structure is given by:
Kc¼Kmþ
D
KLSB ð11ÞOnceKcis obtained the energy release rate can be obtained as:
Gc¼
composite plane strain Young’s moduli,
m
is the Possion ratio,Ecisthe composite Young’s moduli, andDKis the toughening contribu-tions from either SSB or LSB models.
5. Results and discussion
5.1. Functionally graded Young’s moduli
The nanoindentation results for Young’s moduli distributions along the radial direction of the bamboo cross-sections are pre-sented in Fig. 6. These were obtained from load–depth curves of the type shown in Fig. 7a. Note that residual indentations remained on the surface of the bamboo after the indenter was removed (Fig. 7b). The surface profiles of these residual indenta-tions were analyzed using a Dimension 3100 atomic force micro-scope. In each case 50 indents were obtained within a matrix of width 1000
l
m&length 4500l
m. 10 points are evenly located across the width, and five rows are located along the length. The nanoindentation results show that the Young’s modulus de-creases with increasing radial distance from the outside surface. This is consistent with the fiber density distribution presented inFig. 1.a
b
Fig. 7.(a) A typical load–depth curve of nanoindentation for a bamboo section. (b) A typical 3-D graph showing the indented spot on the bamboo cross-section.
T. Tan et al. / Acta Biomaterialia xxx (2011) xxx–xxx
5.2. Tensile strength
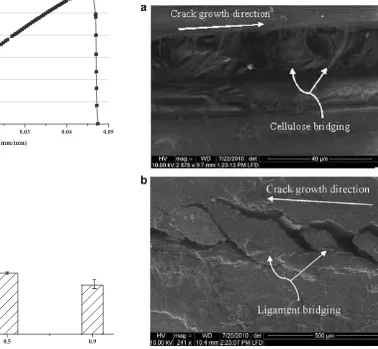
A representative stress–strain curve from the microtensile tests is shown inFig. 8a. The ultimate tensile strength measurements are shown inFig. 8b. The results also show that the tensile strength degradation corresponds to the fiber density degradation. Hence, the highest strengths correspond to the regions closest to the out-side surface with the highest fiber densities, while the lowest strengths correspond to the regions farthest from the outside sur-faces with the lowest fiber densities. The regions in between had intermediate strengths.
5.3. Resistance curve behavior
Typical crack/microstructure interactions observed in the experiments are presented inFig. 9a and b for crack growth in the three microstructural configurations that were examined. In the case of the outside and inside crack samples cellulose bridging was the primary toughening mechanism (Fig. 9a). However, tough-ening in the side sample occurred largely by ligament shielding (Fig. 9b).
Modest rising resistance curve behavior was observed in all cases. The crack growth shown in the resistance curves corresponds to deflected crack growth along the interlaminar
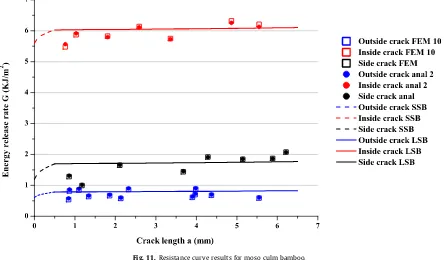
boundaries in the outside, inside and side specimens. In all cases the in situ observations of crack geometry were incorporated into finite element models that were used to compute the energy re-lease rates. Representative symmetrical finite element models with deflected crack segments are presented inFig. 10a and b. A web mesh area (Fig. 10b) is applied to capture the butterfly stress con-tours around the crack tip within graded elastic moduli between the layers. The energy release rates computed using the finite ele-ment simulations are presented inFig. 11using hollow symbols. The energy release rates from the analytical model (Eq.(3)) are also presented inFig. 11, using solid symbols. The analytical and finite element results were generally in very good agreement with each other.
The inside crack samples exhibited the highest resistance curve behavior, while the outside crack samples had the lowest resis-tance curve behavior. The side crack samples tested had intermedi-ate resistance curve behavior that was in between the inside and outside crack specimens. This will be shown in the next section to be due to the effects of crack tip shielding.
5.4. Crack tip shielding
In the case of crack growth in the outside and inside crack ori-entations cellulose bridging fibers are associated with the toughen-ing mechanism. A lower cellulose bridgtoughen-ing fiber density was observed within the interlaminar cracks in the outside crack orien-tation. In contrast, the higher cellulose bridge densities in the in-side crack orientation were associated with strong resistance
a
b
Fig. 8.(a) A representative stress–strain curve for the bamboo microtensile experiment. (b) Tensile strength of the outside, side and inside specimens.
Fig. 9.Crack growth for moso culm bamboo. (a) SEM image of cellulose bridging in the outside crack SENB sample. (b) SEM image of ligament bridging in the side crack SENB sample.
curve behavior. This explains why bamboo structures tend to split from the inside to the outside, along a gradient of decreasing local fracture resistance.
For crack growth along the side orientation the resistance curve behavior is in between that observed for the inside and outside conditions (Fig. 11). The intermediate resistance curve behavior is associated with toughening by ligament bridging by lignin-based microcomposites, as shown in Fig. 9b. Such lignin or ligament bridging results in only modest toughening due to the modest strength of the bridging ligaments observed in this condition.
Predicted estimates of the toughening levels associated with different crack growth orientations are presented inFig. 11. These were obtained from Eq.(12)for SSB and LSB. The parameters ap-plied in the SSB and LSB models are summarized inTable 1. They show trends that are consistent with the trends observed in the
experimental resistance curves. The combination of SSB and LSB models, therefore, appears to capture the trends in the measured resistance curves for crack growth in the different orientations that were examined in this study. However, it is also important to note that most of the toughening was associated with the ‘‘initiation toughness’’ in all three cases.
5.5. Implications
The implications of the results are quite significant. First, they show that the microstructural requirements for improved strength and deformation resistance in bamboo structures are different from those required for improved toughening and resistance curve behavior. Hence, the reduced matrix spacing in regions with high fiber densities results in lower overall toughening, while the lower fiber densities in the inside regions result in greater overall tough-ening. Intermediate resistance curve behavior bridging is associ-ated with intermediate toughening levels due to the lignin matrix or ligament/cellulose fiber composites.
The results presented here would, therefore, suggest that the anisotropy in strength and fracture resistance of bamboo is taken into account in the design of structures using bamboo.
There is also the potential to use bamboo as the basis for the bio-inspired design of future eco-friendly synthetic composite materials. The results of this investigation show that there is a need for intensive research into the detailed behavior of many spe-cies of bamboos existing in abundance in tropical and subtropical parts of the world. The findings of cellulose bridging and ligament bridging may also explain the superior mechanical properties of other biological materials, such as seashells [36,37]. Therefore,
Fig. 10.(a) An ABAQUS deformed finite element mesh for the symmetrical SENB crack model during the four point bending test. (b) The stress concentration contour around the crack tip under the registered loads and crack lengths.
Fig. 11.Resistance curve results for moso culm bamboo.
Table 1
Fiber properties used in both SSB and LSB models.
a ry(MPa) Vf
Outside crack 1.0 620 0.12
Side crack 1.0 250 0.35
Inside crack 1.0 220 0.22
T. Tan et al. / Acta Biomaterialia xxx (2011) xxx–xxx
there are challenges for the future which could contribute effec-tively to ecological and sustainable development.
6. Conclusions
Moso culm bamboo has a multi-scale, hierarchical and func-tionally graded structure.
On the macro scale the structure consists of a hollow tube with micron-scale fiber bundles that are organized into functionally graded structures. Between the nano and micron scales individual fibers are organized into fiber bundles in a lignin matrix.
Within individual plies notch-induced crack growth occurs by deflection into the interlaminar boundaries. In the outside and in-side crack orientations mixed mode interfacial crack growth occurs with a high incidence of cellulose bridging. However, in the side crack orientation crack growth occurs with a significant incidence of ligament or lignin/cellulose composite bridging.
The stronger outside regions with higher fiber densities result in lower levels of crack tip shielding with a lower incidence of cel-lulose crack bridging. In contrast, the weaker inside regions with lower fiber densities result in higher levels of crack tip shielding with a higher incidence of cellulose crack bridging. Intermediate toughening and resistance curve behavior is associated with crack growth in the side orientation, where crack tip shielding occurs via ligament bridging.
Acknowledgements
This work was supported by the Princeton University Grand Challenges Program, the Division of Civil and Mechanical Science Foundation (Grant No. CMS 0303492) and the Division of Materials Research of the National Science Foundation (Grant No. DMR 0231418). The authors are grateful to the Dr. Clark Cooper, Dr. Jorn Larsen-Basse and Dr. Carmen Huber for their encouragement and support. Appreciation is also extended to Dr. Nan Yao and Mr. Ger-ald Poirier (in the Imaging and Analyses Center of Princeton Insti-tute for the Science and Technology of Materials) for their assistance with microstructure characterization techniques.
Appendix A. Figures with essential color discrimination
Certain figures in this article, particularly Figs. 1–5, 7, 10 and 11, are difficult to interpret in black and white. The full color images
can be found in the on-line version, at doi:10.1016/
j.actbio.2011.06.008).
References
[1] Lo TY, Cui HZ, Tang PWC, Leu HC. The effect of fiber density on strength capacity of bamboo. Construct Build Mater 2008;22(7):1532–5.
[2] Ghavami K. Bamboo as reinforcement in structural concrete elements. Cem Concr Compos 2005;27:637–49.
[3] Xiao Y, Zhou Q, Shan B. Design and construction of modern bamboo bridges. J Bridge Eng 2010;15(5):533–41.
[4] Johnson S. Reinventing the wheel. The Daily Princeton 2008. Available at: <http://www.dailyprincetonian.com/2008/04/24/20982/>.
[5] Chung KF, Yu WK. Mechanical properties of structural bamboo for bamboo scaffoldings. Eng Struct 2002;24:429–42.
[6] Amada S, Ichikawa Y, Munekata T, Nagase Y, Shimizu H. Fiber texture and mechanical graded structure of bamboo. Compos Part B 1997;28:13–20.
[7] Gibson LJ, Ashby MF, Karam GN, Wegst U, Shercliff HR. The mechanical properties of natural materials. II. Microstructures for mechanical efficiency. Proc R Soc Lond A 1995;450:141–62.
[8] Ray AK, Mondal S, Das SK, Ramachandrarao P. Microstructural characterization of bamboo. J Mater Sci 2004;39:1055–60.
[9] Silva ECN, Walters MC, Paulino GH. Modeling bamboo as a functionally graded material: lessons for the analysis of affordable materials. J Mater Sci 2006;41:6991–7004.
[10] Li XB. Physical, chemical, and mechanical properties of bamboo and its utilization potential for fiberboard manufacturing. Masters thesis, Louisiana State University, 2004.
[11] Ghavami K, Rodrigues CS, Pacionik S. Bamboo: functionally graded composite material. Asian J Civil Eng 2003;4:1–10.
[12] Amada S, Untao S. Fracture properties of bamboo. Compos Part B 2001;32:451–9.
[13] Shao ZP, Fang CH, Tian GL. Mode I interlaminar fracture property of moso bamboo (Phyllostachys pubescens). Wood Sci Technol 2009;43:527–36. [14] Digital Instruments VMG. Force Imaging: Support Note No. 228, Rev. E. Santa
Barbara, CA: Digital Instruments, 1999.
[15] Fang HX, Sun JY, Zhang L. Characterization of bamboo cellulose-based green composite film by NMMO technology. Front For China 2008;3(4):514–7. [16] Zou LH, Jin H, Lu WY, Li XD. Nanoscale structural and mechanical
characterization of the cell wall of bamboo fibers. Mater Sci Eng C 2009;29:1375–9.
[17] Baker SP. Between nanoindentation and scanning force microscopy: measuring mechanical properties in the nanometer regime. Thin Solid Films 1997;308:289–96.
[18] Bobji MS, Biswas SK. Estimation of hardness by nanoindentation of rough surfaces. J Mater Res 1998;13(11):3227–33.
[19] Hysitron Inc.. TriboScope user manual. Minneapolis, MN: Hysitron Inc.; 2010. [20] Ray AK, Mondal S, Das SK, Ramachandrarao P. Bamboo – a functionally graded composite–correlation between microstructure and mechanical strength. J Mater Sci 2005;40:5249–53.
[21] Nogata F, Takahashi H. Intelligent functionally graded material: bamboo. Compos Eng 1996;5(7):743–51.
[22] Deshpande AP, Rao MB, Rao L. Extraction of bamboo fibers and their use as reinforcement in polymeric composites. J Appl Polym Sci 2000;76(1):83–92. [23] Soboyejo WO. Mechanical properties of engineered materials. New
York: Marcel Dekker; 2003.
[24] Celestron Inc.. Celestron digital microscope 44300 manual. Torrance, CA: Celestron Inc.; 2010.
[25] Zienkiewicz OC, Taylor RL. The finite element method. New York: Butterworth Heinemann; 2005.
[26] Simulia A. Abaqus manual. Providence, RI: Simulia Inc.; 2010.
[27] Charalambides PG, Lund J, Evans AG, McMeeking RM. A test specimen for determining the fracture resistance of bimaterial interfaces. J Appl Mech 1989;56:77–82.
[28] Budiansky B, Amazigo JC, Evans AG. Small-scale crack bridging and the fracture toughness of particulate-reinforced ceramics. J Mech Phys Solids 1988;36(2):167–87.
[29] Li M, Soboyejo WO. An investigation of the effects of ductile-layer thickness on the fracture behavior of nickel aluminide microlaminates. Metall Mater Trans A 2000;31A(5):1385–99.
[30] Kung E, Mercer C, Allameh S, Popoola O, Soboyejo WO. An investigation of fracture and fatigue in a metal/polymer composite. Metall Mater Trans A 2001;32A(8):1997–2010.
[31] Bloyer DR, Rao KTV, Ritchie RO. Fracture toughness and R-curve behavior of laminated brittle-matrix composites. Metall Mater Trans A 1998;29A(10):2483–96.
[32] Bloyer DR, Rao KTV, Ritchie RO. Fatigue-crack propagation behavior of ductile/ brittle laminated composites. Metall Mater Trans A 1999;30A(3):633–42. [33] Lou J, Soboyejo WO. An investigation of the effects of loading rate on resistance
curve behavior and toughening in cast lamellar gamma-based titanium aluminides. Metall Mater Trans A 2001;32A(2):325–37.
[34] Savastano Jr H, Santos SF, Radonjic M, Soboyejo WO. Fracture and fatigue of natural fiber-reinforced cementitious composites. Cem Concr Compos 2009;31(4):232–43.
[35] Fett T, Munz D. Stress intensity factors and weight functions for one dimensional cracks, Report KfK 5290. Karlsruhe: Institut fur Materialforschung; 1994.
[36] Li XD, Nardi P. Micro/nanomechanical characterization of a natural nanocomposite material–the shell of Pectinidae. Nanotechnology 2004;15:211–7.
[37] Li XD. Nanoscale structural and mechanical characterization of natural nanocomposites: seashells. JOM 2007;59(3):71–4.