9TH IGRSM International Conference and Exhibition on Geospatial & Remote Sensing, Page i 24th-25th April 2018, Berjaya Times Hotel, Malaysia
PARALLEL SESSION SCHEDULE
Day 1: Tuesday, 24 April 2018 (Parallel Session 1)
Time : 14:30-16:30
Theme :
1A: Geospatial I
ID TITLE AUTHORS COUNTRY
PID5
Regional geological mapping in Northern
Victoria Land, Antarctica using
multispectral remote sensing satellite data
Amin Beiranvand Pour,
Yongcheol Park, Mazlan
Hashim and Jong Kuk
Hong
Malaysia
PID10 Discovering of high potential zones for gold
mineralization using remote sensing satellite
data: Mersing, Johor Bahru, SE Malaysia
Amin Beiranvand Pour
and Mazlan Hashim
Malaysia
PID46
Generating the digital elevation model
through aerial technique
Faiz Arif, Khairul Nizam
Abdul Maulud and Abdul
Aziz Ab Rahman
Malaysia
PID79
The role of geospatial technology in plant
pests and diseases: an overview
Norraisha Md Sabtu,
Nurul Hawani Idris and
Mohamad Hafis Izran
Ishak
Malaysia
PID117
Urban growth pattern with urban flood and
temperature vulnerability using AI: a case
study of Delhi
Gaurav Singh, Shafia
Ahmad and Bharath H.
Aithal
India
PID129
Topological information from buildings in
CityGML
Syahiirah Salleh and
Uznir Ujang
Malaysia
PID147
The effect of reclamation land on water
clarity using remote sensing
PID171
Human elicited features in retail site
analytics
Hui-Jia Yee, Choo-Yee
Ting and Chung Ching
Ho
9TH IGRSM International Conference and Exhibition on Geospatial & Remote Sensing, Page ix 24th-25th April 2018, Berjaya Times Hotel, Malaysia
Day 2: Wednesday, 25 April 2018 (Parallel Session 3)
Time : 11.00
–
13:00
Theme :
3A: Oil Palm Special Session II
ID TITLE AUTHORS COUNTRY
PID70
Integrating radar and optical remote sensing
data for effective mapping of oil palm
plantation in Malaysia
Kasturi Devi
PID42
Sentinel-2 time series analysis to monitor oil
palm plantation extension in Indonesia
Christine Pohl,
PID45
Supporting smallholder oil palm plantation
management by open source GIS
Christine Pohl,
PID75
Estimation the age of oil palm based on
optical remote sensing image in Landak
Regency, West Kalimantan Indonesia
estimating aboveground biomass of oil palm
in Peninsular Malaysia
PID95
A multi-level convolutional neural network
based oil palm tree detection method for
high-resolution remote sensing images
Weijia Li, Haohuan
Fu and Le Yu
China
PID150
Oil palm bio-physical suitability assessment
in Indonesia and Malaysia over 2003-2015
Pegah Hashemvand
Khiabani and
Wataru Takeuchi
Japan
PID184
Flood inundation modelling in oil palm
plantation for water management analysis
Siti Hajar Md Nor
Azam
9TH IGRSM International Conference and Exhibition on Geospatial & Remote Sensing Page 1 24th-25th April 2018, Berjaya Times Hotel, Malaysia
9TH IGRSM International Conference and Exhibition on Geospatial & Remote Sensing Page 43 24th-25th April 2018, Berjaya Times Hotel, Malaysia
PID75
Estimation the age of oil palm based on optical remote sensing image in
Landak Regency, West Kalimantan Indonesia
Anggun Tridawati
1, Soni Darmawan
2, Armijon
11
optical remote sensing image. We used Landsat 8 Operational Land Imager (OLI) to estimate the
age of oil palm. The approach used in this study was to analyze the relationship between NDVI
(Normalized Difference Vegetation Index) and age of oil palm in variation of age by using
logarithmic regression. Methodology consist on collecting of Landsat 8 OLI, radiometric and
geometric correction, regression, and estimating the age of oil palm. The study shows that NDVI
have positive correlation which R2 = 0,66 and equation y = 0,0425 ln (x)+0,7322 means the
higher NDVI value the higher the age. The result of this study show that the majority of age in
the study area is 0-5 years.
Based on Figure 1 we can see that oil palm production in Landak Regency is increasing every year. The abundance of oil palm production makes an urgent need for monitoring the activities of oil palm plantations. Oil palm fields have patterns and textures that are different from other objects located in the area. When compared with the surrounding objects, this oil palm plantation has a pattern that is in groups and lined regularly [6]. The oil palm pattern makes it distinguish from the other plant in satellite imagery. Remote sensing is a proven method that can be used in monitoring agricultural areas [7]. It also can assist in making decisions about the management of oil palm plantations [2].
1. Introduction
2
Figure 1. Area and production of oil palm in 2014-2016 [3]
Oil palm age is one of the factors that support the growth and production process of oil palm [4]. The oil palm age also have the potential to be used in precision farming whereas the collecting oil palm data is relatively time consuming and costly [5]. Several studies have been conducted to map the oil palm age by previous studies [5,8,9,10,11,12 ,13,14]. [5] used remote sensing technology to investigate the oil palm age based on UK-DMC 2 and ALOS PALSAR image. [5] found that oil palm age is an important factors influencing fruit bunches production. [13] utilized Landsat 8 OLI remote sensing image for mapping oil palm age by using infrared index method, the result on this study is there is correlation of Infrared Index with = 0,816. [14] conducted a study of several vegetation index in mapping the composition of the canopy cover of oil palm plantation followed by tasselled cap transformation.
The aims in this study are to analyse the relationship between NDVI (Normalized Difference Vegetation Index) and oil palm age in variation of age by using logarithmic regression and to estimate the distribution of oil palm age.
2. Materials and Methods
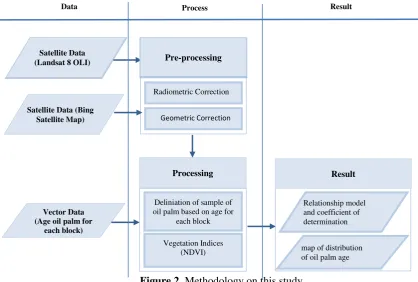
Methodology on this study are collecting of Landsat 8 OLI, vector data of oil palm age, and bing satellite map, preprocessing divided into two corrections they are radiometric and geometric correction, making of regions of interest for each of oil palm age, making of relationship analysis between NDVI and oil palm age, and estimating of oil palm age. Methodology on this study can be seen on Figure 2.
2.1. Data collection
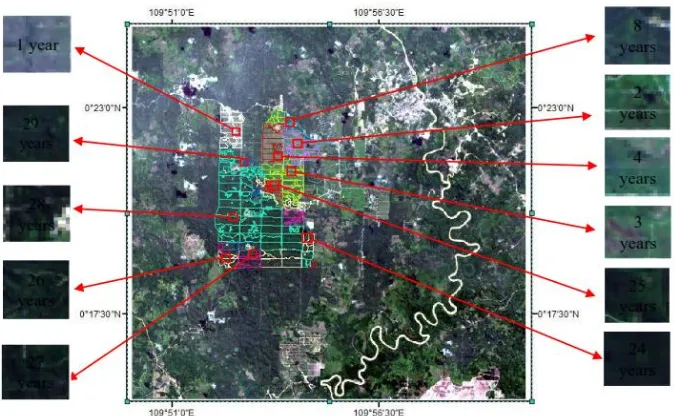
In collecting of data, we divided into three data. They are primary data, secondary data, and supporting data. We used Landsat Image 8 OLI that was launched on July 17, 2013 (Figure 3) with spatial resolution 30 m as primary data derived from official website of USGS (U.S. Geological Survey) by accessing glovis.us gs.gov. This image is used as the base for geometric and radiometric correction, making of region of interest, and spectral transformation to produce map of oil palm age.
We collected vector data of oil palm age area as secondary data derived from National Institut of Aeronautics and Space (LAPAN). Vector data of oil palm age range from 1 to 8 years and 24 to 29 years (2013 data). This data is used as reference in making of Regions of Interest on the year of
Area and production of oil palm in Landak Regency
3
Satellite map 2013 as suporting data derived from Universal Map Downloader. Bing Satellite Map has better resolution (0,6 m) than Landsat satellite imagery and therefore is used as a reference image for geometric correction.
Figure 2. Methodology on this study
2.2. Preprocessing
2.2.1. Radiometric Correction. Radiometric correction in this study is to change the value of DN to
radian (at sensor radiance) and then change the value of radian to reflectance (at sensor reflectance) by using MODTRAN4 method which already available at ENVI software with name FLAASH (Fast Line-of -sight Atmospheric Analysis of Spectral Hypercubes).
This model uses the standard equations of pixel spectral radiance received with a standard planar lambertian, based on the solar spectrum by the sensor written in equation 1 [15]:
1 1 e a
Where, L is spectral radiance on the sensor; is surface reflectance on pixels; is average surface reflectance; is albedo in the atmosphere; is radiance scattering behind the atmosphere; is coefficients of atmospheric and geometric conditions;
1 e
is energy radiance which is dissipated by the atmosphere.
The A, B and S are determined from MODTRAN4 calculations using observation angles, sun angles and altitudes. FLAASH uses average radians to estimate reflectance with equation 2 [15]:
(Landsat 8 OLI) Pre-processing
Radiometric Correction
(Landsat 8 OLI) Pre-processing
4
2.2.2. Geometric Correction. The Landsat 8 OLI image derived from USGS has a level on terrain
corrected LIT format, where is this level is only need to determine the coordinate projection system in Landsat 8 OLI Image and also need to do radiometric image calibration. However, in this study, accurate validation must be performed by using the point of Independent Control Point (ICP) which is done evenly throughout the study area. The level of accuracy of ICP can be seen from the Root Mean Square error of RMSE calculation on ICP shown in equation 3:
2
2 vegetation. The vegetation index used in this study is NDVI (Normalized Difference Vegetation Index).This index has an effectiveness for predicting surface properties when the vegetation canopy is less dense and less rare. The formula for calculating the NDVI value can be seen in the equation 4:
NDVI NIRRED NIR (4)
2.4. Identification and Extraction of Information (Region of Interest)
Oil palm plantation have patterns and textures that are different from other objects in the area. When we compared with the surrounding objects, this oil palm plantation has a pattern that is in groups and lined regularly [11]. This unique pattern makes oil palms distinguish from other trees or forest in satellite imagery. Patterns are very organized. It make the process of identification and extraction of statistical information age of plants easier. We create region of interest by considering area of oil palm age. The method used in determining the sample is random sampling method. The number of samples is different for each age, where the smaller the area of age the less the number of samples, as well as the larger area of age, the more samples needed. We identify and extract of spectral image values of each age block used to find the functional relationship between age and NDVI value derived from Landsat 8 OLI. Distribution oil palm age based on vector data can be seen on Figure 3.
5
2.5 Regression Analysis
The regression method used in this study is logarithmic regression because oil palm age data in this study are not linear. Generally, the logarithmic transformation variable in the regression model is used for a nonlinear relationship between the independent variable and the dependent variable [16]. Regression model indicated by coefficient of determination ( ). The coefficient of determination on regression model is interpreted as how strong the ability of all independent variables in explaining the variance of the dependent variable. Coefficient of determination is between 0 to 1. A low coefficient of determination means a very limited variety of dependent variables and if coefficient of determination close to 1 means that the independent variables can provide all the information needed to predict the dependent variable [17]. Based on regression model and coefficient determination we can get information about relationships between NDVI and oil palm age.
3. Results and discussion
3.1 Models and relationships between NDVI and oil palm age
On this study we get variables such as age, derived from field survey (LAPAN) and NDVI value derived from Landsat 8 OLI 2013. The relationship between NDVI value and oil palm age showed by Scatterplot. Scatterplot is a graph commonly used to see a relationship pattern between two variables.
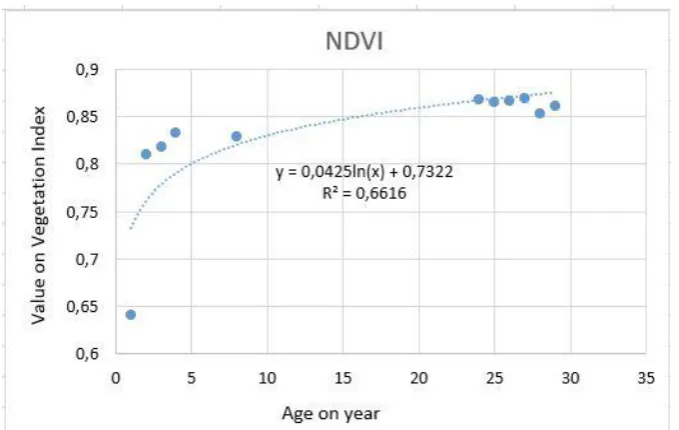
We investigate relationship between NDVI value and oil palm age on the study area. We collected information of age and NDVI value from 11 block in study area. The relationship between oil palm age and NDVI is presented by Scatterplot in Figure 4.
Figure 4. Relationship between oil palm age and NDVI
Based on Figure 4, The result of regression produce model and coefficient of determination which = 0,66 shows that the equation can show 66% relation between NDVI value and oil palm age. The resulting formula isy0, 0425ln
x 0, 732. We can see that NDVI extracted from Landsat 8showed a strong positive correlation with oil palm age. It has indicated that the higher NDVI value the higher the age. NDVI is an index that reflects the degree of greenness. The green leaves give better reflections in the near-infrared wavelength range than in visible wavelength ranges.
6
the age of 1-2 years the plant undergoes a pruning process of production, the pruning done at the age of 20-28 months by cutting certain leaves as preparation for the harvest. The value of NDVI at the age of 1 years is low because at the age of 1 years palm oil plant leaves have not dangled down and still stand up to the top. Lastly, for age 24 - 29 years increase of NDVI value experienced a very good improvement and increased continuously, most of the leaves begin old and dry and then fall to the ground, but in general still lush. In this study, the oil palm plots are shown to be healthy and the optimum age of the palm trees shows high NDVI values.
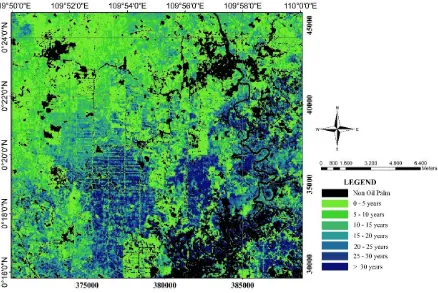
3.2. Spatial distribution of oil palm age based on Landsat 8 OLI
Map of distribution of oil palm age is map that informs the spatial distribution of oil palm age in the Landak regency, west Kalimantan Province, Indonesia. Map of oil palm age is based on equation of regression analysis between NDVI extracted from landsat and oil palm age. Equation of regression showed in Table 1.
Table 1. Equation of regression between NDVI and oil palm age Vegetation Index Model
NDVI y0, 0425ln
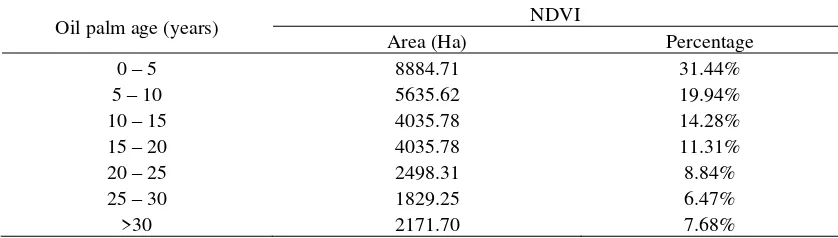
x 0, 732 0.66Based on Table 1, we got spatial distribution of oil palm age in Landak regency, west Kalimantan province, Indonesia can be seen on Figure 5 and percentage of large area on this study can be seen on Table 2. We classify oil palm age into 8 classes they are non oil palm, 0 – 5 years, 5 – 10 years, 10 – 15 years, 15 – 20 years, 20 – 25 years, 25 – 30 years, and more than 30 years. We also calculated large area of oil palm in Landak Regency, west Kalimantan province in Indonesia around 29091,15 ha.
7
Table 2. Percentage of large area of oil palm age
Oil palm age (years) NDVI regency, west kalimantan province, Indonesia is 0 - 5 year (8884.71 ha) with percentage 3,44%, and minority of oil palm age is 25 - 30 year (1829.25) with percentage 6,47%.
4. Conclusions
The study has showed estimation of oil palm age based on Landsat 8 OLI. The relationships between oil palm age and NDVI on this study is strong which ( ) of 0,66. NDVI and oil palm age have a positive relationship with the equation y0, 0425ln
x 0, 732means the higher NDVI value thehigher the age. Furthermore, the equation is used for mapping the spatial distribution of oil palm age informing that the majority of age in the study area is 0 - 5 year and the minority of oil palm age in the study area is 25-30 year. For future works we will collect various years of production data from the plantation to estimate the production of oil palm.
Acknowledgments
The author would like to thanks to LAPAN that have provided supporting data in this study. This study supported by Universitas Lampung and Institut Teknologi Nasional (ITENAS) Bandung.
References
[1] Chemura A 2012 Determining oil palm age from high resolution satellite imagery. University of
Twente, 1-34
[2] Chong K L, Kanniah K D, Pohl C and Tan K P 2017 A review of remote sensing applications for oil palm studies. Geo-spatial Information Science, 20:2, 184-200, DOI: 10.1080/10095020.2017.1337317
[3] Directorate general of plantation Statistics of Indonesian Oil Palm Plantation 2014-2016.
Jakarta, December 2015
[4] Mansor S A and Sarker M L R 2015. Remote sensing technique for estimating the age of oil palm using high resolution image. In ACRS 2015 - 36th Asian Conference on Remote Sensing: Fostering Resilient Growth in Asia, Proceedings Asian Association on Remote Sensing
[5] Tan K P, Kanniah K D, Cracknell A P 2013 Use of UK-DMC2 and ALOS PALSAR for studying the age of oil palm trees in southern peninsular Malaysia. International Journal of
Remote Sensing 34, 7424–7446
[6] Setyowati H 2015 Application of Spot-6 Image Based Spectral Transformation For Estimation of Palm Oil Production. Universitas Gajah Mada
[7] Darmawan S, W Takeuchi, H Abidin, M N Rasid and M Na’aim Samat 2016 An Investigation of Age and Yield of Fresh Fruit Bunches of Oil Palm Based on ALOS PALSAR 2.
Malaysian Journal Remote Sensing and GIS, Vol. 5 No. 2.
8
Malaysia and Google Earth imagery. International Journal of Remote Sensing 34, 7400– 7423
[9] Tan K P, Kanniah K D and Cracknell A P 2012 A review of remote sensing based productivity models and their suitability for studying oil palm productivity in tropical regions.Prog. Phys.
Geogr, 36, 655 – 679.
[10] Kanniah K D, Tan K P and Cracknell AP 2017 UK-DMC2 satellite data for deriving biophysical parameters of oil palm trees in Malaysia. In Proceedings of the IEEE
International Geoscience and Remote Sensing Symposium, Munich, Germany; pp. 6569–
6572.
[11] Cheng Y, Yu L, Cracknell A P and Gong P 2016 Oil palm mapping using Landsat and PALSAR: A case study in Malaysia. Int. J. Remote Sens 37, 5431–5442.
[12] Cracknell A P, Kanniah K D, Tan K P, and Wang L 2015 Towards the development of a regional version of MOD17 for the determination of gross and net primary productivity of oil palm trees. International Journal of Remote Sensing. 36, 262–289.
[13] Hadi A 2016 Utilization of Landsat Landsat Awareness Image 8 Oil For Mapping Leaf Area Index Age Using Oil Palm Using Method (Infrared Index). Universitas Gajah Mada.
[14] Ramdani F 2012 Analysing Variety of Vegetation Indices Values using Values Different Methods for Mapping Oil Palm Closed-Canopy Composition in Sourthen Riau Province, Indonesia. Geoscience and Remote Sensing Symposium (IGARSS), IEEE International: 6032-6034.
[15] FLAASH Use’s Guide 2009 Atmospheric Correction Module: QUAC and FLAASH User’s Guide. Version4.7.ITT Visual Information Solution Inc.
[16] Benoit K 2011 Linear Regression Models with Logarithmic Transformations. Methodology Institute London School of Economics.
[17] Hermansyah and Dwiza 2016 Descriptive Statistics Application is Easy. Jakarta: Khalifah mediatama.
![Figure 1. Area and production of oil palm in 2014-2016 [3]](https://thumb-ap.123doks.com/thumbv2/123dok/3984456.1927876/6.595.112.456.111.322/figure-area-production-oil-palm.webp)