Real-time Monitoring System of Electrical Quantities
on ICT Centre Building University of Lampung
Based on Embedded Single Board Computer
BCM2835
Gigih Forda Nama1, Dikpride Despa2, Mardiana1
1Department of Informatics Engineering, 2Department of Electrical Engineering
University of Lampung Lampung, Indonesia
[email protected], [email protected], [email protected]
Abstract— University of Lampung (Unila) as an academic institution should provide the internet service for thousands of users, monitoring the condition of electricity (Voltage, Current, Power factor, Power, and Energy consumption measurement) at ICT center building has an important role, as a part of maintenance lifecycle to make sure the internet services running well, system monitoring implemented in order to know the quality of electricity supply in the system, identifying disruption events, and to calculate the amount of electrical energy usage periodically. In this research we made an application to monitor the electrical quantities in real time, and shown the statistic reports through web interface. This research was conducted on the 3-Phase electricity network at ICT center building Unila. Monitoring of voltage was done by using a step-down transformator as voltage sensor, and Current Transformer SCT-013 100A as current sensor. Energy, Power, and Power Factor value was obtained by some of scientific calculation. Python programming language was used to develop the application, mainly for data acquisition and calculation that run on BCM2835 Embedded Single Board Computer. The result of this research shown that energy consumption for each Phase was not in balance, 1st and 2nd Phase mostly high load during working hours
only, while 3rd Phase energy consumption relatively stable at all
time, this happen because 3rd Phase connected to Data Center
which consist of several server and network equipment that always online for 24 hours.
Keywords— 3-Phase electrical networks, embedded system, voltage sensors, current transformer SCT-013 100A, energy consumption, BCM2835 embedded single board computer.
I. INTRODUCTION
Nowadays, internet plays an important role for all human being. A lot of internet services are available to fulfill the users need. University of Lampung (Unila) as an academic institution should provide the internet service for thousands of users, therefore monitoring the condition of electricity at ICT
center building has an important role as a part of maintenance lifecycle to make sure the internet services running well. The quality of electrical energy such as voltage, current, and power factor is very important to know, because it can directly affected the performance and service life of the load or all network equipment used especially at Data Center room. While the amount of electrical energy consumption every day, every week or every month needs to know in order to identify the measures to make saving in electrical energy consumption and to reduce the cost of utility bills.
To achieve objectives above, it should be created an application that can monitor the amount of electricity usage such voltage, current, power factor, power and huge consumption of electrical energy ad ICT center building, that can recorded into database and displayed through a web interface, and can be accessed remotely from anywhere.
In this research, solution monitoring system using embedded single board computer was investigated and built. BCM2835 or commonly identified by Raspberry Pi was used to perform the monitoring task. The work on this paper only monitor the electricity utilization, main program of application was developed by Python programming language, the data was collected from several sensors: such current sensors, voltage sensors, while energy, power, and power factor are calculated based on information obtained from the sensors. The whole data then save into database server, and display on web.
II. RELATEDWORKS
A. Previous Research
connection based single board computer BCM2835 also be referenced in this study [3][4][5]. Especially on work [5], Despa et al. succeed made a prototype device that functions to monitor the amount of electrical quantities. The current measurement process on this prototype presuppose the power from main panel should be cut off, so the device act as electrical bridge, and if there any abnormal even occurs in this scenario it will impact risk damage to the prototype. Therefore in this research then developed further improvement by using a ring sensor that can perform measurements without having to cut off the power from distribution panel, so if there any case of an abnormal situation, it will not damage the monitoring device.
On work [6] describe the design of recorder KWh meters distance-based on microcontroller and made a device to calculate energy consumption of household. The device their made consists of 2 parts: a transmitter and receiver. Transmitter was applied on the KWh meter, while the receiver was used to saw the results of the calculation of a distance using wireless. To gather the value of energy consumption was used current sensors, and to process the data they used microcontroller and subsequently also been no previous research on the electrical connection and monitor. The principal of Electrical measurement was also discuss on paper [7] [8]
On paper [9], Bakers et al describe the used of low cost and low power embedded mini computer for environmental monitoring. This research shown that it is possible to logged the data environmental parameter using sensor and stored it into database. The works describe on [10] presented the significant issues and challenges in the field of internet monitoring and measurement. This paper describes methodologies for internet monitoring that could changes following the changing of scenarios and how the network operated.
The trend of green computing on Network Operation Center (NOC) also increased rapidly. On paper [11] describe the trend of cloud computing technology for energy efficiency as one of green computing concept practices. Unila as one of the largest university in Sumatera, Indonesia also plan to adopt this trend onto theirs NOC [12]. Paper on work [13] studied the network monitoring using several open source application.
Paper [14] show the monitoring of electricity consumption using microcontroller and C programming language, in their works there are no system notification to system administrators. The work on paper [15] discuss about web base temperature monitoring system using EZ430, personal computer (PC), Visual Basic, and store the data into MySQL server. Python programming language can be used to capturing network utilization data [16], other previous research on [17][18] that used several open source program to develop applications.
B. Single Board Embedded Computer Architecture
A lot of single board mini computer variant available on market. One of the widely mini computer architecture used is based on ARM. BCM2835 is one of single board mini computer with ARM architecture [19]. Single board has all the
computer feature to run as a computer. BCM2835 has an I/O ports (USB, HDMI, Audio and GPIO) and only need low energy (5 volt with current 700 mA).
Figure 1 depicts the architecture of BCM2835 that used in this paper as low cost and low power embedded computer. This embedded computer is well known as Raspberry Pi in the market. This board become very popular and a lot of researcher used this board for their works.
Figure 1. BCM2835 ARM peripheral [19]
III. RESEARCHMETHODOLOGY
A. System Block Diagram
3-Phase power source will connect with current sensor and voltage sensor on each Phase, the analog data that gathered by those sensor will deliver to arduino, arduino will send the data to Raspy through USB interface, furthermore Python programming language that installed on Raspy will calculate the data source to produce the amount of power, energy, and power factor. Python program will sent all data (current, voltage, power, energy, and power factor) to database server using Ethernet interface that available on Raspy, and finally the data report can be access by web interface. Fig.2 describe block system diagram
B. Hardware Design 1) Voltage Sensor Circuit
In designing the voltage sensor, step-down transformers are used, to justify the voltage level in to a low level voltage. Because the output from transformers is still in AC with high voltage, meanwhile arduino was designed using a lower voltage source, then it need a signal conditioning circuit which is act as voltage divider functions to reduce the voltage so that the voltage can be read by Arduino. Then it will be able to convert into a digital data and transmitted to Raspberry Pi. Voltage sensor networks are made as shown in Figure 3.
Figure 3. Voltage Sensor Circuit [20]
2) Current Sensor
Current Transformer SCT-013 100A was used for current sensor, this sensor will provide an output voltage that is linear with current changes measured. It output signal depending on the input signal. In this experiment, the measured current is AC current then it need a signal conditioning circuit which is act as voltage divider functions to reduce the voltage so that the voltage can be read by Arduino, current sensor are made shown on Figure 4.
Figure 4. Current sensor circuit [20]
3) BCM2835 Single Board Computer
Single Board Computer BCM2835 or commonly called the Raspberry Pi is a credit card-sized computer developed by the Raspberry Pi Foundation, which has a function similar to most PC. Monitoring is done on 3-Phase network on ICT center Unila building, hence the required sensor 3 respectively. Of all these sensors will gather the voltage V (Volt), current I
(Ampere), power factor pf (cos θ), load power P (Watt), and E energy consumption (kWh) for each phase. The value of voltage, and current can be seen in sensor readings result. While the power factor, energy, and power can be done by calculation scientific program. Implementation system monitoring on ICT center building shown in Figure 5.
Figure 5. Implementation system monitoring on 3-Phase network ICT center building
C. Program Design
Python programming language was used to create several function and routine that run on Raspy, such:
• Program for reading the sensor data,
• Program for calculation to obtain the electrical
quantity.
• Record the electrical quantity data and deliver to
database system and displays on web interface
From Figure 6, output of the system is the value of Voltage, Current, Cos θ, Power, and Energy consumption, can be explained as mention follows:
• Rated voltage obtained from the voltage sensor
readings.
• The current value obtained from the current sensor
readings Current Transformer SCT-013 100A.
• Energy consumption value obtained from calculation
from current and voltage value.
• Value KWh is the product of power by time, the
power can be calculated by this formula [21]
E = P.t (Wh)
E = (P.t) / 1000 (kWh) P = E / t
Where: P = Power (Watts)
E = Energy consumption (KWh) t = time (hours)
Then, after the value of Voltage, Current and Power are identified then the power factor pf (cos θ) could be calculated using this formula [21]
P = V. I Cos θ Pf = P / (V .I)
Where: P = Power (Watts) V = Voltage (Volt) I = Current (Amperes)
Pf = Power Factor (cos θ)
IV. RESULTSANDDISCUSSION
A. Voltage Sensor Testing.
Testbed was done by using voltage sensor analog voltmeter, digital voltmeter and sensors, then we comparing the results of data measurements among those instrument devices. test results are shown in Table 1. below.
TABLE I. DATA RESULTS VOLTAGE MEASUREMENT
B. Current Sensor Testing.
Testbed experiment was done by providing the electrical load power value change, burden used are incandescent lamps, fans, water heaters and irons. Tested with current sensor and combine with voltage sensor in order to obtain the value of power factor using Python program. The results of this testing was shown in Table 2.
TABLE II. DATA RESULTS CURRENT,PF,P
Based on the data of voltage, current, power and power factor measurement indicates the results of this measurements on our sensors have a small scale difference results if compared with measurement using an analog measuring device and digital measuring devices, so that the sensors are made fairly used for monitoring system of electrical quantities on the panel.
C. Testbed Environtment.
Testbed performed on 3-Phase electrical panel at ICT Centre Unila building floor 1st. The first step was to install the hardware have been made to 3-Phase electrical panel before going to load, and then made the database system on MySQL server as a place for saving the monitoring data, and the final step is to displaying the existing data from database into web interface. In this testbed, the database was split into 5 tables that are; current, cosphi, power, KWh, voltage. The measurement results are displayed in web interface chart statistics. Monitoring charts result of each measurements describe in Fig.7, Fig. 8, Fig. 9, Fig. 10, and Fig. 11. The graphs was the result of data measurement on ICT center building during 14 June 2016 until June 19 2016.
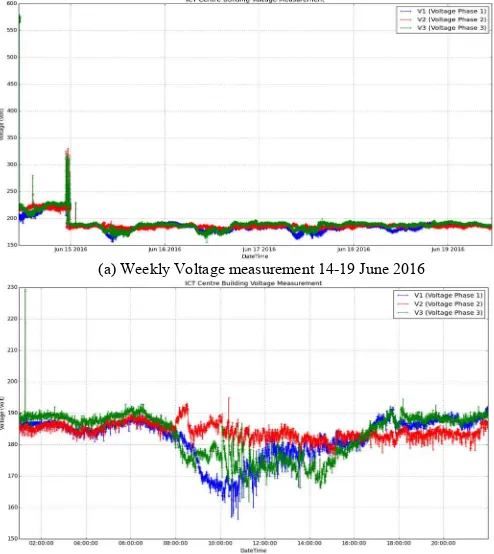
(a) Weekly Voltage measurement 14-19 June 2016
From the graph of voltage monitoring results shown in the figure 7. it appears that inter-Phase almost balance, the highest average voltage contained in the 3rd Phase to reach 330 V (a) and 194 V (b), while the lowest average voltage contained in the 1st Phase which reaches 220 V (a) and 184 V (b). This occurs because the load was not balanced between the three phases. If more load utilized on a phase, the voltage drop that occurs in these phases will be greater or vice versa. Loads in this term is all of loads which are connected to the three-Phase power source from PLN. Voltage in 3rd Phase relatively constant for 24 hours (b) while the 1st Phase and 2nd Phase voltage during at the day tended to decline compared to the voltage at night, it shows that loads in 1st Phase and 2nd Phase during working hours was greater than the loads at night.
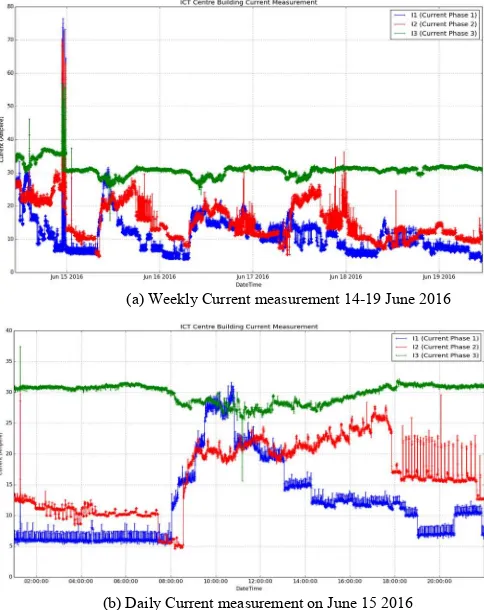
(a) Weekly Current measurement 14-19 June 2016
(b) Daily Current measurement on June 15 2016
Figure 8. Current Monitoring Graphs.
From the graph result of current monitoring in Fig. 8 (a, b), shown that the current between phases in ICT Centre building was not in balance. The largest average current value is allocated in 3rd Phase around 26 to 31 A (b), the 2nd Phase will increase during the working hours (08.00-16.00) around 7 to 31 A, and decrease at night. While the smallest average currents are allocated in 1st Phase, same with 2nd Phase, the current increase during the working hours. Based on these three Phases, measured current at the day was greater than on at night. This can be happened because more activities in ICT Centre buildings are doing during the working hours, while at the night were only used for lighting, and DC air conditioning.
Figure 9. Power Factor Monitoring Graphs
Figure 9 is the power factor monitoring charts, where the value of the power factor was obtained from the calculation using the measurement data of voltage and current. The graph shown that the power factor 1st Phase and 3rd Phase ranged from 0.7 to 0.99. For 1st Phase power factor value decreased to 0.7 but did not last long. While the power factor on 3rd Phase looks stable ranging at 0.9 to 0.99. Power factor on 2nd Phase several times not stable. Factors that affect the value of the power factor is a reactive load, so if the value of power factor is unstable probably it caused by the changes of reactive power in load.
Figure 10. Power Monitoring Graphs
Graph in Figure 10. shown that the load was not balanced between each Phases. The biggest average load was allocated in 3rd Phase while the smallest load is in 1st Phase. This condition occurs because Phase 3 is connected to Data Center (DC) room at 2nd floor contained with several public server and network equipment that always online for 24 hours. DC room need large amount of power consumption in order to supply energy for all server and network equipment. The power consume on 3rd Phase relatively stable at working hours or non-working hours. While 1st and 2nd Phase connected to device that no need online for 24 hours, the power consumption will increase only on working hours only.
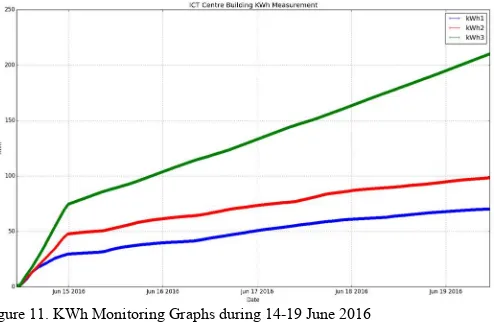
Figure 11. KWh Monitoring Graphs during 14-19 June 2016
From figure 11, shown total energy consumption on 3rd Phase was the largest, while 2nd and 3rd Phase were lower than 3rd Phase.
TABLE III. STATISTICS OF CURRENT,VOLTAGE, ON JUNE 152016
I1 (A) I2 (A) I3 (A) V1 (Volt) V2 (Volt) V3 (Volt)
Mean 20.19098 19.03491 27.89421 173.9178 184.3 175.0101
Std Error 0.121733 0.112875 0.022825 0.133952 0.066871 0.082927 Median 20.15 20.325 27.99 174.635 183.925 174.97 Mode 15.6 20.29 28.19 177.3 184.09 176.23 Std Dev 5.00438 4.640264 0.938336 5.50672 2.749049 3.409099 Kurtosis -0.62627 4.103513 24.9675 -1.00046 0.604817 0.521579 Range 25.7 19.92 14.74 28.31 18.25 25.04
Minimum 5.9 4.58 15.62 156.25 176.65 161.81
Maximum 31.6 24.5 30.36 184.56 194.9 186.85
Sum 34122.76 32169 47141.21 293921 311467 295767.1
Count 1690 1690 1690 1690 1690 1690
From table 3. The smallest current average at that day was on 2nd Phase with 19.03491 A, while the largest current average was on 3rd Phase with 27.89421 A, for voltage result statistic on that day from the voltage sensor it shown the voltage on whole Phase was below 200 V, and it range from 170-185 V.
V. CONCLUSIONANDFUTUREWORKS
A. Conclusions
The consumption of electrical energy at ICT Centre buildings on each Phase is not in balance. From the chart patterns of energy usage, it appears that electrical energy usage during working hours more than night time, it is because most activities in that building certainly operation at daytime. 3rd Phase was consumed the biggest energy that supply power for server and network equipment.
B. Future Works
In order to make this system better, application should be integrated with system notification. It is highly recommended to develop mobile application of this project
REFERENCES
[1] D. Despa, Y. Mitani, M. Watanabe, M. Z. Bernard, “PMU Based Monitoring and Estimation Power System Dynamic Stability Developed on 50-Hz Power System”, Proceeding of Power and Energy Systems (AsiaPES 2012), 2012.
[2] D. Despa, Y. Mitani, M. Watanabe, “PMU Based Monitoring and Estimation of Inter-area Power Oscillation for Singapore-Malaysia Interconnection Power System”, Journal of Energy and Power Engineering, USA, 2012.
[3] G. F. Nama, M Komarudin, Hanang. P, Mardiana, H. D. Septama, "Electricity, Temperature, and Network Utilization Monitoring at Lampung University Data Centre Using Low Cost Low Power Single Board Mini Computer", Regional Conference On Computer Information Engineering, Indonesia, pp. 184-189, 2014.
[4] Mardiana, W. E. Sulistiono, Johan, “Sistem Monitoring Server Berbasis SMS (Studi Kasus : Server Siakad Unila)”, Electrician, Jurnal Rekayasa dan Teknologi FT Unila Vol.2.No.3, 2008.
[5] D. Despa, A. Kurniawan, M. Komarudin, Mardiana, G. F. Nama, "Smart monitoring of electrical quantities based on single board computer BCM2835", 2nd International Conference on Information Technology, Computer, and Electrical Engineering, pp 315-320, Indonesia, 2015. [6] Pratomo, Vektor A, “Rancang Bangun Pencatan Data KWh meter Jarak
Jauh Berbasis Mikrokontroller. Universitas Budi Luhur”, 2012. [7] S. Tumanski, “Principles of Electrical Measurement, Taylor & Francis
Group”, 2006.
[8] S. Waluyanti, “Alat Ukur dan Teknik Pengukuran. Penerbit Direktorat Pembinaan Sekolah Menengah Kejuruan”, 2008.
[9] E. Baker, “Open source data logger for low-cost environmental monitoring”, Biodiversity Data Journal, 2014.
[10] G. Aceto, A. Botta, D. Donato, P. Marchetta, A. Pescape, G. Ventre, “ Open Source Platforms for Internet Monitoring and Measurement”, Eighth International Conference on Signal Image Technology and Internet Based Systems (SITIS), 2012.
[11] A. Jain, M. Mishra, S.K. Peddoju, N. Jain, “Energy efficient computing- Green cloud Computing”, Energy Efficient Technologies for Sustainability (ICEETS), 2013 International Conference on, 2013. [12] University of Lampung ICT Blue Print. 2011. Bandar Lampung.
Lampung.
[13] T. Michael Silver, “Monitoring Network and Service Availability with Open-Source Software”, Information Technology & Libraries. Mar 2010, Vol. 29 Issue 1, 2010.
[14] Rusty, D. A., Safrodin, M. & Nasur, A. R., “Monitoring Pemakaian Energi Listrik Berbasis Mikrokontroler secara Wireless”, 2011. [15] Riyanto, R.O Wiyagi, “Sistem Monitoring Suhu Ruang Server Berbasis
Web”, Junal Ilmiah Elite Elektro, 2(1), pp. 50 – 54, 2011.
[16] B. Rhodes, J. Goerzen, 2010. Fondation of Python Network Programming. 2nd ed. New York: Apress.
[17] G. F. Nama, M. Ulvan, A. Ulvan, A. M. Hanafi, "Design and Implementation of Web-Based Geographic Information System for Public Services in Bandar Lampung City - Indonesia", 2015 International Conference on Science in Information Technology (ICSITech), pp 270-275, Yogyakarta, Indonesia, 2015.
[18] G. F. Nama, M. Komarudin, H. D. Septama, "Performance Analysis of ArubaTM Wireless Local Area Network Lampung University", 2015 International Conference on Science in Information Technology (ICSITech), pp 41-46, Yogyakarta, Indonesia, 2015.
[19] BCM2835 ARM Peripheral, https://www.raspberrypi.org/wp-content/uploads/2012/02/BCM2835-ARM-Peripherals.pdf. accesed : 24 July 2016.
[20] CT sensors, https://openenergymonitor.org/emon/buildingblocks/ct-sensors-interface, accesed : 24 July 2016.
![Figure 1. BCM2835 ARM peripheral [19]](https://thumb-ap.123doks.com/thumbv2/123dok/3986461.1929881/2.595.309.557.152.360/figure-bcm-arm-peripheral.webp)
![Figure 3. Voltage Sensor Circuit [20]](https://thumb-ap.123doks.com/thumbv2/123dok/3986461.1929881/3.595.309.542.403.703/figure-voltage-sensor-circuit.webp)