IOP Conference Series: Earth and Environmental Science
PAPER • OPEN ACCESS
Co-cracking of real MSW into bio-oil over natural
kaolin
To cite this article: I M Gandidi et al 2017 IOP Conf. Ser.: Earth Environ. Sci.60 012019
View the article online for updates and enhancements.
Related content
Upgrading of bio-oil from the pyrolysis of biomass over the rice husk ash catalysts
B Sutrisno and A Hidayat
-Interrelationship of Kaolin, Alkaline Liquid Ratio and Strength of Kaolin Geopolymer
Shamala Ramasamy, Kamarudin Hussin, Mohd Mustafa Al Bakri Abdullah et al.
-Formation, analysis and characterization of wood pyrolyzed oil
O K Mahadwad, D D Wagh and P L Kokil
Co-cracking of real MSW into bio-oil over natural
kaolin
I M Gandidi1*, M D Susila1 and N A Pambudi2
1Department of Mechanical Engineering, Faculty of Engineering, Lampung University, Jalan S. Brojonegoro No. 1, Bandarlampung, Indonesia
2
Mechanical Engineering Educations, Universitas Negeri SebelasMaret, Jalan Ir. Sutami 36 A Surakarta 57126, Indonesia
*Email : [email protected]
Abstract. Municipal solid waste (MSW) is a potential material that can be converted into bio-oil through thermal degradation process or pyrolysis. The efficiency and productivity of pyrolysis can be increased with the use of natural catalyst like kaolin. The addition of catalyst also reduces the overall cost of conversion process. In this study conversion of MSW into Bio Fuel using Pyrolysis in the presence of of natural kaolin as catalyst has been investigated for 60 min at 400°C temperature. During the process 0.5 w/w catalyst to MSW ratio was maintained. Gas chromatography-mass spectrometry (GC-MS) was used to analyse the chemical composition of bio fuel. It is found that bio-oil production increases substantially with the use of catalyst. It is observed that the production of bio-oil is 23.6 % with the use of catalyst in process, which was only 15.2 % without the use of catalyst. The hydrocarbon range distribution of oil produced through pyrolysis reveals that gasoline and diesel fuel (C5-C20) are its main constituents. The functional group detected in bio-oil by GC-MS analysis is similar to that of diesel-48 in which paraffin and olefin are major mass species.
1. Introduction
Open dumping of municipal solid waste (MSW) has created a lot of problems in cities of developing countries. No suitable place can be found for waste dumping as limited free area is available in urban area and for places outside the city high transportation, maintenance and labour cost is needed [1]. Also, MSW landfills provide habitat for insects, pest and bacteria that can spread different diseases. Furthermore, the piles of garbage in landfills produce leachate that contaminates ground and surface water [2]. The bio decomposition of waste releases methane gas into atmosphere, which is twenty times more dangerous than pollution caused by CO2 emissions [3]. The landfills are also considered as
one of the cause of floods, global warming and green house effects [4,5]. In contrast to these problems MSW has a great amount of chemical energy stored in it. This energy is in the form of chemical bonds between molecules of carbon, hydrogen and oxygen [6]. When these bonds break, organic material is converted into gas, liquid and solid which is known as biofuel [7]. The calorific value which can be generated from municipal waste is around 20.57 MJ/kg [8].Therefore, MSW has a high potential for producing bio-energy. Several methods have been proposed to produce bio-energy from MSW, one of them is pyrolysis method.
Pyrolysis is a thermal degradation process in which MSW is converted into solid, liquid and gas at elevated temperature in the absence of oxygen [9]. Normally operating temperature for this process is 400-600oC [10-13]. In this process, long hydrocarbon chains break into smaller. The products obtained from the pyrolysis can be divided into non-condensable gas, liquid and solid fractions. From the liquid fraction paraffin, olefins, naphthalene and aromatics can be recovered. The hydrocarbon range of these species lie in the gasoline (C5-C12), diesel (C12-C20) and heavy oil (>C20) ranges [14].
1st International Symposium on Green Technology for Value Chains 2016 IOP Publishing
is because of the fact that cracking reaction is highly endothermic due to which very high working temperature is required. Also, the products formed by thermal pyrolysis have low molecular weights and wide carbon number range. The addition of catalyst in pyrolysis process can overcome these problems. Catalyst reduces the activation energy and improve the decomposition reaction and product yield [15-19]. However most of the research publication presented deal with the application of commercial or synthetic catalyst such as Y-Zeolite, ZSM-5, Y-zeolite, β-zeolite, MoO3, Ni-Mo-catalyst, HZSM-5, Al(OH)3 etc [15-19]. In the pyrolysis process. The use of these catalyst increase the overall production cost. It is due to the fact that impurities and contaminants can cause faster deactivation of catalyst. Therefore, the use of natural catalyst instead of commercial catalyst is a better option. These natural catalysts are found abundantly in nature due to which they are very economical. Many researcher have investigated thermal degradation process in the presence of natural catalyst [20-23]. But most of them focus only on single component pyrolysis or specified MSW such as pure and mixed plastic. Whereas in actual scenario MSW contains huge variety of different kind of waste material and it is impossible to separate them because of huge quantity. Also, more information regarding the characteristics of bio-oil obtained from mixed MSW is needed before it can be used as engine fuel.
Therefore, this research focuses on the pyrolysis process to produce bio-oil from un-separated MSW. The MSW contained different kind of plastics, biomass, textile, paper and rubber wastes. The experiment was performed for non-catalytic and natural catalytic pyrolysis processes. Then the product characteristics such as its composition, yield, chemical and physical properties are studied. In addition, a comparison was done between oil and conventional oil to check the possibility of bio-oil as a replacement of conventional bio-oil.
2. Experimental
2.1. Waste and catalyst for pyrolysis
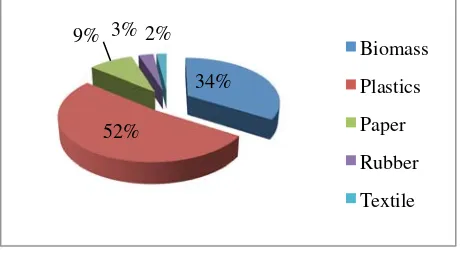
The MSW used in study contained different kinds of waste including vegetable, garden and household waste. It also contained LDPE, HDPE, paper/cardboard, PS, rubber and textile waste. Initially all samples were dried using sunlight. The drying process took 3-5 days. After drying, each component was separated to determine the percentage composition of each type of waste. Figure 1 shows the initial physical form of MSW and percentage composition of each type of waste. After drying process MSW was then chopped into smaller pieces of 5-10 cm. This was done to make MSW size proportional with reactor capacity. Kaolin as natural catalyst for this experiment was obtained from local source in Lampung province of Indonesia. The catalyst was then thermally activated at 500oC for 2 hr to improve the active site and crystalline behavior of catalyst. XRD and BET techniques were used to determine the chemical composition, structure and surface of Kaolin.
Figure 1. Composition of MSW.
2.2. Pyrolysis experiment
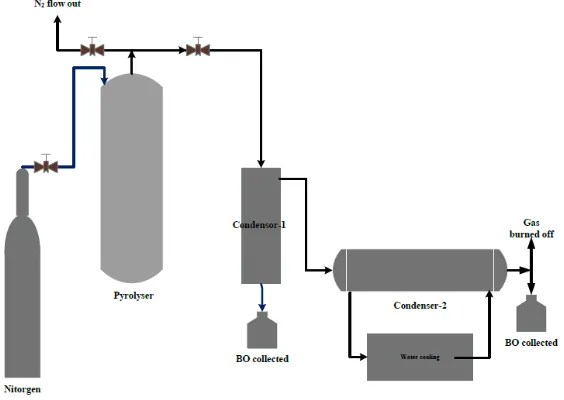
The schematic diagram of whole experimental setup is shown in Figure 2. Laboratory scale fixed bed reactor was used in pyrolysis of MSW sample. The reactor was set vertically up and the N2gas is passed through it for 3 min. The N2 gas introduced in the reactor from top and after circulating in whole body it passed out from the top of reactor. The purpose of introducing N2 was to remove the air from reactor to create inert environment for pyrolysis reaction. In these experiments, 500g MSW sample for non-catalytic pyrolysis and total 750 g MSW and catalyst for natural catalytic pyrolysis were fed into the reactor. 250:500 ratio of catalyst to MSW was maintained. Reactor was heated at heating rate of 12oC until the reactor temperature attained the set point of 400oC. Total reaction time was 60 min. The gas formed during pyrolysis left the reactor from the top and entered into the vacuum gas cleaner where first condensation took place. After passing through Vacuum gas cleaner gas entered into a shell and tube condenser where second condensation took place at 20oC. Second condensation separated liquid from non-condensable gas. The gaseous products were burned off to prevent emissions from hydrocarbon gases. The liquid product from condenser was mixture of bio-oil and water which were later separated by precipitation and filtration process. The char produced during burning of gases remained in the reactor and was collected after the completion of experiment.
Figure 2. Apparatus.
2.3. Bio-oil analysis
Chemical composition of bio-oil obtained from filtration process was studied to determine the impact of catalyst. Gas chromatography-mass spectrometry (GC-MS, QP2010S Shimadzu) was used to determine mass fraction in bio-oil. The column DB-1 (Agilent J 100% dimethylpolysiloxane) was capillary column having 30m length, 0.25 mm diameter and 25 μm film thickness. Helium was used as the gas carrier. Initially temperature was set at 60°C for 5 min followed by heating rate of 5°C/min up to the temperature of 280°C and held for 51 min. To estimate the heating value carbon-hydrogen weight ratio [24] approach was used, according to which paraffin has greatest heating value followed by iso-paraffin, olefin, naphthalene, and aromatic (PIONA). Table 1 shows the ASTM standards which were used to analyse the physical and chemical properties.
1st International Symposium on Green Technology for Value Chains 2016 IOP Publishing
Table 1. Properties of bio-oil.
Propertis Units Standard Diesel 48 Pertamina
Dex Gasoline
Density@15ºC g/cm3 ASTM D-1298 0.815-0.87 0.82-0.86 0.7-0.78 0.8133 0.8038 Kinematic
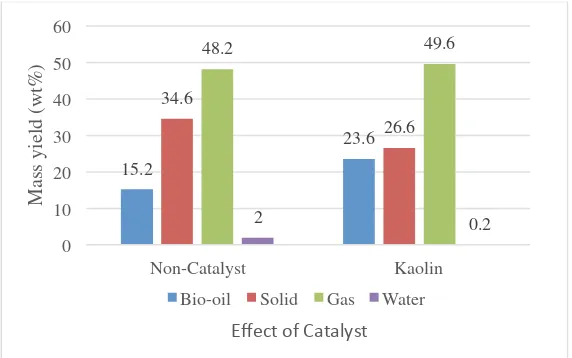
Figure 3 shows the comparison between the mass yield of products obtained by non-catalyst and natural catalyst (kaolin) pyrolysis methods. It is clear that catalytic pyrolysis produced higher bio-oil product than the non- catalytic pyrolysis. However, pyrolysis process produces significant amount of solid residue. It is due to the presence of ash and impurities in MSW. It is found that kaolin addition remarkably increased the decomposition reaction and the production of bio-oil up to the 55.2%. Similar result has been reported of which an increase results using kaolin as a catalyst [25, 26]. Kaolin also reduced the solid, showed that kaolin has excellent productivity behaviour in pyrolysis process. This behaviour is explained on the basis of its active site and acidity which facilitate the cracking reaction. However, water content and significant amount of syngas in pyrolysis product suggest the need of further drying of MSW. It also discovered that the condensation temperature of 20°C was not favourable as it reduced the liquid fraction in product.
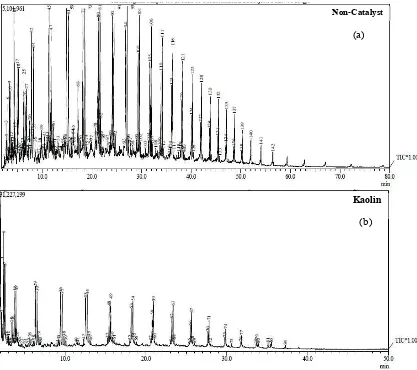
Figure 4. Chromatogram of the bio-oil mass fraction.
On the basis of petroleum mass fraction, bio-oil obtained from Pyrolysis of MSW can be classified into three categorize i.e. gasoline (C5-C12), diesel (C12-C20) and heavy oil (>C20). The number of different carbon ranges found in bio-oil are represented by peaks obtained by GC-MS which are shown in Figure 4. Figure 5 shows the percentages of carbon ranges in different kind of fuels. It can be seen that both gasoline and diesel are the main organic component in bio-oil. Also, the addition of kaolin increases the amount of gasoline and reduces diesel content as catalyst degradation enhances with the addition of kaolin. Due to the high percentage of both gasoline and diesel content in bio-oil, it has physical properties between gasoline and diesel fuel (Table 1). This implies that bio-oil from pyrolysis has a great potential to be used as fuel instead of conventional fuels.
Kaolin Non-Catalyst
(a)
(b)
1st International Symposium on Green Technology for Value Chains 2016 IOP Publishing
Figure 5. Carbon distribution range on conventional and pyrolysis fuel.
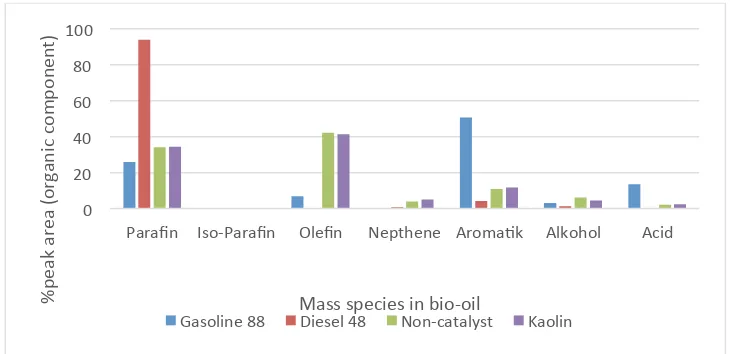
Percentages of mass species found in bio-oil and conventional fuels are shown in Figure 6 and Figure 7, respectively. Diesel-48 contains high amount of paraffin, gasoline-88 contains aromatic and paraffin whereas pyrolysis oil contains mainly paraffin and olefin (C5-C20) and small concentration of
aromatics. Similar result was reported by Panda et al [27] and difference result by use of silica-alumina catalyst by Wang et al[19]. This shows that the addition of kaolin does not impact the percentage of different mass species in final product and it only slightly improves the product yield.
Figure 6. A comparison of mass fraction between pyrolysis oil and conventional fuel.
This results indicates that kaolin has no influence on selectivity behavior and mass species content in bio-oil. Both bio-oil have heating values between gasoline and diesel fuel. Presence of oxygenated functional group and aromatics matter reduces the calorific value of bio-oil. It is simply because of the fact that Carbon oxygen bonds do not release energy during combustion.
0.37 3.19
Diesel 48 Gasoline 88 Non-catalyst Kaolin
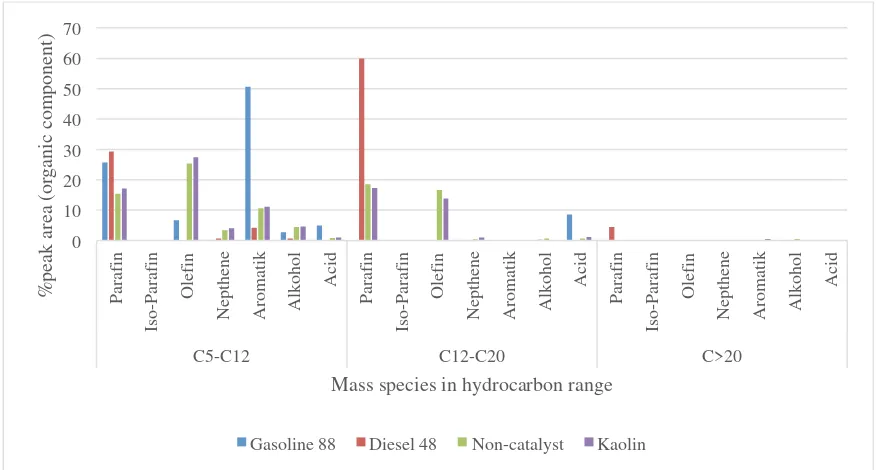
Figure 7. Percentage of organic compound in mass species hydrocarbon range.
4. Conclusion
The study concluded that the use of kaolin as natural catalyst improved the product yield but did not affect the percentage of species found in bio-oil. The physical properties of bio-oil laid between diesel and gasoline because of which it can be used instead of conventional fuels. Low calorific value of oil and production of water and high level of non-condensable gas during pyrolysis process was found and addressed to make bio-oil as an alternative of commercial fuels.
Acknowledgment
This research is partly supported by National Competitive Research Program Grant of Directorate of Higher Education, Ministry of Research, Technology, and Higher Education of the Republic of Indonesia. The authors would like to thank University of Lampung and Gadjah Mada University for their support.
References
[1]. Arinal H,Gandidi I M, and Harmen B 2010 Final report of strategic research grant. 12-144. [2]. Alexandra L C 2012 World Bank. 2-4.
[3]. Haradhan M 2011 Int. J. Economic and Political Integration. 2 (1) 3–10. [4]. Unila LP 2010 Final Report of Waste Management for Rockefeller foundation
[5]. Hari B D and Sameer A 2013 Habitat International. 38 100-105. [6]. Ebru A and Ahmet D 2009 Int. Advanced Technologies Symposium. 1-4. [7]. McKendry P 2002 Bioresource Technol. 83 37–46.
[8]. Ari D P, Kilbergen W, Gultom and Aryadi S 2007 Final Report of Feasibility Study. 8-57. [9]. Hossain A K and Davies P A 2010 Renew and Sustainable Energy Rev. 21 165–189.
[10]. Liu Y Q, Wang J, Dong J and Thay J H 2012 International Conference of Industrial and Hazardous Waste Management.1-7.
Gasoline 88 Diesel 48 Non-catalyst Kaolin
1st International Symposium on Green Technology for Value Chains 2016 IOP Publishing
[14]. Aguado J, Serrano D P, Guillermo S M and Madrid S 2007J. Anal. Appl. Pyrolysis.79 (1) 415-423.
[15]. Chika M, Jude A O and Paul T W 2015Energy Research Institute. 1-29.
[16]. Aida Isma M I, Salmiaton A and Nur Dinie K B 2015Int.J. Environmental Science and Development. 6 606-609.
[17]. Funda A, Miskolczi N and Borsodi N 2013Bioresource Technology. 133 443–454. [18]. Norbert M., Ates F and Borsodi N 2013Bioresource Technology. 144 370–379. [19]. Wang J L and Wang L L 2011 Energy Sources. 33 (21) 1940-1948.
[20]. Mochamad S, Harwin S, Tinton N, Putri N, Shou C, Zainal A and Kunio Y 2014Energy Procedia.47 180 – 188.
[21]. Wenger Jorn 2015 J. Materials Science and Engineering.5 (3-4) 183-185.
[22]. Kyaw K T and Hmwe C S S 2015 Int.J.Advances in Engineering & Technology. 8 794-802. [23]. Abbas A S and Mohamed F A 2015 Diyala Journal of Engineering Sciences. 819-834. [24]. Riazi M R 2005 Characterization and properties of petroleum. 30-84.
[25]. Panda AK and Singh R K 2013Advances in Energy Engineering. 1 74-84.
[26]. Pattaraprakorn W and Bhasaputra P 2014GMSARN International Journal. 8 67-72. [27]. Panda A K and Singh R K 2014Int. J. Environment and Waste Management. 13 104-114.
1st International Symposium on Green Technology for Value Chains 2016 IOP Publishing
IOP Conf. Series: Earth and Environmental Science 60(2017) 012019 doi:10.1088/1755-1315/60/1/012019