Landuse Changes Refer... (Ramlan et al)
Landuse Changes Refer to Spatial Planning Regulations at Kelara Watershed
Area: an Analysis Using Geospatial Information Technology
Andi Ramlan, Risma Neswati, Sumbangan Baja, Muhammad Nathan
Jurusan Ilmu Tanah, Fakultas Pertanian, Universitas Hasanuddin, Makassar
Corresponding E-mail:[email protected]
Abstract
The purpose of this study is to analyze landuse changes in the Kelara watershed and to assess the suitability of current landuse changes with the spatial planning regulation of Jeneponto within Kelara basin. This study integrates various survey techniques, remote sensing, and geographic information system technology analysis. Geospatial information used in this study consists of Landsat ETM 7+ satellite imagery (2009) and Landsat 8 (2014) as well as a number of spatial data based on vector data which is compiled by the Jeneponto Government. Remote sensing data using two time series (2009 and 2014) are analyzed by means of supervised classification and visual classification. The analysis indicated that land use type for the paddy fields and forests (including mangroves) converted become a current land use which is inconsistent with the spatial planning regulation of Jeneponto.The use of land for settlement tends to increase through conversion of wetlands (rice fields). These conditions provide an insight that this condition will occur in the future, so that providing the direction of land use change can be better prepared and anticipated earlier.
Keywords:landuse change, GIS, remote sensing, spatial planning regulations
Abstrak
Tujuan dari studi ini adalah menganalisis perubahan penggunaan lahan di DAS Kelara serta menilai kesesuaian penggunaan lahan saat ini dan perubahannya dengan rencana tata ruang wilayah Kabupaten Jeneponto yang berada di dalam wilayah DAS Kelara. Penelitian ini mengintegrasikan berbagai teknik survei wilayah, penginderaan jauh, dan teknologi sistem informasi geografik. Informasi geospasial yang digunakan dalam penelitian ini terdiri atas citra satelit Landsat ETM 7+ (2009) dan Landsat 8 (2014) serta sejumlah data spasial berbasis jenis data vektor yang disusun oleh Pemerintah Kabupaten Jeneponto. Jenis data penginderaan jauh menggunakan 2 (dua) seri waktu (tahun 2009 dan 2014) yang dianalisis menggunakan metode klasifikasi terbimbing (supervised classification) dan klasifikasi visual. Hasil analisis menunjukkan bahwa jenis penggunaan lahan untuk sawah dan hutan (termasuk mangrove) mengalami konversi penggunaan lahan yang tidak sesuai dengan rencana tata ruang wilayah Kabupaten Jeneponto. Penggunaan lahan untuk pemukiman cenderung mengalami peningkatan melalui konversi lahan basah (sawah). Kondisi tersebut memberikan gambaran tentang kondisi yang akan terjadi di masa mendatang sehingga penanganan arah dan kecenderungan perubahan penggunaan lahan yang lebih baik dapat disiapkan dan diantisipasi lebih awal.
Kata kunci: perubahan penggunaan lahan, GIS, penginderaan jauh, rencana tata ruang wilayah
Introduction
One of the main factors reinforcing global climate
change nowadays is land-use change due to human’s
activities in making use of various resource potentials.
Human’s activities lead to an increase of landuse
change which averagely never happens before either in level of scale or in level of amount and total area of land which is used (Turner, 1994; Vitousek et al., 1997). A result of a research conducted by Schneider et al. (2001), taking place in the area of Ipswich Massachusetts River Basin (DAS), USA, indicates that landuse change is mostly caused by landuse conversion of forests into residential areas. This condition also happened in Indonesia. Up to 2011,
470 river basins were in a critical condition since the areas of the river basins were no longer effective catchment areas (Suwarno, 2011). Even up to 2014, there were only 10 out of 155 river basins in Java of which percentage of forest cover was above 30 percent (http://www.republika.co.id accessed on June 19th 2014). River basin degradation in Indonesia is supposed to have happened in 1970s. It is commonly triggered by pattern of land-use change to the needs of agricultural areas (including plantation lands), as well as residential areas and mining areas (Junaidi, 2009).
plan (Marisan M, 2006) and rapid increase in human population (Vitousek et al., 1997). The same condition in which the increase of population leads to an
increase of land-use for society’s agricultural needs
occurs in Kelara River Basin. As a result, the amount of land for preservation zones significantly decreases because of the continuous increase of land conversion for agricultural activities. The change of land-cover condition puts effects on society especially in dry season in which soil water availability is limited. According to Foley et al., (2005), changes in land cover and vegetation in the long run will contribute the sustainability of food production, clean water and forest resources, climate and in the end will decline
human’s quality of life and wealth. The documentation
of landuse change from time to time, hence, is required to conduct.
This research aims, firstly, at assessing the consistency or inconsistency of land-use pattern in Kelara River Basin located in the regency of Jeneponto with its urban landuse plan. Specifically, it is intended to recognize the condition of land cover within the period of 2009 to 2014 and also to analyze the tendency of land-use change which is occurred. Secondly, the aim of this research is to analyze the appropriateness of landuse in Kelara River Basin with
Jeneponto’s urban land-use plan.
The pattern of landuse change occurred in the period of 5 years is expected to be able to show the tendency of change. The landuse change which is continuously and appropriately recognized will contribute to better understanding on how process and interaction between human and natural phenomena happen in such a way that resources can be better managed (Lu et al.; 2004, Giri et al., 2005). This way, some efforts to solve the problems can be applied well as earlier as possible.
Research Method
Location
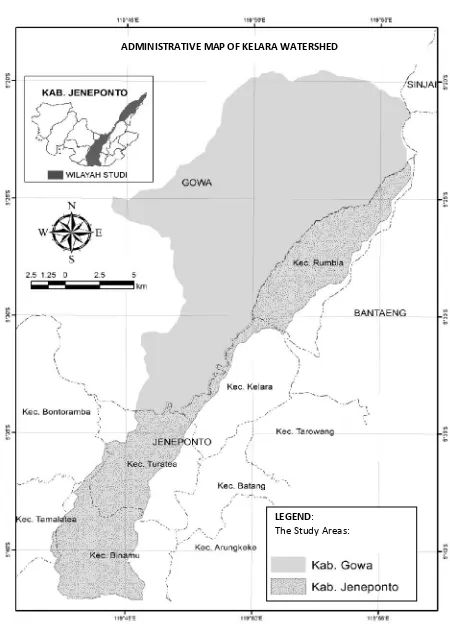
This research was conducted in Kelara River Basin located in the regency of Jeneponto. Kelara River Basin is listed as a river basin in the regency of Gowa and Jeneponto with the total area of 39,089 ha including 13.100 ha in the regency of Jeneponto (34% of total area of Kelara river basin) and 25.983 ha square miles in the regency of Gowa (66% of total area of Kelara River Basin). This study focuses on research conducted in the regency of Jeneponto. Kelara River Basin in the regency includes an area of which most
of the lands are used as agricultural areas. This research took place in the period of February 2014 to July 2014.
Data and Types of Data
Data used in this study are spatial and non-spatial data. Spatial data are data which have geographic references and their characteristics. Meanwhile, non-spatial data are tabular data. Primary and secondary data were used in this research. The primary data
consist of satellite image data (2009’s record of
Landsat ETM [Enhanced Thematic Mapper Plus]
7+ and 2014’s record of Landsat 8). Secondary data
which were used include data of space pattern of
Jeneponto Regency, data of the River Basin’s area borders, data of area’s administration (province,
regency, district) as well as other relevant thematic data (geology, land system, etc)
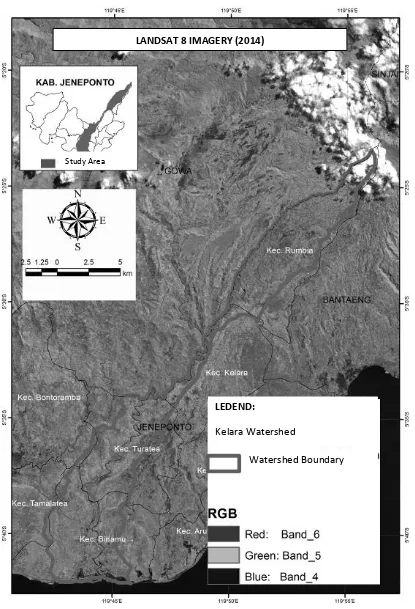
Satellite image data used in this study are based on USGS (United State Geological Survey) (http:// earthexplorer.usgs.gov/). The type of data is satellite image of Landsat ETM 7+ acquired in January 2009 and satellite image of Landsat 8 acquired in May 2014.
ADMINISTRATIVE MAP OF KELARA WATERSHED
LEGEND:
The Study Areas:
In addition, thematic data are in the form of data of area administration obtained from Regional Development and Planning Center in Jeneponto regency and Geospatial Information Center (scale 1:50000).
Method of Analysis
The interpretation of the satellite image was conducted by using Erdas IMAGINE 9.2 and Indrisi Selva software. Meanwhile, the other spatial data were analyzed with the help of ArcGIS 10.2 software. The stages of interpreting image are described as follows:
Interpretation of Landsat ETM 7+ and Landsat 8 Satellite Image
Before satellite images were interpreted, there should be a set of activities, comprising:
Geometric and radiometric correction.
Geometric correction is a process required to place a piece of satellite image in the actual position in the real world according to the position of geo-reference. Meanwhile, radiometric correction is a histogram adjusting method which was implemented with the assumption that in the data recording process, there were many weak or even totally zero signal catching distortions and therefore there existed some zero data. Whereas, if the value was more than zero, it was considered as bias.
Composite Image Preparation.This process is a
combination of three wavelengths carried out by giving the basic colors to them, consisting of basic colors: red, green, and blue. Type of color composite image depends on much object being studied. In the study, the composite color for Landsat ETM 7+ is the combination of band 5 4 3, while the band combination for Ladsat 8 image is band 6 5 4.
Image Sharpening.The process is included in the set of composite arrangement which was conducted by sharpening the image and filtering the digital value of the image.
Image Interpretation. The process involves
analysis and object identification. Some aspects need to be attentively examined, such as color, digital number, structure, texture, brightness, pattern, sites, and so on. Image interpretation and classification were conducted by using supervised classification with Maximum Likelihood method by deploying composite band combination to analyze vegetation. The result of land use analysis was validated by implementing ground truth.
Spatial Analysis
The data were analyzed using the devices of geographical information system by applying appropriate analysis techniques, including some overlay methods (intersect, clip, merge, etc), update, and cross tabulation. The process of comparing land use was conducted by using overlay of the land- use data by applying ArcGIS software. The overlay result will produce what kinds of land use have changed from 2009 to 2014. Based on the annually observed land-use classification, algorithm of land-use change during 5 year observation is found. This approach is the most common pattern applied to analyze the landuse change (Jensen, 2004).
To find out the level of consistency between land use policy and actual condition, a test was carried out by making cross-component-tabulated table of the components, for instance, the data of space pattern of RT /RW chambers and the analysis result of land use. The data combination will show the actual condition of the suitability or mismatch between the spatial pattern and land use. This result of analysis may spatially show the position of land use which is inconsistent with the space policy. Thus, the result of the study can give inputs to the policy makers to solve the occurring problems.
Results and Discussion
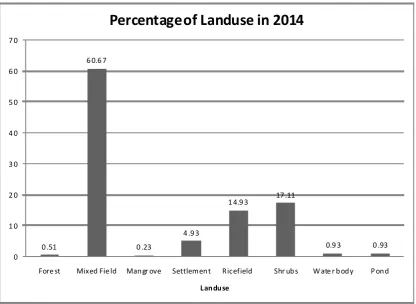
Landuse in 2009Based on the results of the classification of Landsat ETM7 + 2009 using seven classes of land use, It showed about the land use percentage of Kelara watershed in Jeneponto District presented in Figure 2 and that the interpretation of the largest land use in 2009 was a mixed farms (58.50% Kelara watershed in Jeneponto), while the smallest land use were shrubs (0.8%). A significant type of land use was for rice (32.95%) since satellite image acquisition in January 2009 was coincided with the rainy season, so people could conduct wetland cultivation (irrigated and non-irrigated rice) with rice plants.
Landuse in 2014
1.0 5
58 .5
0 .9 7
4 .61
32 .95
0 .8 1.1 2 0
1 0 2 0 3 0 4 0 5 0 6 0 7 0
For est Mixed Fie ld Mangro ve Settle me nt Rice fie ld Sh rub s W ate r b od y
Lan du se
Percentage of Landuse in 2009
0 .51
6 0.6 7
0 .23
4 .9 3
1 4.9 3 17 .11
0.9 3 0 .93 0
1 0 2 0 3 0 4 0 5 0 6 0 7 0
Fore st Mixed Fie ld Man gr ove Settlemen t Ricefield Shr ub s W ate r b od y P on d
Landuse
Percentage of Landuse in 2014
Figure 2. Percentage of Kelara watershed land use in 2009
0.03
14
21
31 9
0.05
6
19 0.02
0 5 10 15 20 25 30 35
Pond Farmland Dry Far ming Land Wet Far ming Land Settlement Forestry Area Protec ted Forest Ricefield and Crops Agrofor estr y
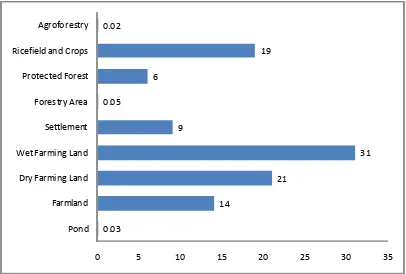
Figure 4. Percentage of Kelara watershed land use in 2009The percentage space allocation according to the spatial pattern of Jeneponto regency
Landuse in 2009
Landuse in 2014
Forest Mixed field Mangrove Residence Ricefield Shrubs* Pond Water
body Total
Forest 67 - - - - 70 - - 137
Mixed field - 7,664 - - - 7,664
Mangrove - - 13 - - 25 82 6 126
Settlement - - - 604 - - - - 604
Ricefield - 285 - 42 1,940 2,003 - 46 4,316
Shrubs - - 9 - 12 73 - 11 105
Water body - 0 10 - 3 70 7 58 147
Total 67 7,948 32 646 1,956 2,240 88 122 13,100
Note : * = shrubs and open land
Table 1. Cross tabulation of landuse in 2009 and 2014
Space pattern RT/RW
Landuse in 2014
Forest Mixed
field
Mangrov
e Residence Ricefield Shrubs Pond
Water
body Total
Agro-forestry - 197 - - - 22 - - 219
Holticulture and
ricefield 59 2,157 - - - 197 - - 2,430
Preserve forest 8 625 - - - 167 - 12 811
Cultivation area of
forestry - 7 - - - 7
Residence - 228 - 577 168 156 - 11 1,140
Wet Farming Land - 1,216 - 20 1,674 1,085 - 10 4,005
Dry Farming Land - 2,083 29 29 91 333 88 47 2,700
Farm - 1,435 - 3 23 281 - 41 1,783
Pond - - 3 - - 1 - - 4
Total 67 7,949 32 646 1,956 2,240 88 122 13,100
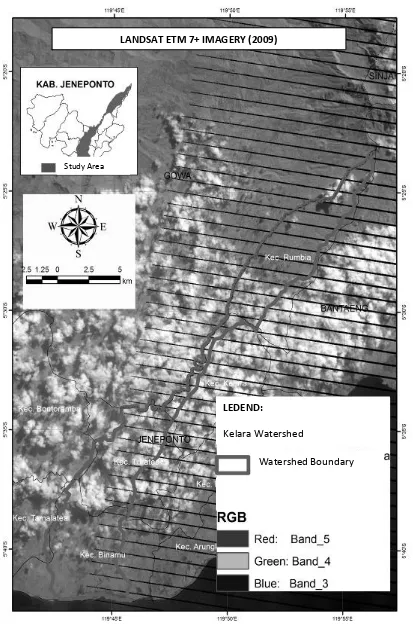
Figure 5. Landsat image ETM 7+ acquisition 2009 in Kelara watershed
LANDSAT ETM 7+ IMAG ERY (2009)
LEDEND:
Kelara Watershed
Watershed Boundary
LANDSAT 8 IMAGERY (2014)
LEDEND:
Kelara Watershed
Watershed Boundary
S tudy Area
identified significantly in 2009, within a period of 5 (five) years increased to 82 ha, primarily from the conversion of mangrove land.
Space pattern of Kelara watershed in Jeneponto regency
According to Law 26/2007 on spatial planning, spatial allocation of an area was divided according to the distribution of space pattern of that area. Space pattern was space allocation in an area that included a design of reservation and cultivation functions. Based on the overlaying results between space pattern map of RT/RW in Jeneponto regency with Kelara watershed boundaries it was indicated that the largest space allocation was given to the wetlands of agricultural cultivation area (31% equivalent to 4,005 ha), while the smallest allocation was given to ponds (4 ha) while for the preservation area was 6% of Kelara the watershed area located in Jeneponto (811 ha). Based on the data analysis result of landuse in 2009, paddy field areas (irrigated and non-irrigated) reached 4.316 ha (32.95% of Kelara watershed area in Jeneponto regency). This indicated that the allocation of land for wetland cultivation area tended to be lower than the actual condition of paddy crop in 2009. Fluctuations of the rice field area was caused by the pattern of land cultivation which was very dependent on weather patterns (rain) that occurred.
Pattern of Landuse year 2009 - 2014
To determine the tendency of changes in land use during the five (5) years in Kelara watershed in Jeneponto regency, cross tabulation analysis between the types of landuse from 2009 to 2014 was held. The result of the analysis (Table 1) showed that the biggest change in landuse (from 2009 to 2014) was a wetland. Changes in landuse classification were not caused by the conversion of landuse, but due to changes in land utilization due to limited water resources. Wetlands classified as ricefields (in 2009) partly were not cultivated in 2014 (according to satellite imagery) due to water shortage problem. As a result, most of the land changed into open land or shrubs (in this study, classification of the open land was not spesifically used and included in class of shrub land use). This study also showed that the accuracy of image classification required an explanation for any landuse changes that occured.
Landuse changes that occured in Kelara watershed in Jeneponto regency happened in all types of land use. Changes in landuse occurred in the use of ricefield. The conversion (change in land use that could not be returned into its previous use) occured
on land use for forest, mangrove, wetland, settlement, and ponds. The conversion of forest land use occured for an area of 70 ha which commonly cultivated by people for crops. Land conversion of mangrove land use to be a pond area of 82 ha and damaged mangrove land area of 25 ha. Ricefield conversion to residence covered 42 ha and 2.003 ha were left as dry land (shrubs) which were not cultivated. Those non-cultivated ricefields were due to lack of water to irrigate the areas. This condition indicated that Kelara watershed had a better management.
Conversion of land happened to the change of the function of mangrove area into pond. And it reached an average of 16 ha / year in the period of 5 (five) years in coastal regions. More alarming condition was the reduction of forest from 137 ha (in 2009) to 67 ha (2014) and the rate of forest conversion reached up to 14 ha / year. Both types of landuse conversion were quite alarming because they could cause a more severe damage to the environment.
Spatial Plan (RT/RW) and Actual Landuse
To determine consistency or inconsistency between the spatial policies in Jeneponto regency with the actual conditions of landuse in Kelara watershed, the process of cross tabulation between RT/RW spatial pattern map of Jeneponto regency and the latest land use data (Landsat 8 2014) was held. Results of the analysis were presented in Table 2, which showed the inconsistency between the spatial pattern (spatial policy) and the actual condition of land cover. It was seen from the function change of preserve forest became into mixed farms. Even there were only 8 ha of preserve forest which were actually complied with forest vegetation cover.
Similarly, in cultivation area according to spatial pattern map of Jeneponto regency, there had been a conversion of landuse into residential areas. Even the area that was actually a pond was allocated as dry land agriculture. It indicated that there was inconsistency of land use policies which quickly encouraged land use changes. If this condition was allowed continuously without serious and systematic efforts to deal with, public would experience value loss. One thing which happened today was the shortage of water supply for the various public needs.
Conclusion
year and from forest into farmland reached 14 ha / year, (3) Changes in landuse from ricefield into shrubs or open land were caused by a shortage of water for that, so that it was necessary to have a better water resource management, (4) Inconsistency between spatial policy and actual landuse was thought to be one of the factors that cause landuse changes that occured quickly.
Therefore, we recommend to solve land degradation is that landuse changes in Kelara watershed should be a concern due to land degradation potency so that there is a reduction of agricultural land for the development of food crops in this regency. It is also needed to have a land characterization study in Kelara to support the purpose of landuse which considers into account aspects of sustainability.
References
Boori, M.S., Amaro, V.E. (2010). Land use change detection for environmental management: using multi-temporal, satellite data in the Apodi Valley of northeastern Brazil, Applied GIS, 6(2), 1-15.
Chang, Kang Tsun. (2004). Introduction to Geographic Information System. McGraw Hill. USA.
Foley J.A., DeFries R., Asner G.P., Barford C., Bonan G., Carpenter S.R., Chapin F.S., Coe M.T., Daily G.C., Gibbs H.K., Helkowski J.H., Holloway T., Howard E.A., Kucharik C.J., Monfreda C., Patz J.A., Prentice
I.C., Ramankutty N, Snyder P.K. (2005). Global consequences of land use changes. Science, 309, 570–
574.
Giri, C., Zhu, Z., Reed, B. (2005). A comparative analysis of the Global Land Cover 2000 and MODIS land
cover data sets. Remote Sensing of Environment, 94, 123–132.
http://landsat.usgs.gov/landsat8.php. [19 Agustus 2014].
http://www.republika.co.id/berita/koran/industri/14/06/19/n7ejpv-miris-ipb-melaporkan-das-makin-kritis [19 Juli 2014].
Jensen, J.R. (2004). Digital change detection and introductory digital image processing: A remote sensing perspective. New Jersey, Prentice-Hall.
Junaidi, E. (2009). Kajian Berbagai Alternatif Perencanaan Pengelolaan DAS Cisadane Menggunakan Model SWAT. Tesis [Tidak dipublikasikan]. Institut Pertanian Bogor. Bogor.
Lillesand, K. (1997). Penginderaan Jauh dan Interpretasi Citra. Dulbahri (Penerjemah). Gadjah Mada University Press, Yogyakarta.
Liu JG, Mason PJ. (2009). Essential Image Processing and GIS for Remote Sensing. United Kingdom: Willey Blackwell, A John Willey and Sons, Ltd.
Lu, D., Mausel, P., Brondizio, E., Moran, E. (2004). Change detection techniques. International Journal of
Remote Sensing, 25(12), 2365–2407.
Marthen, M. (2006). Analisis inkonsistensi tata ruang dilihat dari aspek fisik wilayah: Kasus Kabupaten dan Kota Bogor. Tesis [Tidak dipublikasikan]. Institut Pertanian Bogor. Bogor.
Poerbandono, A. Basyar, A. B. Harto, dan P. Rallyanti. (2006). Evaluasi Perubahan Perilaku Erosi Daerah Aliran Sungai Citarum Hulu dengan Pemodelan Spasial. Jurnal Infrastruktur dan Lingkungan Binaan,Vol. II No. 2, Juni 2006 (21-28).
Reddy, M. A, (2008). Remote Sensing and Geographical Information Systems. Third Edition. BS Publications 4-4-309, Giriraj Lane, Sultan Bazar, Hyderabad - 500095 AP.
Schneider, L.C., Pontius Jr, R. Gil. (2001). Modeling land-use change in the Ipswich watershed, Massachusetts,
USA. Agriculture, Ecosystems and Environment 85; 83–94.
Suwarno, J. (2011). Pengembangan Kebijakan Pengelolaan Berkelanjutan DAS Ciliwung Hulu Kabupaten Bogor. Disertasi [Tidak dipublikasikan]. Institut Pertanian Bogor. Bogor.
Turner II, B.L. (1994). Global land-use/land-cover change: towards an integrated study. Ambiology 23 (1), 91–
95.