Lampiran
Alternatif 1 dengan R
2= 0.013
y = a + b1x1
y = 1,152 + 0,00002074x1
Variables Entered/Removedb
Model
Variables Entered
Variables
Removed Method 1 selisih biayaa . Enter a. All requested variables entered.
b. Dependent Variable: Probabilitas
Model Summaryb
Model R R Square
Adjusted R Square
Std. Error of the Estimate
1 .113a .013 .012 1.3461072
a. Predictors: (Constant), selisih biaya b. Dependent Variable: Probabilitas
ANOVAb
Model Sum of Squares df Mean Square F Sig. 1 Regression 69.692 1 69.692 38.462 .000a
Residual 5414.270 2988 1.812 Total 5483.962 2989
a. Predictors: (Constant), selisih biaya b. Dependent Variable: Probabilitas
Model
Unstandardized Coefficients
Standardized Coefficients
t Sig. B Std. Error Beta
1 (Constant) 1.152 .026 43.575 .000
selisih biaya 2.074E-5 .000 .113 6.202 .000 a. Dependent Variable: Probabilitas
Residuals Statisticsa
Minimum Maximum Mean Std. Deviation N Predicted Value 1.152148 1.774396 1.211979 .1526968 2990 Std. Predicted Value -.392 3.683 .000 1.000 2990 Standard Error of Predicted
Value
.026 .094 .032 .015 2990
Adjusted Predicted Value 1.151745 1.787234 1.211959 .1526150 2990 Residual -3.7641797 1.0450521 .0000000 1.3458820 2990
Std. Residual -2.796 .776 .000 1.000 2990
Stud. Residual -2.799 .777 .000 1.000 2990 Deleted Residual -3.7722628 1.0454553 .0000205 1.3465779 2990 Stud. Deleted Residual -2.803 .776 .000 1.000 2990 Mahal. Distance .154 13.566 1.000 2.746 2990
Cook's Distance .000 .009 .000 .001 2990
Alternatif 2 dengan R
2= 0.041
y = a + b
2x
2y = 1,088 + 0,323x2
Variables Entered/Removedb
Model
Variables Entered
Variables
Removed Method 1 selisih waktu . Enter a. All requested variables entered.
b. Dependent Variable: Probabilitas
Model Summaryb
Model R R Square
Adjusted R Square
Std. Error of the Estimate
1 .202a .041 .040 1.3268863
a. Predictors: (Constant), selisih waktu b. Dependent Variable: Probabilitas
ANOVAb
Model Sum of Squares df Mean Square F Sig. 1 Regression 223.208 1 223.208 126.778 .000a
Residual 5260.754 2988 1.761 Total 5483.962 2989
Coefficientsa
Model
Unstandardized Coefficients
Standardized Coefficients
t Sig. B Std. Error Beta
1 (Constant) 1.088 .027 40.822 .000
selisih waktu .323 .029 .202 11.260 .000 a. Dependent Variable: Probabilitas
Residuals Statisticsa
Minimum Maximum Mean Std. Deviation N Predicted Value 1.087915 2.055620 1.211979 .2732700 2990 Std. Predicted Value -.454 3.087 .000 1.000 2990 Standard Error of Predicted
Value
.027 .079 .032 .013 2990
Adjusted Predicted Value 1.087467 2.062888 1.211984 .2732930 2990 Residual -3.7689674 1.1092854 .0000000 1.3266643 2990
Std. Residual -2.840 .836 .000 1.000 2990
Stud. Residual -2.842 .836 .000 1.000 2990
Deleted Residual -3.7724168 1.1097330 -.0000048 1.3272949 2990 Stud. Deleted Residual -2.845 .836 .000 1.000 2990 Mahal. Distance .206 9.531 1.000 2.159 2990
Cook's Distance .000 .004 .000 .000 2990
Centered Leverage Value .000 .003 .000 .001 2990 a. Dependent Variable: Probabilitas
y = a + b3x3
y = 1,164 + 0,621x
3Variables Entered/Removedb
Model
Variables Entered
Variables
Removed Method 1 selisih headway . Enter a. All requested variables entered.
b. Dependent Variable: Probabilitas
Model Summaryb
Model R R Square
Adjusted R Square
Std. Error of the Estimate
1 .165a .027 .027 1.3362662
a. Predictors: (Constant), selisih headway b. Dependent Variable: Probabilitas
ANOVAb
Model Sum of Squares df Mean Square F Sig. 1 Regression 148.567 1 148.567 83.203 .000a
Residual 5335.395 2988 1.786 Total 5483.962 2989
a. Predictors: (Constant), selisih headway b. Dependent Variable: Probabilitas
Coefficientsa
Model Unstandardized Coefficients
Standardized
B Std. Error Beta
1 (Constant) 1.164 .025 46.580 .000
selisih headway .621 .068 .165 9.122 .000 a. Dependent Variable: Probabilitas
Residuals Statisticsa
Minimum Maximum Mean Std. Deviation N Predicted Value .853505 2.096216 1.211979 .2229456 2990 Std. Predicted Value -1.608 3.966 .000 1.000 2990 Standard Error of Predicted
Value
.025 .100 .030 .017 2990
Adjusted Predicted Value .851892 2.112784 1.212070 .2231109 2990 Residual -3.9827383 1.3436947 .0000000 1.3360426 2990
Std. Residual -2.980 1.006 .000 1.000 2990
Stud. Residual -2.984 1.006 .000 1.000 2990 Deleted Residual -3.9929149 1.3453083 -.0000902 1.3367366 2990 Stud. Deleted Residual -2.988 1.006 .000 1.000 2990 Mahal. Distance .046 15.730 1.000 3.235 2990
Cook's Distance .000 .014 .000 .001 2990
Centered Leverage Value .000 .005 .000 .001 2990 a. Dependent Variable: Probabilitas
Alternatif 4 dengan R
2= 0.016
y = a - b4x4
Variables Entered/Removedb
Model
Variables Entered
Variables
Removed Method 1 selisih service . Enter a. All requested variables entered.
b. Dependent Variable: Probabilitas
Model Summaryb
a. Predictors: (Constant), selisih service b. Dependent Variable: Probabilitas
ANOVAb
Model Sum of Squares df Mean Square F Sig. 1 Regression 86.675 1 86.675 47.984 .000a
Residual 5397.287 2988 1.806 Total 5483.962 2989
a. Predictors: (Constant), selisih service b. Dependent Variable: Probabilitas
Residuals Statisticsa
Minimum Maximum Mean Std. Deviation N Predicted Value .872869 1.784959 1.211979 .1702879 2990 Std. Predicted Value -1.991 3.365 .000 1.000 2990 Standard Error of Predicted
Value
.025 .086 .031 .015 2990
Adjusted Predicted Value .870665 1.795855 1.212107 .1703240 2990 Residual -3.8301442 1.3243310 .0000000 1.3437696 2990
Std. Residual -2.850 .985 .000 1.000 2990
Stud. Residual -2.853 .986 .000 1.000 2990
Deleted Residual -3.8392777 1.3265346 -.0001280 1.3446341 2990 Stud. Deleted Residual -2.857 .986 .000 1.001 2990 Mahal. Distance .042 11.322 1.000 2.504 2990
Cook's Distance .000 .010 .000 .001 2990
Centered Leverage Value .000 .004 .000 .001 2990 a. Dependent Variable: Probabilitas
Alternatif 5 dengan R
2= 0.015
y = a + b5x5
y = 1,146+ 0,017x
5Variables Entered/Removedb
Model
Variables Entered
Variables
1 selisih time acces
. Enter
a. All requested variables entered. b. Dependent Variable: Probabilitas
Model Summaryb
Model R R Square
Adjusted R Square
Std. Error of the Estimate
1 .124a .015 .015 1.3442821
a. Predictors: (Constant), selisih time acces b. Dependent Variable: Probabilitas
ANOVAb
Model Sum of Squares df Mean Square F Sig. 1 Regression 84.364 1 84.364 46.685 .000a
Residual 5399.598 2988 1.807 Total 5483.962 2989
a. Predictors: (Constant), selisih time acces b. Dependent Variable: Probabilitas
Coefficientsa
Model
Unstandardized Coefficients
Standardized Coefficients
t Sig. B Std. Error Beta
1 (Constant) 1.146 .026 43.342 .000
selisih time acces .017 .003 .124 6.833 .000 a. Dependent Variable: Probabilitas
Residuals Statisticsa
Std. Predicted Value -.395 4.226 .000 1.000 2990 Standard Error of Predicted
Value
.026 .107 .031 .016 2990
Adjusted Predicted Value 1.145227 1.939459 1.211990 .1680714 2990 Residual -3.6015823 1.0515664 .0000000 1.3440573 2990
Std. Residual -2.679 .782 .000 1.000 2990
Stud. Residual -2.680 .782 .000 1.000 2990
Deleted Residual -3.6043694 1.0519731 -.0000106 1.3446996 2990 Stud. Deleted Residual -2.683 .782 .000 1.000 2990 Mahal. Distance .156 17.855 1.000 3.414 2990
Cook's Distance .000 .014 .000 .000 2990
Centered Leverage Value .000 .006 .000 .001 2990 a. Dependent Variable: Probabilitas
Alternatif 6 dengan R
2= 0.064
y = a + b
1x
1+ b
2x
2y = 0,990+ 0,0000282x1+ 0,366x2
Variables Entered/Removedb
Model
Variables Entered
Variables
Removed Method 1 selisih waktu,
selisih biaya
Variables Entered/Removedb
Model
Variables Entered
Variables
Removed Method 1 selisih waktu,
selisih biaya
. Enter
a. All requested variables entered. b. Dependent Variable: Probabilitas
Model Summaryb
a. Predictors: (Constant), selisih waktu, selisih biaya b. Dependent Variable: Probabilitas
ANOVAb
Model Sum of Squares df Mean Square F Sig. 1 Regression 348.320 2 174.160 101.295 .000a
Residual 5135.642 2987 1.719 Total 5483.962 2989
a. Predictors: (Constant), selisih waktu, selisih biaya b. Dependent Variable: Probabilitas
Residuals Statisticsa
Minimum Maximum Mean Std. Deviation N Predicted Value .989652 2.088374 1.211979 .3413708 2990 Std. Predicted Value -.651 2.567 .000 1.000 2990 Standard Error of Predicted
Value
.029 .092 .038 .017 2990
Adjusted Predicted Value .989071 2.095776 1.211974 .3413769 2990 Residual -3.7516799 1.2075479 .0000000 1.3107939 2990
Std. Residual -2.861 .921 .000 1.000 2990
Stud. Residual -2.864 .921 .000 1.000 2990 Deleted Residual -3.7597382 1.2081285 .0000050 1.3116797 2990 Stud. Deleted Residual -2.868 .921 .000 1.000 2990 Mahal. Distance .437 13.608 1.999 3.218 2990
Cook's Distance .000 .007 .000 .000 2990
Centered Leverage Value .000 .005 .001 .001 2990 a. Dependent Variable: Probabilitas
Alternatif 7 dengan R
2= 0.075
y = a + b
2x
2+ b
3x
3y = 1,023 + 0,352x
2+ 0,702x
3Variables Entered/Removedb
Model
Variables Entered
Variables
1 selisih headway, selisih waktu
. Enter
a. All requested variables entered. b. Dependent Variable: Probabilitas
Model Summaryb
a. Predictors: (Constant), selisih headway, selisih waktu b. Dependent Variable: Probabilitas
ANOVAb
Model Sum of Squares df Mean Square F Sig. 1 Regression 411.134 2 205.567 121.043 .000a
Residual 5072.829 2987 1.698 Total 5483.962 2989
a. Predictors: (Constant), selisih headway, selisih waktu b. Dependent Variable: Probabilitas
Coefficientsa a. Dependent Variable: Probabilitas
Residuals Statisticsa
Std. Predicted Value -1.457 2.333 .000 1.000 2990 Standard Error of Predicted
Value
.027 .098 .037 .019 2990
Adjusted Predicted Value .669658 2.092472 1.212062 .3709668 2990 Residual -3.9221306 1.5255173 .0000000 1.3027532 2990
Std. Residual -3.010 1.171 .000 1.000 2990
Stud. Residual -3.014 1.171 .000 1.000 2990 Deleted Residual -3.9322078 1.5275418 -.0000829 1.3036267 2990 Stud. Deleted Residual -3.018 1.171 .000 1.000 2990 Mahal. Distance .274 15.735 1.999 3.641 2990
Cook's Distance .000 .009 .000 .001 2990
Centered Leverage Value .000 .005 .001 .001 2990 a. Dependent Variable: Probabilitas
Alternatif 8 dengan R
2= 0.045
y = a + b
3x
3- b
4x
4y = 1,286 + 0,644x3- 0,016x4
Variables Entered/Removedb
Model
Variables Entered
Variables
Removed Method 1 selisih service,
selisih headway
Variables Entered/Removedb
Model
Variables Entered
Variables
Removed Method 1 selisih service,
selisih headway
. Enter
a. All requested variables entered. b. Dependent Variable: Probabilitas
Model Summaryb
a. Predictors: (Constant), selisih service, selisih headway b. Dependent Variable: Probabilitas
ANOVAb
Model Sum of Squares df Mean Square F Sig. 1 Regression 245.749 2 122.874 70.067 .000a
Residual 5238.213 2987 1.754 Total 5483.962 2989
a. Predictors: (Constant), selisih service, selisih headway b. Dependent Variable: Probabilitas
Residuals Statisticsa
Minimum Maximum Mean Std. Deviation N Predicted Value .803047 2.090660 1.211979 .2867364 2990 Std. Predicted Value -1.426 3.064 .000 1.000 2990 Standard Error of Predicted
Value
.025 .099 .037 .020 2990
Adjusted Predicted Value .800684 2.107198 1.212184 .2868495 2990 Residual -3.9660704 1.3941532 .0000000 1.3238191 2990
Std. Residual -2.995 1.053 .000 1.000 2990
Stud. Residual -2.999 1.054 .000 1.000 2990 Deleted Residual -3.9762161 1.3965160 -.0002048 1.3249218 2990 Stud. Deleted Residual -3.003 1.054 .000 1.000 2990 Mahal. Distance .092 15.731 1.999 3.848 2990
Cook's Distance .000 .009 .000 .001 2990
Centered Leverage Value .000 .005 .001 .001 2990 a. Dependent Variable: Probabilitas
Alternatif 9 dengan R
2= 0.034
y = a - b4x4+ b5x5
y = 1,267 – 0,017x4+ 0,019x5
Variables Entered/Removedb
Model
Variables Entered
Variables
1 selisih time acces, selisih service
. Enter
a. All requested variables entered. b. Dependent Variable: Probabilitas
Model Summaryb
a. Predictors: (Constant), selisih time acces, selisih service b. Dependent Variable: Probabilitas
ANOVAb
Model Sum of Squares df Mean Square F Sig. 1 Regression 186.190 2 93.095 52.489 .000a
Residual 5297.772 2987 1.774 Total 5483.962 2989
a. Predictors: (Constant), selisih time acces, selisih service b. Dependent Variable: Probabilitas
Coefficientsa a. Dependent Variable: Probabilitas
Residuals Statisticsa
Std. Predicted Value -1.767 2.947 .000 1.000 2990 Standard Error of Predicted
Value
.027 .106 .037 .020 2990
Adjusted Predicted Value .768380 1.965171 1.212110 .2496298 2990 Residual -3.7946775 1.4262977 .0000000 1.3313238 2990
Std. Residual -2.849 1.071 .000 1.000 2990
Stud. Residual -2.853 1.072 .000 1.000 2990 Deleted Residual -3.8037748 1.4288205 -.0001304 1.3323740 2990 Stud. Deleted Residual -2.856 1.072 .000 1.000 2990 Mahal. Distance .213 17.874 1.999 4.016 2990
Cook's Distance .000 .009 .000 .001 2990
Centered Leverage Value .000 .006 .001 .001 2990 a. Dependent Variable: Probabilitas
Alternatif 10 dengan R
2= 0.104
y = a + b1x1+ b2x2+ b3x3
y = 0,905 + 0,00003217x1+ 0,404x2+ 0,77x3
Variables Entered/Removedb
Model
Variables Entered
Variables
1 selisih headway, selisih biaya, selisih waktu
. Enter
a. All requested variables entered. b. Dependent Variable: Probabilitas
Model Summaryb
a. Predictors: (Constant), selisih headway, selisih biaya, selisih waktu b. Dependent Variable: Probabilitas
ANOVAb
Model Sum of Squares df Mean Square F Sig. 1 Regression 571.717 3 190.572 115.843 .000a
Residual 4912.245 2986 1.645 Total 5483.962 2989
a. Predictors: (Constant), selisih headway, selisih biaya, selisih waktu b. Dependent Variable: Probabilitas
Coefficientsa a. Dependent Variable: Probabilitas
Minimum Maximum Mean Std. Deviation N Predicted Value .519722 2.116734 1.211979 .4373484 2990 Std. Predicted Value -1.583 2.069 .000 1.000 2990 Standard Error of Predicted
Value
.029 .096 .042 .020 2990
Adjusted Predicted Value .517254 2.124243 1.212045 .4374071 2990 Residual -3.8714771 1.6774777 .0000000 1.2819676 2990
Std. Residual -3.018 1.308 .000 .999 2990
Stud. Residual -3.022 1.309 .000 1.000 2990 Deleted Residual -3.8814864 1.6799457 -.0000658 1.2830999 2990 Stud. Deleted Residual -3.026 1.309 .000 1.000 2990 Mahal. Distance .534 15.740 2.999 4.138 2990
Cook's Distance .000 .007 .000 .000 2990
Centered Leverage Value .000 .005 .001 .001 2990 a. Dependent Variable: Probabilitas
Alternatif 11 dengan R
2= 0.099
y = a + b
2x
2+ b
3x
3- b
4x
4y = 1,156 + 0,376x2+ 0,734x3- 0,019x4
Variables Entered/Removedb
Model
Variables Entered
Variables
Removed Method 1 selisih service,
selisih headway, selisih waktu
Variables Entered/Removedb
Model
Variables Entered
Variables
Removed Method 1 selisih service,
selisih headway, selisih waktu
. Enter
a. All requested variables entered. b. Dependent Variable: Probabilitas
Model Summaryb
a. Predictors: (Constant), selisih service, selisih headway, selisih waktu b. Dependent Variable: Probabilitas
ANOVAb
Model Sum of Squares df Mean Square F Sig. 1 Regression 543.586 3 181.195 109.516 .000a
Residual 4940.377 2986 1.655 Total 5483.962 2989
a. Predictors: (Constant), selisih service, selisih headway, selisih waktu b. Dependent Variable: Probabilitas
Coefficientsa
Model
Unstandardized Coefficients
Standardized Coefficients
t Sig. B Std. Error Beta
1 (Constant) 1.156 .030 37.969 .000
selisih waktu .376 .028 .235 13.417 .000 selisih headway .734 .066 .194 11.123 .000 selisih service -.019 .002 -.156 -8.947 .000 a. Dependent Variable: Probabilitas
Residuals Statisticsa
Minimum Maximum Mean Std. Deviation N Predicted Value .589166 2.095856 1.211979 .4264528 2990 Std. Predicted Value -1.460 2.073 .000 1.000 2990 Standard Error of Predicted
Value
.027 .096 .043 .020 2990
Adjusted Predicted Value .586193 2.103277 1.212149 .4264868 2990 Residual -3.8983195 1.6080335 .0000000 1.2856332 2990
Std. Residual -3.031 1.250 .000 .999 2990
Stud. Residual -3.035 1.251 .000 1.000 2990 Deleted Residual -3.9083521 1.6110066 -.0001691 1.2869094 2990 Stud. Deleted Residual -3.039 1.251 .000 1.000 2990 Mahal. Distance .343 15.736 2.999 3.985 2990
Cook's Distance .000 .007 .000 .001 2990
Centered Leverage Value .000 .005 .001 .001 2990 a. Dependent Variable: Probabilitas
y = a + b3x3- b4x4+ b5x5
Removed Method 1 selisih time
acces, selisih service, selisih headway
. Enter
a. All requested variables entered. b. Dependent Variable: Probabilitas
Model Summaryb
a. Predictors: (Constant), selisih time acces, selisih service, selisih headway
b. Dependent Variable: Probabilitas
ANOVAb
Model Sum of Squares df Mean Square F Sig. 1 Regression 369.802 3 123.267 71.972 .000a
Residual 5114.160 2986 1.713 Total 5483.962 2989
a. Predictors: (Constant), selisih time acces, selisih service, selisih headway b. Dependent Variable: Probabilitas
Coefficientsa
Model Unstandardized Coefficients
Standardized
B Std. Error Beta
1 (Constant) 1.214 .031 39.668 .000
selisih headway .694 .067 .184 10.354 .000 selisih service -.018 .002 -.146 -8.233 .000 selisih time acces .021 .002 .152 8.511 .000 a. Dependent Variable: Probabilitas
Residuals Statisticsa
Minimum Maximum Mean Std. Deviation N Predicted Value .683262 2.078012 1.211979 .3517398 2990 Std. Predicted Value -1.503 2.462 .000 1.000 2990 Standard Error of Predicted
Value
.027 .104 .042 .023 2990
Adjusted Predicted Value .680520 2.094482 1.212183 .3518472 2990 Residual -3.9281261 1.5139381 .0000000 1.3080496 2990
Std. Residual -3.002 1.157 .000 .999 2990
Stud. Residual -3.005 1.158 .000 1.000 2990 Deleted Residual -3.9382205 1.5166795 -.0002033 1.3093419 2990 Stud. Deleted Residual -3.009 1.158 .000 1.000 2990 Mahal. Distance .281 17.897 2.999 4.778 2990
Cook's Distance .000 .007 .000 .001 2990
Centered Leverage Value .000 .006 .001 .002 2990 a. Dependent Variable: Probabilitas
Alternatif 13 dengan R
2= 0.135
y = a + b
1x
1+ b
2x
2+ b
3x
3-
b
4x
4Variables Entered/Removedb
Model
Variables Entered
Variables
Removed Method 1 selisih service,
selisih headway, selisih biaya, selisih waktu
. Enter
a. All requested variables entered. b. Dependent Variable: Probabilitas
Model Summaryb
a. Predictors: (Constant), selisih service, selisih headway, selisih biaya, selisih waktu
b. Dependent Variable: Probabilitas
ANOVAb
Model Sum of Squares df Mean Square F Sig. 1 Regression 738.658 4 184.664 116.162 .000a
Residual 4745.304 2985 1.590 Total 5483.962 2989
a. Predictors: (Constant), selisih service, selisih headway, selisih biaya, selisih waktu b. Dependent Variable: Probabilitas
selisih service -.021 .002 -.176 -10.248 .000 a. Dependent Variable: Probabilitas
Residuals Statisticsa
Minimum Maximum Mean Std. Deviation N Predicted Value .402234 2.141912 1.211979 .4971171 2990 Std. Predicted Value -1.629 1.871 .000 1.000 2990 Standard Error of Predicted
Value
.029 .094 .048 .020 2990
Adjusted Predicted Value .398593 2.149519 1.212108 .4971221 2990 Residual -3.8391049 1.7949660 .0000000 1.2599957 2990
Std. Residual -3.045 1.424 .000 .999 2990
Stud. Residual -3.049 1.425 .000 1.000 2990 Deleted Residual -3.8490546 1.7986073 -.0001290 1.2615281 2990 Stud. Deleted Residual -3.053 1.425 .000 1.000 2990 Mahal. Distance .636 15.742 3.999 4.255 2990
Cook's Distance .000 .006 .000 .000 2990
Centered Leverage Value .000 .005 .001 .001 2990 a. Dependent Variable: Probabilitas
Alternatif 14 dengan R
2= 0.139
y = a + b2x2+ b3x3
-
b4x4+ b5x5
y = 1,034+ 0,442x
2+ 0,819x
3-
0,022x
4+ 0,029x
5Model
Variables Entered
Variables
Removed Method 1 selisih time
a. All requested variables entered. b. Dependent Variable: Probabilitas
Model Summaryb
a. Predictors: (Constant), selisih time acces, selisih service, selisih headway, selisih waktu
b. Dependent Variable: Probabilitas
ANOVAb
Model Sum of Squares df Mean Square F Sig. 1 Regression 764.865 4 191.216 120.951 .000a
Residual 4719.097 2985 1.581 Total 5483.962 2989
a. Predictors: (Constant), selisih time acces, selisih service, selisih headway, selisih waktu b. Dependent Variable: Probabilitas
Coefficientsa
Model
Unstandardized Coefficients
Standardized Coefficients
t Sig. B Std. Error Beta
1 (Constant) 1.034 .032 32.818 .000
selisih waktu .442 .028 .277 15.808 .000 selisih headway .819 .065 .217 12.616 .000 selisih service -.022 .002 -.178 -10.362 .000 selisih time acces .029 .002 .206 11.831 .000 a. Dependent Variable: Probabilitas
Residuals Statisticsa
Minimum Maximum Mean Std. Deviation N Predicted Value .388421 2.145315 1.211979 .5058589 2990 Std. Predicted Value -1.628 1.845 .000 1.000 2990 Standard Error of Predicted
Value
.029 .100 .047 .021 2990
Adjusted Predicted Value .384746 2.152935 1.212161 .5059740 2990 Residual -3.8347292 1.8087794 .0000000 1.2565116 2990
Std. Residual -3.050 1.439 .000 .999 2990
Stud. Residual -3.054 1.440 .000 1.000 2990 Deleted Residual -3.8446686 1.8124542 -.0001820 1.2580080 2990 Stud. Deleted Residual -3.058 1.440 .000 1.000 2990 Mahal. Distance .603 18.018 3.999 4.731 2990
Cook's Distance .000 .007 .000 .000 2990
Centered Leverage Value .000 .006 .001 .002 2990 a. Dependent Variable: Probabilitas
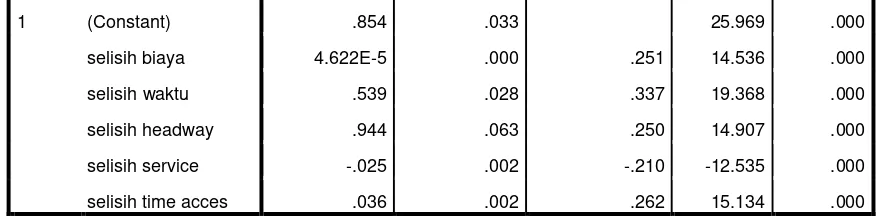
Alternatif 15 dengan R
2= 0.196
y =
0,854+
0,00004622x
1+
0,539x
2+
0,944x
3-
0,025x
4+
0,036x
5Removed Method 1 selisih time
a. All requested variables entered. b. Dependent Variable: 2.1972
Model Summaryb
a. Predictors: (Constant), selisih time acces, selisih service, selisih headway, selisih biaya, selisih waktu
b. Dependent Variable: 2.1972
ANOVAb
Model Sum of Squares df Mean Square F Sig. 1 Regression 1076.919 5 215.384 145.836 .000a
Residual 4407.043 2984 1.477 Total 5483.962 2989
a. Predictors: (Constant), selisih time acces, selisih service, selisih headway, selisih biaya, selisih waktu
b. Dependent Variable: 2.1972
1 (Constant) .854 .033 25.969 .000 selisih biaya 4.622E-5 .000 .251 14.536 .000 selisih waktu .539 .028 .337 19.368 .000 selisih headway .944 .063 .250 14.907 .000 selisih service -.025 .002 -.210 -12.535 .000 selisih time acces .036 .002 .262 15.134 .000 a. Dependent Variable: 2.1972
Residuals Statisticsa
Minimum Maximum Mean Std. Deviation N Predicted Value .092409 2.237751 1.211979 .6002449 2990 Residual -3.7409613 2.1047912 .0000000 1.2142573 2990 Std. Predicted Value -1.865 1.709 .000 1.000 2990 Std. Residual -3.078 1.732 .000 .999 2990 a. Dependent Variable: 2.1972
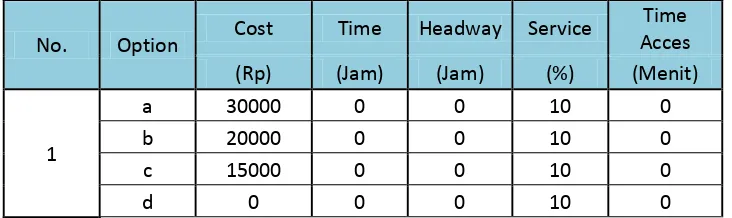
Lampiran
Tabel Pemilihan Moda
No. Option
Cost Time Headway Service Time Acces
U(SS-KA) Pr(SS) Pr(KA)
(Rp) (Jam) (Jam) (%) (Menit)