http://dx.doi.org/10.17503/Agrivita-2012-34-1-p067-074
SPATIAL AND TEMPORAL DISTRIBUTION OF NATURAL ENEMIES
VISITING REFUGIA IN A PADDY FIELD AREA IN MALANG
Wiwin Maisyaroh1*), Bagyo Yanuwiadi 2), Amin Setyo Leksono 2), Zulfaidah PG 2) 1*)
The State Islamic Institute of Jember Jl. Jumat No. 94 Mangli Jember East Java Indonesia 2)
Department of Biology, Faculty of Mathematic and Natural Sciences University of Brawijaya Jl. Veteran Malang 65145 East Java Indonesia
*) Corresponding author Phone: +62-331-487550 E-mail: [email protected]
Accepted: April 2, 2011/ Accepted: December 23, 2011
ABSTRACT
Human activities in seeking agricultural lands, has change the traditional agricultural system into intensive cultivation system. One effort to minimize intensive agriculture system is the use of natural enemies to control pests. Habitat management should be implemented by creating habitat favored by natural enemies. This research aims to determine the spatial and temporal distribution of natural enemies of wild plants: Mimosapudica, Vernoniacinera, Marsilea crenata, and Pistia startiotes on agricultural land. This research was conducted in March-April 2010 in Malang Sawojajar farmland. Plants placed in the corner field (refugia areas), visiting insects was observed starting from refugia areas and two meters away from the refugia area. Observations of insect use the "visual control" metode. The results showed that natural enemies visiting to the refugia areas were 6 orders (15 families): Coleoptera, Odonata, Aaraneae, Hymenoptera, Diptera, and Orthoptera. Not all natural enemies have spatial and temporal distribution, only 9 families who indicate a pattern spatial or and temporal distribution. Overall, natural enemies do not show any significant spatial pattern (F> 0.05), but indicate a temporal pattern (F <0.05). Therefore, the utility of refugia to attract natural enemies should be modified to be found ideal composition of refugia.
Keywords: refugia, natural enemies, visual control, spatial, temporal
INTRODUCTION
Human effort to control agricultural pests has been carried out intensively the damage of crops due to pests remain a major problem in plant cultivation. In a stable ecosystem pest problems will not occur because all components of the ecosystem in a state of balance. However, human activities in seeking agricultural lands, indirectly created an unnatural agricultural ecosystems (Kerr, 2009). Use of pesticides in controlling pest proven to have side effects such as target pests becoming resistant to pesticides, resurjensi pests, death of non target animal including natural enemies, the emergence of secondary pest, pesticide residues in crop, environmental contamination of soil, water and air, and impact on health (Agne et al. in Bahagiawati 2001). Eko (2008) stated that the residues of herbicides can alter several soil properties (soil degradation).
Pest control can not only be done synthe-tically, which is a synthetic control such as the use of pesticides have been proven harmful to humans, animals, and non-target species and the environment if done with improper procedures (Jumar, 2000). Environmentally friendly pest control can be done by maximizing the role of natural enemies in controlling pest populations. Biological pest control is done by using the natural enemies to suppress pest population below economic threshold (van den Bossch, 1982). One effort in maximizing the performance of natural enemies is to create habitat favored by natural enemies. Habitat management is done to increase the number of natural enemy populations (Helenius, 1998).
Provision of alternative habitat for natural enemies can be done by utilizing the existing
wild plants around farms. These plants can provide shelter, supplementary food source, a place to reproduce, and a place to rest (Wratten et al, 1998; Nentwig, 1998). Kozar et al (2004) showed that for homopteran pests of apple the distribution of predators was determined by the presence of alternative prey on weeds or in surrounding vegetation. In other research Mitsunaga et al. (2004) reported that a adult endoparasitoid species, Cotesia plutellae obtain material necessary fot their maintenance and survival by feeding on a number of nectar supported by wild plants. Dadi (2010), Fillaeli (2009), Rohman (2008), and Mukti (2007), mentions that the wild plants proved capable of providing support to the existence or Arthropods in the vicinity of agricultural land and also on another farm. Wicaksono et al. (2011) reported in the monoculture agriculture, there was an unbalance insect composition and high dominance. This explains that the plant diversity effect on insect diversity in agricultural land. Landis et al. (2000) explained some key in the implementation of habitat management is a selection of the most appropiate plant species and diversity of plant, and the spatial scale over which the habitat enhancement operates, with implications for the area, shape and spacing of resources and refugia for predators and parasitoids. So in this study want to determine the spatial and temporal distribution of natural enemies of refugia area (a combination of plant Mimosa pudica L., Vernonia cinera Less, Marsilea crenata Presl., Pistia startiotes L.) in agricultural land. This study is limited to visual observations performed and placement of plants at the end of fields so as to reach at the time of observation.
MATERIALS AND METHODS
This research was conducted in March until April 2010 in rice farms in Sawojajar, Malang. Materials used in this study are: alcohol 70%, refugia plants (Mimosapudica L., Vernonia cinera Less., Marsilea crenata Presl., Pistia startiotes L.), and rice crops in a rice field. This research was done by placing a wild plant on a corner plot in the field, hereinafter referred to as refugia area. Prior to observation, plants were grown in polybags and acclimatized for three weeks. Observation of visiting natural enemies
conducted by using the “visual control’ (Freie
and Manhart, 1992).
Visual control method is a distance observation, which is directly observed insect visiting refugia areas and clumps of rice away from the refugia area, a distance of two meters and observations made within a certain time. Observations of insects performed on four plots, the distance between plots was two meters. Plot size is 1x1 m2. The first plot was an area that contained a combination of plant refugia, while second, third, and fourth plots were consisted of rice crops. Observations in each plot was conducted in 15 minutes and consisted of 4 observation periods. Period I was at 7:00 to 08:00 o'clock, period II at 9:00 to 10:00 a.m., period III was at 12:00 to 13:00, and period IV was at 3:00 p.m. to 4:00 p.m. Observations were repeated for 15 days (15 replications).
RESULTS AND DISCUSSION
Overall Natural Enemy
Overall, this study observed 1376 individuals of natural enemies consisted of 6 orders, namely: Coleoptera, Odonata, Araneae, Hymenoptera, Diptera, and Orthoptera, from 6 orders are divided into 15 families. This study showed that plot with wild plant (refugia area) attracted more number of individuals of natural enemies. This means that conservation of wild plant species as a area of refugia have potentially attracted natural enemies.
natural enemy abundance during the whole growing less and less
Spatial and Temporal Distribution of Refugia Visiting Natural Enemies
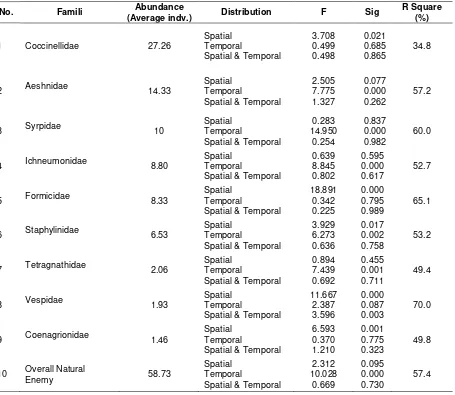
The results showed that not all natural enemies have significance in the spatial and temporal distribution. Each family show different patterns. Of the 15 families there are nine families of natural enemies that show a significant pattern of spatial and or temporal distribution. Natural enemies as a whole did not show significance on the spatial distribution patterns (F> 0.05), but showed the significance of the temporal distribution patterns (F <0.05) (Table 1).
Spatial Distribution of Natural Enemies
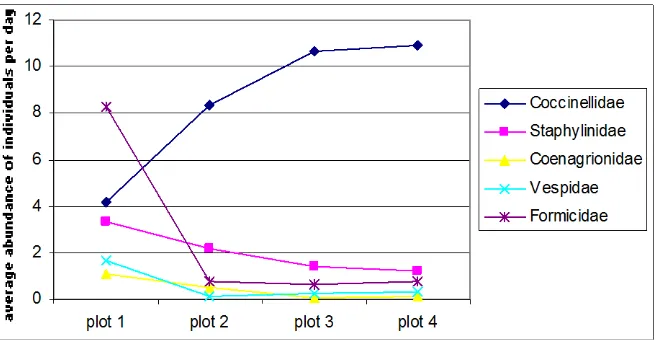
Natural enemies that have a spatial distribution pattern is composed of five families: Coccinellidae, Staphylinidae, Coenagrionidae, Vespidae and Formicidae
The average abundance of Coccinellidae peaked in the fourth plot (Figure 2). Based on the calculations, R-square value of 0.348 or 34.8% Coccinellidae traffic patterns are influenced by the spatial and temporal. While the remaining 65.2% influenced by other variables (Table 1). The results showed that the Cocci-nellidae have significance on the spatial distribution (F <0.05), and further test results from the determination of polynomial pattern, showing a linear model significantly (P <0.05), while Sig quadratic and cubic model was not significant (P> 0.05). Is concluded that the spatial distribution Coccinellidae a linear model. The average abundance of Staphylinidae peaked in the first plot (Figure 2). Based on the calculations, R-square value of 0.532 or 53.2% of visits Staphylinidae patterns are influenced by spatial and temporal distribution. While the remaining 46.8% influenced by other variables (Table 1). The results showed that Staphylinidae have significance on the spatial distribution (F
<0.05). Based on the results of further testing the determination of polynomial pattern, showing a linear model was significant (P <0.05), while Sig quadratic and cubic model was not significant (P> 0.05). It is concluded that the spatial distribution Staphylinidae is a linear model.
The average abundance of Coenagrio-nidae peaked in the first plot (Figure 2). Based on the calculations, R-square value is 0.498 or 49.8% of visits Coenagrionidae patterns are influenced by spatial and temporal distribution. While the remaining 50.2% influenced by other variables (Table 1). The results showed that the Coenagrionidae have significance on the spatial distribution (F <0.05), and based on the results of further testing the determination of polynomial pattern, showing a linear model was significant (P <0.05). so it can be concluded that the spatial distribution Coenagrionidae is a linear model.
The average abundance of Vespidae peaked in the first plot (Figure 2). Based on the calculations, R-square value is 0.700 or 70.0% of visits Vespidae influenced by spatial and temporal distribution. While the remaining 30.0% influenced by other variables (Table 1). The results showed that Vespidae have significance on the spatial and temporal distribution interaction (F <0.05). Based on the results of Tukey test showed that the family of Vespidae have a visit in the third temporal and in the first plot.
(a) spatial distribution
periode 1 periode 2 periode 3 periode 4
a
Figure 1. Spatial distribution (a) and temporal distribution (b) all Natural enemies Table 1 Spatial and temporal distribution of natural enemies in the area of refugia
No. Famili Abundance
(Average indv.) Distribution F Sig
R Square (%)
1 Coccinellidae 27.26
Spatial
7 Tetragnathidae 2.06
Spatial
9 Coenagrionidae 1.46
Spatial
10 Overall Natural
Figure 2. Spatial distribution of natural enemies Coccinellidae family that has an
abun-dance of most, is one of the beneficial insects, some insects of the family Coccinellidae eat aphids, scale insects, and insects that damage other people, and mites (Borror, et al., 1992). The existence of this family allegedly because of the existing wild plants. Family Coccinellidae able to respond to odors released by wild plants. Rahman (2008) explains that the insect is able to select and respond to volatile compounds from plants. Predator response to volatile compounds released by plants is influenced by the high sensitivity of the olfactory receptor organs. If the source of the chemical compounds from plants that received by the insects is less clear, then the insects will move with an irregular pattern and tends toward a nearby object and then move back to the insects of this finding signals a favorite plant volatiles (Van de Press, 1981 in Metcalf and Metcalf, 1992). Coanagrino-dae which has an abundance of little, a bunch of dragonflies Odonata, Odonata known as an insect that has a very active movement, and is one of great potential predators being able to prey on pests in large numbers. The abundance of the factors thought to Coenagrionidae little competition with other predators, as well as existing plants are less favored by the family.
Based on research result shows that the natural enemies that have a spatial distribution pattern consists of 5 families, namely:
Cocci-nellidae, Staphylinidae, Coenagrionidae, Vespidae and Formicidae. This suggests that each insect has a different response in capturing the volatile compounds released by certain plants. It is influenced by the high sensitivity of olfactory receptor organs owned by each insect. Insects are programmed to respond to the signs of the environment such as light, gravity, odor and other stimuli. Metcalf and Metcalf (1992) explained that the smell that was caught by the olfactory organs of arthropods will respond in the form of behavior. Arthropods respond to the smell of spent plants by visiting such plants. Generally the activity is conducted in order to select the host, find food, find shelter and looking for a partner. Hadi, et al. (2009) also explains that in the process of determining the host, morphology and physiology of the plant is a source of stimulation that are important to insects. Morphological characteristics of certain plants can produce physical stimulation for the activity of insect feeding or egg laying activity. Physiological traits are in the form of chemical substances produced by plant metabolism
Temporal Distribution Pattern of Several Natural Enemies
Figure 3. Temporal distribution of natural enemies The average abundance of Staphylinidae
peaked on the first temporal (Figure 3). The results showed that Staphylinidae have significance on the temporal distribution (F <0.05) (Table 1). Based on the results of further test the determination of polynomial pattern, showed linear and quadratic models was significant (P<0.05). This showed that spatial distribution of Staphylinidae was linear and quadratic shaped.
The average abundance of Aeshnidae peaked in the third temporal (Fig. 3). Based on the calculations, R-square value of 0572 or 57.2% Aeshnidae visit pattern are influenced by spatial and temporal distribution. While the remaining 42.8% influenced by other variables (Table 1). The results showed that Aeshnidae have significance on the temporal distribution (F> 0.05). Based on the results of further tests determining the pattern of polynomials, showing linear, quadratic, and cubic model was significant (P <0.05). It is concluded that the temporal distribution of Aeshnidae is linear, quadratic and cubic-shaped.
The average abundance of Syrpidae were peaked on the both temporal (figure 3). Based on the calculation, the R-square value of 0,600 or 60.0% of Syrpidae visit pattern were influenced by spatial and temporal distribution. While the rest 40.0% are influenced by other variables (table 1). The result showed that Syrpidae have significance on the temporal distribution (F <0.05). Based on the results of further test the determination of polynomial pattern, showed linear, quadratic and cubic
models was significant (P<0.05), This inferred that temporal distribution of Syrpidae was linear quadratic and cubic.
The average abundance of Tetragnathidae were peaked on the first temporal (figure 3). Based on the calculation, the R-square value of 0.494 or 49.4% of Tetragnathidae visiting patterns were influenced by spatial and temporal distribution. While the rest 50.6% are influenced by other variable (Table 1). The result showed that Tetrag-nathidae have significance on the temporal distribution (F <0.05) Based on the results of further test the determination of polynomial pattern, showed linear and cubic models was significant (P<0,05), while Sig quadratic models were not significant (P>0.05) This inferred that temporal distribution of Tetragnathidae was linear and cubic shaped.
The average abundance of Ichneumo-nidae were peaked on the both temporal (Figure 3). Based on the calculation, the R-square value of 0.527 or 52.7% of Ichneumonidae visiting patterns were influenced by spatial and temporal distribution. While the rest 47.3% are influenced by other variables (Table 1). The result showed that Ichneumonidae have significance on the temporal distribution (F <0.05). Based on the results of further test the determination of polynomial pattern, showed linear and cubic models was significant (P>0.05), while Sig quadratic models were not significant (P>0.05). This inferred that spatial distribution Ichneumonidae was linear and cubic-shaped.
Staphylinidae, Aeshnidae, Syrpidae, Tetragna-thidae, and Ichneumonidae, and overall natural enemies also simply indicate a pattern of temporal distribution. Each insect has a different response to the environment, it is a form of business in defending themselves to survive. Sensitivity of insects in response to environ-mental change is a form of self-adaptation to find the optimum environment during the period of its development. Jumar (2000) explains that the insect has a certain temperature range in which he lived, the influence of this temperature effect on the process of insect physiology. In Borror, et al. (1992) also described the insects are cold-blooded creatures, when the environmental temperature decreases the body temperature will also decrease and physiological processes of insects will be slow. Many insects resistant to extreme temperatures in a short period, but some can survive in extreme temperatures or under extreme in a long time.
Soil moisture, air, and where insect life is also a factor that can influence the distribution, activities, and development of insects. Humidity will affect the evaporation of body fluids of insects, and also the preference of insects to live and the hiding-place addition insect activity are often very influenced by the response to light, so there is a kind of insect is active in the morning, noon, afternoon, or evening. Sunlight can also affect the activity and its local distribution. In addition, insect movement was also aided by the wind, which plays a role in helping the spread of insects, especially for small-sized insects (Jumar, 2000).
CONCLUSIONS AND SUGGESTIONS
This study shows that the plot with wild plants (blog refugia) to attract more number of natural enemies. These natural enemies consisted of six orders: Coleoptera, Odonata, Araneae, Hymenoptera, Diptera, and Orthoptera are divided into 15 families. 9 families demonstrated the significance of spatial and temporal distribution patterns. Coccinellidae, Stphylinidae, Coenagrionidae, Vespidae and Formicidae have significance on the spatial distribution. While Stphylinidae, Aeshnidae, Syr-pidae, Tetragnathidae and Ichneumonidae have significance in the temporal distribution. Based on these results prove that wild plants are able to attract natural enemies around rice fields.
Varied vegetation can attract more natural enemies, but still required further study to find a more appropriate composition that can really maximize the role of natural enemies.
ACKNOWLEDGEMENTS
The authors would like to thank to all those who have helped in this work. Especially to the Graduate Program of Brawijaya University which has provided the opportunity to do research. Thanks also to the Team Refugia for the cooperation, and to all parties who have provided constructive criticism and suggestions.
REFERENCES
Bahagiawati. 2001. Manajemen resistensi serang-ga hama pada pertanaman tanaman transgenik Bt. Buletin AgroBio. 4(1): 1-8 Borror, D.J., C.A. Triplehorn and N.F. Johnson.
1992. Pengenalan pelajaran serangga. Terjemahan Soetiyono Partosoedjono. Sixth edition. Gadjah Mada University Press. Yogyakarta. p. 7-405.
Dadi. 2010. Potensi agroforestri pendukung eksistensi Arthropoda predator wereng padi di ekosistem sawah. Disser-tation.Study Program of Agricultural Sciences. Graduate Program Brawijaya University. p. 23-45.
Fillaeli, S. N. 2009. Ketertarikan Artrhopoda pada kunyit (Curcuma domestica Val.) dan bawa-ngan (Commelina benghalensis L.) di lahan budidaya Porang Madiun. Thesis Biology Department Faculty of Mathe-matics and Science Brawijaya University. p.34-39.
Frei, G. and C. Manhart. 1992. Nützlinge und Schadlinge an Kunstlich Angelegten Acker-kraustreifen in Getreidefeldern. Agrarö-kologie 4: 17-20
Hadi, M., U. Tarwotjo and R. Rahadian. 2009. Biologi insekta : Entomologi. Graha Ilmu. Yogyakarta. p. 27-59.
Jumar. 2000. Entomologi pertanian. Rineka Cipta. Jakarta. p.24-87.
Kerr, J. 2009. Pangan: Pro dan kontra pangan modern. Tiga Serangkai. Solo.p.3-15.
Kozar F, M.W. Brown and G. Lightner. 1994. Spatial distribution of homopteran pests and beneficial insects in an orchard and its connection with ecological plant pro-tection. J. Appl. Entomol.117: 519–529 Landis, D.A., S.D. Wratten and G.M. Gurr. 2000.
Habitat management to conserve natural enemies of Arthropoda pest in agriculture. Annual Review of Entomology. 45: 175-201
Metcalf, R.L and E.R. Metcalf. 1992. Plant kae-romones in insect ecology and control. Chapman and Hall. New York.
Mukti, M. 2007. Preferensi kumbang kubah (Coccinellidae), belalang sembah (Mantidae), dan laba-laba serigala (Lycosidae) terhadap tumbuhan liar Borreria repens DC., Bidens pilosa L., dan Centella asiatica (L.) Urb. Thesis Biology Department Faculty of Mathematics and Science UM, Malang. p.18-30.
Mitsunaga, T., T. Shimoda and E. Yano. 2004. Influence of food suplly on longevity and parasitization ability of a larval endoparasitoid, Cotesia plutellae (Hyme-noptera : Braconidae). J. Appl. Entomol. 39(4):691-697
Nentwig, W. 1998. Weedy plant species and their benefical Arthropods : Potential for
manipulation in field crops. in. C.H. Pickett and R.L. Bugg (ed.). Enhanching biological control: Habitat management to promote natural enemies of agricultural pest. University of California Press. Berkeley, Los Angeles. p. 49-67.
Rohman, F. 2008. Struktur komunitas tumbu-han liar dan Artrhopoda sebagai komponen evaluasi agroekosistem di kebun teh Wonosari, Singosari, Kabupa-ten Malang. Dissertation. Study Program of Agricultural Sciences. Graduate Program Brawijaya University. p.42-56. van den Bosch, R., P.S. Messenger and A.P.
Gutierrez. 1982. An Introduction to Biolo-gical Control. Plenum Press, New York.
Wicaksono, K.P., A. Suryanto, A. Nugroho. N. Nakagoshi and N. Kurniawan. 2011. Insect as biological indicator from protect-ted to the distrub landscape in Central Java Indonesia. Agrivita Vol 33 (1): 75-84