Desember 2008. Vol. 7 No. 2. pp. 113 – 120
113
PERFORMANCE EFFICIENCY OF
SELECTED PHILIPPINES FOOD AND
BEVERAGE MANUFACTURING
COMPANIES
Fanny Soewignyo
Staff Pengajar Fakultas Ekonomi Universitas Klabat
The purpose of this paper is to evaluate and measure the efficiency performance of selected Philippines food and beverage manufacturing companies covering from 2005 to 2007. Two input and output variables of five companies listed in the Philippine Stock Exchange were examined using Data Envelopment Analysis (DEA) model to evaluate the companies’ performance. The results generally indicate that too much capital use and high operating expenses in conjunction with low revenue or sales characterize inefficient operations. The result suggests that the companies with the presence of slack must evaluate especially the idle capital, inefficient use of operating expenses and concentrate on increasing the total sales. DEA approach is able to determine the benchmarking company among other Philippines food and beverage manufacturing companies.
Keywords: DEA, Food and beverage, Manufacturing companies, Performance efficiency
INTRODUCTION
This study focus on performance efficiency of selected Philippines food and beverage manufacturing companies listed in the Philippine Stock Exchange, using Data Envelopment analysis (DEA). DEA is a mathematical programming methodology that can be applied to evaluate performance and activities of organizations using a variety of input and output data. (Cooper, Seiford & Tone, 2000).
Amid a difficult economic climate, the Philippines food and beverages companies believes to deliver reliable growth this year as it continues to invest in product and marketing innovations while pursuing programs to achieve both financial and operational efficiencies (Cojuangco, 2008). RFM reported in the disclosure that the implementation of better plant efficiencies and cost reduction programs have aided in offsetting the rising costs of domestic raw materials, freight and handling, utilities, and wages, that in turn, helped preserve operating margins. (RFM Corporation, 2008).
RNCOS research reported (2006), consumer expenditure on food, beverages and tobacco has increased strongly during 2001-2006 at a CAGR of 9.8% and it is expected to rise at a CAGR of 7.5% from 2007 to 2011. Rise in the number of working women, longer working hours and more diverse eating habit has resulted in high consumption of ready-to-eat meals. Result from 2007 interviews conducted by Food and Beverage Team of Deloitte Touche Tohmatsu (2008) with the 93 top-level executives at leading food and beverage companies in Europe, Middle East, and Africa (EMEA) and the
Americas (61% manufacturers and 39% retailers and food service companies), food and beverage producers have been concentrating on cost containment more than on price increases – from purchasing machinery, getting faster, and working with suppliers, to maintain current prices or reduce price increases. Rising input costs are the big factor in food and beverage processing.
This study tried to determine and assess the efficiency performance of the five food and beverage manufacturing companies covering the period of 2005-2007. Like most businesses today, manufacturers face a variety of factors that can impact the performance of their company. Many of these business variables are beyond an organization’s control, such as the rising cost of energy and materials, global competition, and the introduction of new regulatory mandates. These factors directly impact the cost of goods sold, influence the final price, and continually put financial performance in jeopardy. The way a company responds to these factors can impact long-term customer satisfaction and loyalty and more importantly, the business profitability. This study aims to evaluate and measure the efficiency performance of selected food and beverage manufacturing companies covering from 2005 to 2007. Specifically, three (3) main objectives have to be addressed by this study: 1.To evaluate the relative efficiency of the selected food and beverage manufacturing companies using the Data Envelopment Analysis (DEA). 2.To assess whether or not there are input (excesses) and output slacks (deficits). 3. To benchmark the efficient company against the
Journal of Business and Economics (JBE), Desember 2008. Vol. 7 No. 2
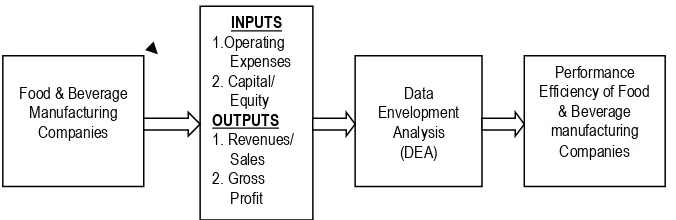
114 Figure 1. Conceptual Framework Describing the Performance Efficiency of Selected Philippines Food and Beverage
Manufacturing Companies
The relative efficiency of the Food and Beverage Manufacturing Companies was measured using two (2) input factors, namely: operating expenses and capital/equity and the two (2) output variables were total revenues/sales and gross profit.
Literature Review
To Evaluate The Relative Efficiency. Conventional data envelopment analysis (DEA) assists decision makers in distinguishing between efficient and inefficient decision-making units (DMUs) in a homogeneous group. Liu & Hao (2008) proposes a methodology to determine one common set of weights for the performance indices of only DEA efficient DMUs. Then, these DMUs are ranked according to the efficiency score weighted by the common set of weights.
Edirisinghe & Zhang (2008) propose an approach to combine financial statement data using Data Envelopment Analysis to determine a relative financial strength (RFS) indicator. Such an indicator captures a firm's fundamental strength or competitiveness in comparison to all other firms in the industry/market segment. While Lee, Hu & Ko (2008) uses Data envelopment analysis (DEA) and Wilcoxon signed-rank test to analyze the firms' managerial efficiency and financial performance. It is found that ISO 14000 can be an effective strategy for Taiwan's manufacturing firms to improve their managerial efficiencies and maintain competitiveness.
An analytical approach based on data envelopment analysis (DEA) is proposed by Dong & Liang (2005) for measuring the relative efficiency of an ISO 9000 certified firm's ability to achieve organizational benefits. The best in class of ISO performers can be further identified on the basis of their ranking with efficiency score. The results also recognize specific areas where improvement is needed in an inefficient or poor ISO performer. By careful examination managers can detect their organization's policy constraints and evaluate the effectiveness of managerial activities.
Narasimhan, Talluri & Das (2004) presents a conceptual model that introduces two new constructs: flexibility competence and execution competence as distinct from manufacturing flexibility. Based on the proposed conceptual model and a multistage data envelopment analysis (MDEA) of empirical data, the roles of flexibility and execution competencies in determining performance are examined. The results indicate that some firms are more effective than others in exploiting investments in advanced manufacturing technologies and strategic sourcing initiatives to develop manufacturing flexibilities.
Petroni & Bevilacqua (2002) applied DEA to identify small and medium-sized enterprises (SMEs) that operate on the frontier of manufacturing flexibility practice. Data were obtained via a questionnaire survey that considered seven basic dimensions of manufacturing flexibility. Subsequently, discriminant analysis was carried out to delineate which contextual factors and managerial aspects characterize the firms that have reached the best practice status. Finally, on-site investigation was carried out with the excellent firms to better delineate their organizational and strategic profile.
Slack Analysis. Using slack analysis in DEA, Bao, Chen & Chang (2008) calculate the ranking of all DMUs by utilizing the available information from the linear program outputs with fewer computations and offers an alternative interpretation to cross-efficiency method based on peer-evaluation logic.
Benchmark. Ahmad (2005) focuses on developing a model that can be used to assess the performance of Small to Medium-Sized Manufacturing Enterprises (SMEs) and then utilizing it to identify the top SMEs in order to provide a set of performance benchmarks for the SMEs. This research demonstrates that by eliminating flaws and taking advantage of each methodology's specific characteristics in identifying and solving problems, the new integrated AHP (Analytical Hierarchy Process)/DEA model appears to be a logical and sensible solution in multi-criteria decision-making problem. Even though this study focuses on an efficiency evaluation of
Food & Beverage Manufacturing
Companies
INPUTS
1.Operating Expenses 2. Capital/
Equity
OUTPUTS
1. Revenues/ Sales 2. Gross Profit
Data Envelopment
Analysis (DEA)
Performance Efficiency of Food
& Beverage manufacturing
Fanny Soewignyo – Performance Efficiency of Selected
SMEs, its applicability can be extended to the non-SMEs problem as well.
Ding (2004) research finding states that the primary criterion for manufacturing performance is the control of costs, sometimes supplemented by another criterion concerning the achievement of on-time delivery and finally, the thesis considers benchmark analysis of manufacturing and how to incorporate speed into efficiency analysis. New objective functions for data envelopment analysis are formulated and applied to industry data to demonstrate improved comparisons of manufacturing efficiency that evaluate differences in speed. Leachman, Pegels, & Seung (2005) examine manufacturing performance along individual benchmarking dimensions and develop a performance metric based on quality and output volume to assess a firm's manufacturing competitiveness in relation to its major rivals. Several key manufacturing practices are examined for their impact on performance. The relative manufacturing performance is measured by data envelopment analysis (DEA). Wang (2006), used Data Envelopment Analysis (DEA) to evaluate the Total Productive Maintenance (TPM) efficiency to assist factories in improving operations across a variety of dimensions. The proposed methodology can identify a
peer group of efficient factories against which to benchmark factories and engaging in re-engineering programs.
Methodologies
Several sources like book, journals, business news and online databases have been tapped to obtain information necessary for this study.
The study examined the two input and output variables of five (5) Philippines food and beverage manufacturing companies listed in the Philippine Stock Exchange, specifically over the time period of 2005 to 2007 using Data Envelopment Analysis (DEA) model to evaluate the companies’ performance. It specifically used quantitative and descriptive techniques. Quantitative methods are used in processing numerical variables and descriptive methods in interpreting, organizing, summarizing and presenting data in an informative way.
The empirical analysis covered a total of 15 observations which is 3 years x 5 food and beverage manufacturing companies.
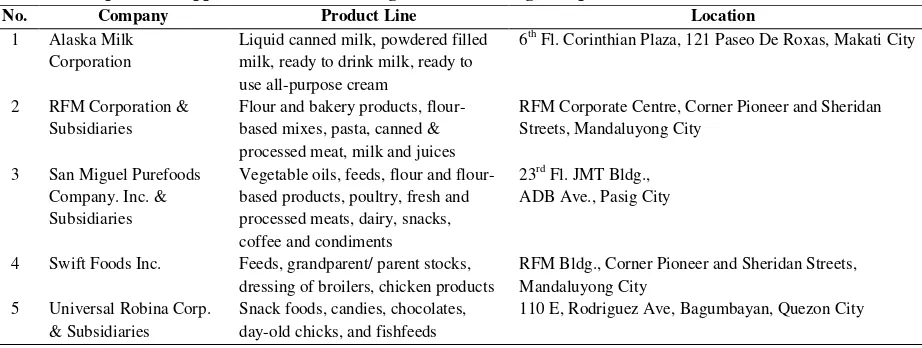
Table 1 shows the list of food and beverage manufacturing companies as sample firms included in this study.
Table 1. Sample of Philippines Food and Beverage Manufacturing Companies
No. Company Product Line Location
1 Alaska Milk Corporation
Liquid canned milk, powdered filled milk, ready to drink milk, ready to use all-purpose cream
6th Fl. Corinthian Plaza, 121 Paseo De Roxas, Makati City
2 RFM Corporation & Subsidiaries
Flour and bakery products, flour-based mixes, pasta, canned & processed meat, milk and juices
RFM Corporate Centre, Corner Pioneer and Sheridan Streets, Mandaluyong City
3 San Miguel Purefoods Company. Inc. & Subsidiaries
Vegetable oils, feeds, flour and flour-based products, poultry, fresh and processed meats, dairy, snacks, coffee and condiments
23rd Fl. JMT Bldg., ADB Ave., Pasig City
4 Swift Foods Inc. Feeds, grandparent/ parent stocks, dressing of broilers, chicken products
RFM Bldg., Corner Pioneer and Sheridan Streets, Mandaluyong City
5 Universal Robina Corp. & Subsidiaries
Snack foods, candies, chocolates, day-old chicks, and fishfeeds
110 E, Rodriguez Ave, Bagumbayan, Quezon City
These five (5) samples were treated as decision making units (DMUs), considering two (2) input and two (2) output factors. Input factors of DMUs measured were: capital/equity and operating expenses. On the other hand, output factors are composed of total revenues/sales and gross profit. The input and output data were taken from
the audited 2007 financial statements of the five companies included in the published annual report of Philippine Stock Exchange online database and summarized in table 2.
Table 2. Input and Output data DMU
Period DMU Name INPUT OUTPUT
No. Capital OPEX Revenue Gross Profit
1 2005 Alaska Milk Corporation 3,122,404 954,012 5,409,669 1,301,970
2 2005 RFM Corporation &
Subsidiaries 4,203,050 1,172,618 6,045,344 1,528,462
3 2005 San Miguel Purefoods co
Inc.&Subs 12,548,734 5,474,789 50,423,627 7,190,750
4 2005 Swift Foods Inc. 245,161 255,958 3,714,101 144,767
5 2005 Universal Robina
Corp.&Subsid 25,185,104 5,230,519 31,199,276 7,891,563
6 2006 Alaska Milk Corporation 3,338,592 1,027,220 5,920,865 1,541,668
Journal of Business and Economics (JBE), Desember 2008. Vol. 7 No. 2 DMU
Period DMU Name INPUT OUTPUT
No. Capital OPEX Revenue Gross Profit
Subsidiaries
8 2006 San Miguel Purefoods
co.Inc.&Subsid 13,576,703 6,441,110 52,963,218 8,334,025
9 2006 Swift Foods Inc. 292,708 206,147 3,727,623 345,491
10 2006 Universal Robina Corp.&Subs 31,227,015 6,122,748 35,183,815 8,823,841
11 2007 Alaska Milk Corporation 3,727,545 1,437,278 9,081,801 2,387,163
12 2007 RFM Corporation &
Subsidiaries 4,738,570 1,411,331 6,987,805 1,536,209
13 2007 San Miguel Purefoods
co.Inc.&Subs 14,810,142 7,564,430 62,052,029 9,960,352
14 2007 Swift Foods Inc. 375,955 170,548 3,022,146 204,757
15 2007 Universal Robina
Corp.&Subsidiaries 34,995,703 6,923,155 37,720,261 10,103,483 Empirical Results. This part focuses on the
findings and analysis of the present study and addresses the specific objectives presented in this paper. The variables subjected to the DEA method under the constant returns of scale (CRS) assumption was used for the cross
sectional analyses of the fifteen (15) pooled data or decision making units (DMUs), from the five (5) selected food and beverage manufacturing companies in the Philippines. Furthermore, the DEA method presented a slack analysis for the DMUs used for benchmarking.
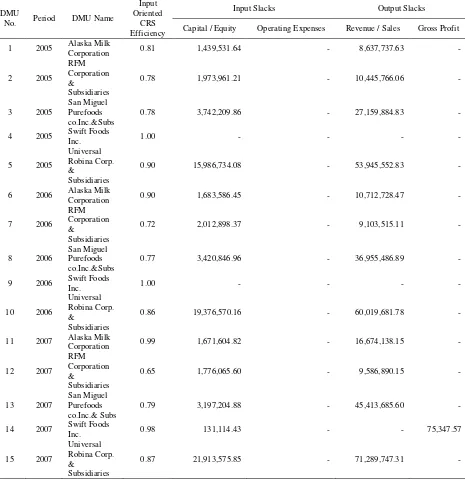
To Evaluate the Relative Efficiency Performance of the Food and Beverage Manufacturing Companies Table 3. Summary of Efficiency Performance of Food & Beverage Companies with Input – Output Slacks
DMU
No. Period DMU Name
Input
Oriented Input Slacks Output Slacks
CRS
Efficiency Capital / Equity Operating Expenses Revenue / Sales Gross Profit 1 2005 Alaska Milk
Corporation 0.81 1,439,531.64 - 8,637,737.63 -
2 2005 RFM Corporation &
Subsidiaries
0.78 1,973,961.21 - 10,445,766.06 -
3 2005
San Miguel Purefoods co.Inc.&Subs
0.78 3,742,209.86 - 27,159,884.83 -
4 2005 Swift Foods
Inc. 1.00 - - - -
5 2005
Universal Robina Corp. &
Subsidiaries
0.90 15,986,734.08 - 53,945,552.83 -
6 2006 Alaska Milk
Corporation 0.90 1,683,586.45 - 10,712,728.47 -
7 2006 RFM Corporation &
Subsidiaries
0.72 2,012,898.37 - 9,103,515.11 -
8 2006
San Miguel Purefoods co.Inc.&Subs
0.77 3,420,846.96 - 36,955,486.89 -
9 2006 Swift Foods
Inc. 1.00 - - - -
10 2006
Universal Robina Corp. &
Subsidiaries
0.86 19,376,570.16 - 60,019,681.78 -
11 2007 Alaska Milk
Corporation 0.99 1,671,604.82 - 16,674,138.15 -
12 2007 RFM Corporation &
Subsidiaries
0.65 1,776,065.60 - 9,586,890.15 -
13 2007
San Miguel Purefoods co.Inc.& Subs
0.79 3,197,204.88 - 45,413,685.60 -
14 2007 Swift Foods
Inc. 0.98 131,114.43 - - 75,347.57
15 2007
Universal Robina Corp. &
Subsidiaries
Desember 2008. Vol. 7 No. 2. pp. 113 – 120
113
As shown on DEA results presented in Table 3, Swift Foods Inc. performance in 2005 and 2006 were identified as DEA-efficient. That is, the company has no input or output inefficiencies, thereby having DEA efficiency scores equal to 1. By minimizing the operating expenses through cost reduction and cost savings and at the same maximizing the output (revenue) by increasing the selling price, SFI performance resulted as the efficient frontier and represent the best practice for balancing capital and operating expenses to generate revenue and gross profit. Next to Swift Foods Inc. efficiency is Alaska
Milk Corporation, which posted low efficiency scores in 2005 and 2006 due to increased in operational expenses brought by selling and advertising costs to grow sales volume. But in 2007, the Alaska sales increased by 53%, (output maximized while maintaining relatively low increase of input level) which drove the efficiency score to 0.99, the highest among the companies in 2007. The rest of the companies particularly San Miguel Purefoods and RFM Corporations displayed low efficiency scores in three consecutives years.
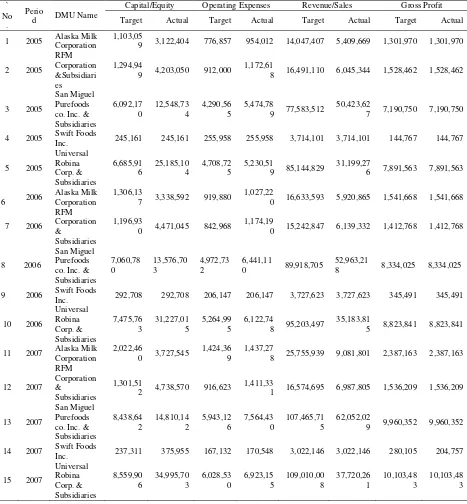
To assess whether or not there are input (excesses) and output slacks (deficits). Table 4. Summary of Inputs - Output Targets and Actual (in thousands)
` Perio
d DMU Name
Capital/Equity Operating Expenses Revenue/Sales Gross Profit No
. Target Actual Target Actual Target Actual Target Actual
1 2005 Alaska Milk Corporation
1,103,05
9 3,122,404 776,857 954,012 14,047,407 5,409,669 1,301,970 1,301,970
2 2005
8 16,491,110 6,045,344 1,528,462 1,528,462
3 2005
0 16,633,593 5,920,865 1,541,668 1,541,668
7 2006
0 15,242,847 6,139,332 1,412,768 1,412,768
8 2006
8 25,755,939 9,081,801 2,387,163 2,387,163
12 2007
1 16,574,695 6,987,805 1,536,209 1,536,209
13 2007
with the original data gathered. The efficient DMUs have reached the input and output target. In terms of gross profit, DMU 14 (Swift Foods Inc. – 2007) is the only DMU which has not reached the target while all others
Journal of Business and Economics (JBE) Desember 2008. Vol. 7 No. 2. pp. 113 – 120
113
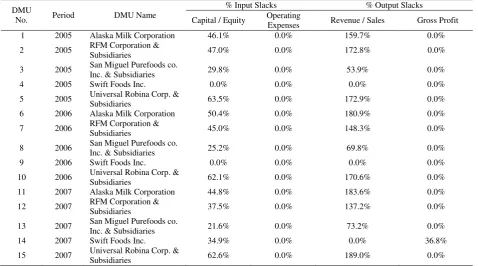
Table 5. Percentage of Input and Output Slacks
DMU
No. Period DMU Name
% Input Slacks % Output Slacks
Capital / Equity Operating
Expenses Revenue / Sales Gross Profit
1 2005 Alaska Milk Corporation 46.1% 0.0% 159.7% 0.0%
2 2005 RFM Corporation &
Subsidiaries 47.0% 0.0% 172.8% 0.0%
3 2005 San Miguel Purefoods co.
Inc. & Subsidiaries 29.8% 0.0% 53.9% 0.0%
4 2005 Swift Foods Inc. 0.0% 0.0% 0.0% 0.0%
5 2005 Universal Robina Corp. &
Subsidiaries 63.5% 0.0% 172.9% 0.0%
6 2006 Alaska Milk Corporation 50.4% 0.0% 180.9% 0.0%
7 2006 RFM Corporation &
Subsidiaries 45.0% 0.0% 148.3% 0.0%
8 2006 San Miguel Purefoods co.
Inc. & Subsidiaries 25.2% 0.0% 69.8% 0.0%
9 2006 Swift Foods Inc. 0.0% 0.0% 0.0% 0.0%
10 2006 Universal Robina Corp. &
Subsidiaries 62.1% 0.0% 170.6% 0.0%
11 2007 Alaska Milk Corporation 44.8% 0.0% 183.6% 0.0%
12 2007 RFM Corporation &
Subsidiaries 37.5% 0.0% 137.2% 0.0%
13 2007 San Miguel Purefoods co.
Inc. & Subsidiaries 21.6% 0.0% 73.2% 0.0%
14 2007 Swift Foods Inc. 34.9% 0.0% 0.0% 36.8%
15 2007 Universal Robina Corp. &
Subsidiaries 62.6% 0.0% 189.0% 0.0%
The percentage input and output slacks versus the actual values are presented in Table 5. A slack value indicates the amount by which a DEA model constraint is not satisfied with equality and therefore, represents the amount by which an input is overusedrelative to how the most efficient company uses the input. In all instances operating expenses were used at an efficient level in all companies, whereas capital was far in excess (slack) of the requirements of the companies to achievean efficient level of operation. On average, capital was in excessby 38% (ranging from 21 to 64% versus the actual capital), relative to how efficient Swift Foods Inc. (efficient company) make use of its capital.
In the output however, gross profit are maximized at all instances except for Swift Foods Inc. in year 2007 due to increase in cost of goods sold brought by increase cost of raw materials. Significant revenue deficits relative to input used on the other hand are true for all companies except for San Miguel Purefoods Co. which has relatively short deficits in three consecutive years as compared to more than100% of the other companies. The company introduced several new products during these periods which resulted in increase in sales and compensate some
of the deficits.
To benchmark the efficient food and beverage manufacturing companies against non-efficient food and beverage manufacturing companies.
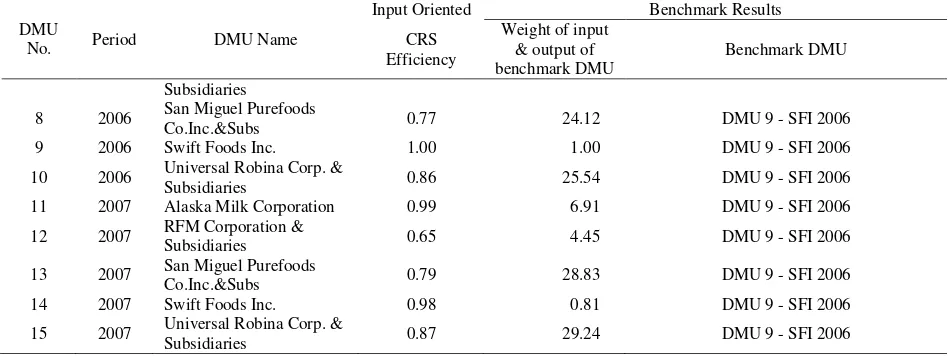
Table 6. Benchmark Results
DMU
No. Period DMU Name
Input Oriented Benchmark Results
CRS Efficiency
Weight of input & output of benchmark DMU
Benchmark DMU
1 2005 Alaska Milk Corporation 0.81 3.77 DMU 9 - SFI 2006
2 2005 RFM Corporation &
Subsidiaries 0.78 4.42 DMU 9 - SFI 2006
3 2005 San Miguel Purefoods
co.Inc.&Subs 0.78 20.81 DMU 9 - SFI 2006
4 2005 Swift Foods Inc. 1.00 1.00 DMU 4 - SFI 2005
5 2005 Universal Robina Corp. &
Subsidiaries 0.90 22.84 DMU 9 - SFI 2006
6 2006 Alaska Milk Corporation 0.90 4.46 DMU 9 - SFI 2006
Fanny Soewignyo – Performance Efficiency of Selected
119 DMU
No. Period DMU Name
Input Oriented Benchmark Results
CRS Efficiency
Weight of input & output of benchmark DMU
Benchmark DMU Subsidiaries
8 2006 San Miguel Purefoods
Co.Inc.&Subs 0.77 24.12 DMU 9 - SFI 2006
9 2006 Swift Foods Inc. 1.00 1.00 DMU 9 - SFI 2006
10 2006 Universal Robina Corp. &
Subsidiaries 0.86 25.54 DMU 9 - SFI 2006
11 2007 Alaska Milk Corporation 0.99 6.91 DMU 9 - SFI 2006
12 2007 RFM Corporation &
Subsidiaries 0.65 4.45 DMU 9 - SFI 2006
13 2007 San Miguel Purefoods
Co.Inc.&Subs 0.79 28.83 DMU 9 - SFI 2006
14 2007 Swift Foods Inc. 0.98 0.81 DMU 9 - SFI 2006
15 2007 Universal Robina Corp. &
Subsidiaries 0.87 29.24 DMU 9 - SFI 2006
Table 6 illustrates the efficient DMUs that can be used as benchmarking for non-efficient DMUs. As illustrates in this study, the DMUs that having efficiency scores, specifically are DMUs 4 and 9 were identified as the benchmarking companies. The remaining non-efficient DMUs were compared to the best performing DMUs. For instance, least efficient DMU (RFM 2007-DMU 12) with efficient score of 0.65 should use 2007-DMU 9 (Swift Foods Inc. – 2006) as benchmark and should decrease its use of input by 35% (i.e. 1-0.65) as a first step toward becoming DEA efficient. The table also exhibits the weights of inputs and outputs of the benchmark DMUs that should be adopted by other non-efficient DMUs to achieve the efficient frontier.
Taken as a whole, the benchmark results indicate that, majority part of the observation period, Swift Foods Inc. in year 2005 and 2006 serves as a good benchmarking company to follow for future performance improvement, by other Philippines food and beverage manufacturing companies used in this study.
CONCLUSIONS
Data envelopment analysis (DEA) is used to evaluate the technical efficiency of selected Philippines
food and beverage companies. The results generally indicate that too much capital use and high operating expenses in conjunction with low revenue or sales characterize inefficient operations. However even at high revenues but with relatively high cost of goods sold as in the case of Swift Foods Inc. can also result in low gross profits. When considering economic inputs and outputs, minimizing the use of capital is identified as one possible way for the companies to be efficient, aside from operating expenses. DEA also provides information regarding how inefficient companies can become efficient by slack analysis as well as benchmarking efficient companies’ input and output levels too.
The slack analyses suggest the amount of inputs to be reduced and the amount of outputs to be increased in order to improve the efficiency of non-efficient DMUs. Findings identified the presence of slacks among the Philippines food and beverage manufacturing companies. The result suggests that the companies with the presence of slack must evaluate especially those idle capital/equity, inefficient used of operating expenses and concentrate on increasing the total revenues/sales. Lastly, the DEA approach was able to determine the benchmarking company among other Philippines food and beverage
manufacturing companies.
REFERENCES
Ahmad, N. (2005). The design, development and analysis of a multi criteria decision support system model: Performance benchmarking of small to medium-sized manufacturing enterprise (SME). Rensselaer Polytechnic Institute, 186 pages; AAT 3173245
Bao, C-p., Chen, T-h. & Chang, S-y. (2008, June). Slack-based ranking method: an interpretation to the cross-efficiency method in DEA. The Journal of the Operational Research Society. Vol. 59, Iss. 6; pg. 860, 3 pgs
Cojuangco, E., (2008, September 15). Business News for the Food Industry. Retrieved, September 15, 2008, from http://www.flex-news food.com/console/PageViewer.aspx?page=17440&str=Philippines
Cooper, W. W, Seiford, L. M., & Tone, K. (2000). Data envelopment analysis: A comprehensive text with models, applications, references, and DEA-Solver software. USA: Kluwer Academic Publishers.
Deloitte. (2008). Food and Beverage 2012 A taste of things to come. Retrieved, September 15, 2008,fromhttp://www.deloitte.com/consumerbusiness
Ding, S. (2004). Integration of speed economics into decision technologies for manufacturing management. University of California, 133 pages; AAT 3146833
Dong, S. C. & Liang, K. L. (2005, January). Measuring the relative efficiency of a firm’s ability to achieve organization benefits after ISO certification. Total Quality Management & Business Excellence. Vol. 16. Iss. 1; pg. 57 Edirisinghe, N. C. P. & Zhang, X. (2008, June). Portfolio selection under DEA-based relative financial strength
indicators: case of US industries. The Journal of the Operational Research Society. Vol. 59, Iss. 6; pg. 842 Leachman, C., Pegels, C. C. & Seung, K. S. (2005). Manufacturing performance: evaluation and determinants.
Journal of Business and Economics (JBE), Desember 2008. Vol. 7 No. 2
Lee, Y. C., Hu, J. L. & Ko, J. F. (2008, March). The Effect of ISO Certification on Managerial Efficiency and Financial Performance: An Empirical Study of Manufacturing Firms. International Journal of Management. Vol. 25, Iss. 1; pg. 166
Liu, F. H. F, & Hao, H. P. (2008, May). Ranking of units on the DEA frontier with common weights. Computers & Operations Research. Vol. 35, Iss. 5; pg. 1624
Narasimhan, R., Talluri, S. & Das, A. (2004, February). Exploring flexibility and execution competencies of manufacturing firms. Journal of Operations Management. Vol. 22, Iss. 1; pg. 91
Petroni, A. & Bevilacqua, M. (2002). Identifying manufacturing flexibility best practices in small and medium enterprises. International Journal of Operations & Production Management. Vol. 22, Iss. 7/8; pg. 929, 19 pgs RFM Corporation. (2008, September 15). Business News for the Food Industry. Retrieved, September 15, 2008, from
http://www.flex-newsfood.com/console/PageViewer.aspx?page=18427&str=Philippines
RNCOS I ndustry Research Solutions. (2006, September). Food and beverages market: A global review (2006-2007). Retrieved, September 14, 2008 from http://www.rncos.com/Report/IM590.htm