Cyst and Tumor Lesion Segmentation
on Dental Panoramic Images
using Active Contour Models
Ingrid Nurtanio1, I Ketut Eddy Purnama2, Mochamad Hariadi2, and Mauridhi Hery Purnomo2
Abstract—Active contours, or snakes, are computer-generated curves that move within images to find object boundaries. They are often used in computer vision and image analysis to detect and locate objects, and to describe their shape. Thus active contour can be used for object segmentation, especially the lesion in medical images. This paper presents the application of active contour models (Snakes) for the segmentation of lesions in dental panoramic image. The aim is to assist the clinical expert in locating potentially cyst or tumor cases for further analysis (e.g. classification of cyst or tumor lesion). In order to apply the snake formulation, color images were converted into gray images. Then, with correct parameters, we can create a snake that is attracted to edges or termination. Initializing contour, choosing parameter value and number of iteration affect the behaviour of the snake in a particular way. Using Receiver Pperating Characteristic (ROC), an average accuracy rate of 99.67 % is obtained. Examples of Snake segmentation results of lesions are presented.
Keywords—active contour, segmentation, cyst and tumor lesion, panoramic image, receiver operating characteristic
Abstrak—Kontur aktif, atau snakes, adalah model yang digunakan untuk mencari batas objek dari citra dalam bentuk kurva yang mana kurva tersebut dihasilkan oleh komputer dan bergerak sepanjang batas batas objek pada citra. Model kontur aktif ini sering digunakan dalam visi komputer dan analisis citra untuk mendeteksi dan menemukan objek sesuai bentuknya. Dengan demikian kontur aktif dapat digunakan untuk segmentasi objek, khususnya lesi pada citra medis. Paper ini menyajikan penerapan model kontur aktif (snakes) untuk segmentasi lesi pada citra panoramik gigi. Tujuannya adalah untuk menuntun ahli klinis dalam menemukan lesi yang berpotensi kista atau tumor untuk analisis lebih lanjut (misalnya, klasifikasi antara kista dan tumor). Untuk menggunakan model snakes ini, citra berwarna diubah menjadi citra abu-abu. Dengan parameter yang sesuai, dapat dibuat model snakes yang tertarik ke tepi objek atau berhenti bergerak. Menginisialisasi kontur, penentuan nlai parameter dan banyaknya iterasi menentukan perilaku dari snake ini. Dengan menggunakan Receiver Operating Characteristic (ROC), diperoleh tingkat akurasi sebesar 99,67 %. Pada paper ini disertakan contoh hasil segmentasi dengan model snakes ini.
Kata Kunci—kontur aktif, segmentasi, lesi kista dan tumor, citra panoramik, ROC
I.INTRODUCTION6
he human jawbone is a site of a variety of disorders. Various type of cyst and tumor lesions have been clinically classified [1-4].
In particular, there exist lesions (e.g. malignant tumor lesion) that have a potential to develop into cancer. Detection of malignant tumor in its early stages considerably reduces morbidity and mortality. Early detection also saves hundreds of millions that otherwise would be spent on the treatment of advanced-diseases. In clinical practice the decision about further treatment of the patient is predominantly based on lesion appearance from the visual part of dental panoramic images. The segmentation is thus an important part of computer-aided lesion diagnosis systems [5]. It is of great interest for the medical community working with lesions to have an automatic (or semi-automatic) method for segmenting the lesions in images, since by doing that the next step of extracting the different features and the consequent
6 Ingrid Nurtanio is with Student Post of Doctoral Department of
Electrical Engineering, FTI, Institut Teknologi Sepuluh Nopember, Surabaya, 60111, Indonesia. E-mail: [email protected].
I Ketut Eddy, Mochamad Hariadi, and Mauridhi Hery Purnomo are with Department of Electrical Engineering, FTI, Institut Teknologi Sepuluh Nopember, Surabaya, 60111, Indonesia. Email: [email protected], [email protected], and [email protected].
classification (examining the potentiality of a malignant cancerous lesion) can be immediately performed and evaluated [6]. A previous study evaluated the classification of lesions based on features with the lesions being manually segmented by medical experts. The dentists usually agree on the position of the lesion boundaries in the recorded images. However, this is still a challenging problem of computer vision due to the variability of the shape and appearance of cyst and tumor lesions. On the other hand, the machine is usually more efficient, after supervised learning, than humans in differentiation of oral diseases.
The automatic segmentation algorithm will simplify the analysis of lesions and this later can be used in clinical practice to detect potentially cancerous lesions.
segmentation the lesion.
In this paper we propose the use of Snakes (active contour models) for semi-automatic detection of lesion boundaries in dental panoramic images. Snake provides a unified account of a number of visual problems, including detection of edges, lines, and subjective contours; motion tracking, and stereo matching. The development of active contour models, or snakes, results from the work of [8]. Active contour models, belong to the class of deformable models, have gained large acceptance as a segmentation tool. This is due to a collection of factors including the way Snakes consider the boundary as a single, inherently connected, and smooth structure. Snakes also support intuitive interactive mechanisms for guiding the segmentation deformations [9-12].
The goal of this paper is to demonstrate that the application of traditional snake model can also be used in digital dental panoramic image for segmentation of cyst or tumor lesion and using Receiver Operating Characteristics (ROC) analysis as a performance measure [13-15].
This paper is organized as follows : in section 2 we give the method of concepts and theorems concerning the snake models, receiver operating characteristic. In section 3, we show the experimental result about the techniques based on the snake models and validation from the radiologist. In section 4, we analysis the result from snake model using receiver operating characteristic. Section 5 contains the conclusions.
II.METHOD
In the method of the current research, The following materials are required :
A. Materials
We have considered a dataset of 24 dental panoramic images including various of cyst lesion (primordial cyst, radicular cyst, inflammation-induced paradental cyst, aneurismatic bone cyst, stafne cyst, calcifying odontogenic cyst, solitary bone cyst) and various of tumor (ameloblastoma, ameloblastic fibroma,
adenomatoid odontogenic tumor, odontoma,
cementoblastoma, fibrous dysplasia, central giant cell granuloma, ossifying fibroma, osteoblastoma, osteoma) [4].
B. Methods
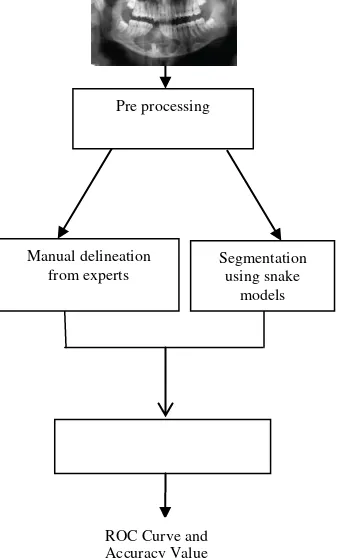
A segmentation method is usually designed taking into consideration the properties of a particular class of images. In this paper, we develop a three-step method using the properties of dental panoramic images as shown in Figure 2. The steps of our method are as follows :
1. Preprocessing : a color image is first transformed into a gray image by normalizing the values of its pixels with respect to the length of the gray scale. Using Gaussian filter to smooth the images. 2. Segmentation : using active contour model (snake)
and adjust the various snake parameters (relative weights of energy terms in the snake objective function). The snake would appear and move as it converges to its low energy state. Adjust parameter
, , wline, wedge, and wterm to find the best value and
can be used for all data sets.
3. Validation using Receiver Operating Characteristic (ROC) analysis as a performance measure. We compare the predicted result (from snake model) and the actual result (from expert) by calculating the true positive, true negative, false positive, and false negative pixels then calculate the true positive rate, false positive rate and accuracy. ROC graph is presented.
The active contour model is proposed by snake, a snake [8] is a parametric curve defined in the image domain which is initialized manually by a set of control points, lying on an open or closed curve.
0,1 control point, the energy is recalculated for all points in its neighborhood and the point that minimizes this energy function is used to update the control point. Once the update procedure settles, one is expected to detect a feature of interest (edge), which can be reconstructed by interpolation among the control points.The energy functional to be minimized is defined as :
where and are weighting parameters that control the
snak ’s t nsion and rigidity, r sp ctiv ly, and v' (s) and v'' (s) denote the first and second derivatives of v(s) with respect to s .
The second term in (2) is an external image energy. Typical forms of image energy are :
2 the intensity is a binary function (black and white, line-art image).
A snake that minimizes E must satisfy the Euler equation 0
which can be viewed as a force balance equation Fint + Fimage = 0 (7) The internal force Fint prevents stretching and bending, while the external force Fimage pull the snake toward the desired image edges.
To find a solution to (6), the snake is made dynamic by treating v as function of time t as well as s, v(s,t) . A solution is obtained by seeking the snake position for which the velocity, defined by
term range of snake behavior can be created.
Eline is line functional defined as : )
Eterm is termination functional defined as :
A Receiver Operating Oharacteristics (ROC) graph is a technique for visualizing, organizing and selecting classifiers based on their performance [13].
We begin by considering classification problems using only two classes. Formally, each instance I is mapped to one element of the set {p,n} of positive and negative class labels. A classification model (or classifier) is mapping from instances to predicted classes. Some classification models produce a continuous output (e.g., an stimat of an instanc ’s class m mb rship probability) to which different thresholds may be applied to predict class membership. Other models produce a discrete class label indicating only the predicted class of the instance. To distinguish between the actual class and the predicted class we use the labels {Y,N} for the class predictions produced by a model.
Given a classifier and an instance, there are four possible outcomes. If the instance is positive and it is classified as positive, it is counted as a true positive; if it is classified as negative, it is counted as a false negative. If the instance is negative and it is classified as negative, it is counted as a true negative; if it is classified as positive, it is counted as a false positive. Given a classifier and a set of instances (the test set), a two-by-two confusion matrix (also called a contingency table) can be constructed representing the dispositions of the set of instances. This matrix forms the basis for many common metrics.
Figure 3 shows a confusion matrix and equations of several common metrics that can be calculated from it. The numbers along the major diagonal represent the correct decisions made, and the numbers of this diagonal represent the errors—the confusion—between the various classes.
The true positive rate(also called hit rate and recall) of a classifier is estimated as
positives
The false positive rate (also called false alarm rate) of the classifier is
Additional terms associated with ROC curves are
Sensitivity = recall (15) ROC graphs are two-dimensional graphs in which tp rate is plotted on the Y axis and fp rate is plotted on the X axis. An ROC graph depicts relative tradeoffs between benefits (true positives) and costs (false positives). Figure 4 shows an ROC graph with five classifiers labeled A through E.
A discrete classifier is one whose output is only a class label. Each discrete classifier produces an (fp rate, tp rate) pair corresponding to a single point in ROC space. The classifiers in Figure 4 are all discrete classifiers.
Several points in ROC space are important to note. The lower left point (0,0) represents the strategy of never issuing a positive classification; such a classifier commits no false positive errors but also gains no true positives. The opposite strategy, of unconditionally issuing positive classifications, is represented by the upper right point (1, 1).
The point (0, 1) represents perfect classification. D’s performance is perfect as shown.
Informally, one point in ROC space is better than another if it is to the northwest (tp rate is higher, fp rate is lower, or both) of the first. Classifiers appearing on the left-hand side of an ROC graph, near the X axis, may b thought of as “cons rvativ ” : th y mak positiv classifications only with strong evidence so they make few false positive errors, but they often have low true positive rates as well. Classifiers on the upper right-hand sid of an OC graph may b thought of as ‘‘lib ral’’: they make positive classifications with weak evidence so they classify nearly all positives correctly, but they often have high false positive rates. In Figure 4, A is more conservative than B. Many real world domains are dominated by large numbers of negative instances, so performance in the far left-hand side of the ROC graph becomes more interesting.
III.RESULTS AND DISCUSSION
The methods based on snake-deformation model were used to handle Region of Interest (ROI), not the entire image. All the experiments were conducted in Matlab Ver 7.0 by using a PC Intel-Pentium Centrino with RAM 1 GB.
wedge = 1.00 and wterm = 2.00 are the best parameters and can be use for all data sets [16].
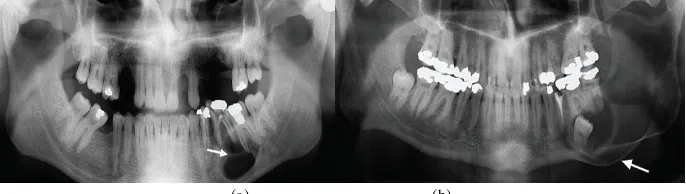
For brevity, in our tests we only give the results for two images belonging to such dataset : central giant cell granuloma and radicular cyst. Figure 6 and 7 shows the final result of the snake segmentation.
The position of initial contour and choose the parameter affects the result. If the initial contour is too far from the intended edge, the snake will slither away to another edge or line (see Figure 8). The same with the combining parameter (see Figure 9).
The expert manual tracings of the cyst and tumor lesion are shown in Figure 10 and 11.
To quantify the difference between the manually delineated boundary (from expert), and the snake-segmented boundary, we calculated the value of true positive, true negative, false positive, and false negative values and then calculated the value of accuracy, true positive rate and false positive rate. Figure 12 and 13 illustrates the calculation of the error term in equation (13) until equation (17). The true positive, true negative, false positive, false negative values in Figure 12 is the image No. 1 in Table 1, and in Figure 13 is the image No. 7 in Table 1. The accuracy value for our dataset with average value of 99.67 %. We presented the ten data of calculation in Table 1 and the ROC graph in Figure 14. Graph in Figure 14 shows cross point between tpr and fpr on the upper left side.
Image segmentation is the first step in many image analysis problems. To analyze cyst and tumor lesions, it is necessary to accurately locate and isolate the lesions. In this paper, an active contour model (snake) method for segmentation of dental panoramic images was presented. The position of initial contour, number of iteration and choose the parameter affects the result. We tried using different initial contour. If the initial contour is too far from the intended edge, the snake will slither away to another edge or line (see Figure 8). The same with the combining parameter. (see Figure 9).
However, it is important that a user assists in the segmentation procedure by pointing to a rough region in the image where the target lesion exists (done here by specifying a few initial snake nodes). The user should also be ready to intervene by placing constrained (forced) points to assist the snake if it clings to erroneous edges. To further improve segmentation, additional or enhanced energy terms and more human knowledge should be incorporated into the Snakes design.
To proved the snake model, we use ROC to measure the predicted result (from snake model) and the actual
result (from expert) by calculating the true positive, true negative, false positive, and false negative pixels then calculate the true positive rate (tpr), false positive rate (fpr) and accuracy (see Table 1). With the accuracy value of 99.67 % means error rate is 0.33 %. Graph in Figure 14 shows that cross point between tpr and fpr on the upper left side. This indicates perfect segmentation performance on this test set (tpr is higher, fpr is lower). With the result from graph on Figure 14 and accuracy value as 99.67 % show that segmentation with snake model can be used for cyst and tumor lesion on dental panoramic images (we have tested many types of objects from cyst and tumor lesion and they have the same shape characteristic).
The result from segmentation is region of interest for cyst and tumor lesion. The region of interest will be allocated for feature extraction. This step is to find a feature set of cyst and tumor lesions that can accurately distinguish cyst and tumor lesions. Based on the selected features, the suspicious regions will be classified. Further, our research will find texture feature obtained from ROIs used as inputs of classifier. Then, we can categorize the images into cyst/tumor classes. Lesion detection is necessary before lesion classification.
IV.CONCLUSIONS
We have applied snakes for semi-automatic segmentation of cyst and tumor lesion on dental panoramic images. The theory of active contour models (snakes) proved to be successful in application to image segmentation for cyst and tumor lesion on dental panoramic images. Snakes proved to be a valuable method for the segmentation of lesions by guaranteeing continuous and smooth lesion boundaries. Snakes reduced the need for edge linking compared to traditional edge based segmentation. However some operator interaction was still needed due to the large variability of the objects and images in this application. Initializing contour, choosing parameter value and number of iteration affect the behavior of the snake in a particular way. Changing the parameter value with the same initial contour or changing initial contour with the same parameter value will affect the behavior of the snake too. From ROC, the average accuracy value is 99.67%, show that segmentation with snake model can be used for cyst and tumor lesion on dental panoramic images.
(a) (b)
Figure 2. Stage of cyst and tumor lesion segmentation method Figure 3. Confusion matrix and common performance metrics calculated from it [13].
Figure 4. A basic ROC graph showing five discrete classifiers Figure 5. Initial position of the snake definition points and value of parameter setting
Figure 6. Final snake segmentation of central giant cell granuloma Figure 7. Final snake segmentation of radicular cyst
0 0.2 0.4 0.6 0.8 1
0 0.2 0.4 0.6 0.8 1
false positive rate
T
ru
e
p
o
s
it
iv
e
r
a
te
D
A
B
C
E
Hypothe-sized class
True Positives
(TP)
False Positives
(FP)
False Negatives
(FN)
True Negatives
(TN) p n
Y
N
N P
TN TP accuracy
P TP recall FP
TP TP precision
P TP rate tp N FP rate fp
True classValidation using ROC
Column totals : P N
ROC Curve and Accuracy Value Manual delineation
from experts
Segmentation using snake
Figure 8. Initial contour is too far from the intended edge Fig.9. Combining parameter with = 0.2, = 0.8
Figure 10. The manual expert delineation of radicular cyst Fig.11. The manual expert delineation of central giant cell granuloma
(a) (b) (c)
Fig.12. ROC calculation for radicular cyst : (a) ROI of snake-segmented, (b) ROI of manual delineation, and (c) accuracy = 0.9989
(99.89 %)
(a) (b) (c)
Fig.13. ROC calculation for central giant cell granuloma: (a) ROI of snake-segmented, (b) ROI of manual delineation, and (c) accuracy =
0.9926 (99.26 %)
Figure 14. ROC graph
0.0000 0.2000 0.4000 0.6000 0.8000 1.0000
0.0000 0.2000 0.4000 0.6000 0.8000 1.0000
False Positive Rate
T
ru
e
P
o
s
it
iv
e
R
a
TABLE 1.
VALUE OF TP,TN,FN,FP, FPR, TPR,SPECIFICITY,SENSITIVITY AND ACCURACY USING ROCMEASURE
Image TP TN FN FP fpr tpr specificity sensitivity accuracy
1 1056 163676 36 152 0.0009 0.9670 0.9991 0.9670 0.9989
2 9231 154455 437 707 0.0046 0.9548 0.9954 0.9548 0.9931
3 2574 178388 173 405 0.0023 0.9370 0.9977 0.9370 0.9968
4 5333 156429 197 312 0.0020 0.9644 0.9980 0.9644 0.9969
5 1997 163835 33 209 0.0013 0.9837 0.9987 0.9837 0.9985
6 10248 154705 93 761 0.0049 0.9910 0.9951 0.9910 0.9948
7 12699 164205 706 617 0.0037 0.9473 0.9963 0.9473 0.9926
8 703 163535 36 114 0.0007 0.9513 0.9993 0.9513 0.9991
9 748 164915 0 411 0.0025 1.0000 0.9975 1.0000 0.9975
10 796 162739 22 213 0.0013 0.9731 0.9987 0.9731 0.9986
REFERENCES
[1] T. Stavroula, T. J. Daphne, and S. J. Davis, Imaging characteristics of neoplasms and other lesions of the jawbones, Part 1, Odontogenic tumors and tumorlike lesions, Part 2, Odontogenic tumor-mimickers and tumor-like lesions, Clinical Imaging 31, 2007, pp. 114-126.
[2] T. J. Daphne, T. Stavroula, S.J. Davis, “Primary non-odontogenic tumors of the jawbones, An overview of essential radiographic findings,”Journal of Clinical Imaging, vol. 27, pp. 59-70, 2003. [3] W. C. Stuart and P. J. Michael, Oral Radiology, Mosby, 4th ed,
2000.
[4] F. A. Pasler and V. Heiko, Pocket atlas of dental radiology, Thieme, New York, 2007.
[5] H. D. Cheng, J. Shan, W. Ju, Y. Guo, and L. Zhang, Automated breast cancer detection and classification using ultrasound images : A survey,Pattern Recognition, vol, 43, 2010, pp. 299-317. [6] C. V. Angkoso, I. Nurtanio, I. K. E. Purnama, and M. H Purnomo,
“T tur analysis for cyst and tumor classification on dental panoramic images,” in Proceeding of the 12th Seminar on
Intelligent Technology and Its Applications (SITIA 2011), 2011, pp. 15-19.
[7] H. Ghassan, C. Artur, and G. Tomas, “Activ contour models: Application to oral lesion detection in color images,” presented at IEEE Conference on Systems, Man, and Cybernetics, 2000. [8] M. Kass, A. Witkin, and D. T rzopoulos, “Snak : Active Contour
Models,”International Journal of Computer Vision, vol. 1, no.4, pp. 321-331, 1987.
[9] S. T. Acton and R. Nilanjan, Biomedical Image Analysis: Tracking, Morgan & Claypool Publishers, 2005, pp. 5-43. [10] T. F. Chan and L.A .V s ., “Activ contours without edges,”IEEE
Transactions on Image Processing, vol. 10, no. 2, 2001, pp. 266-277.
[11] W. Min, Z. Yongjin, and W. Mingxi , “A fast snak mod l bas d on non-lin ar diffusion for m dical imag s gm ntation”,
Computerized Medical Imaging and Graphics, vol. 28, pp 109-117, 2004.
[12] M . Airouche, L . Bentabet, and M. Zelmat, “Imag S gm ntation using active contour model and level set method applied to detect oil spills,” in Proceeding of the World Congress on Engineering, vol. 1, WCE 2009, London U.K., 1-3 July, 2009.
[13] T. Fawcett, “An introduction to ROC analysis,” Pattern Recognition Letters, vol. 27, 2006, pp. 861-874.
[14] A. P. Dhawan, H. K. Huang, and K. Dae-Shik, Principles and advanced methods in medical imaging and image analysis, World Scientific Publishing Co., Pte., Ltd., Singapore, 2008, pp. 24-28.
[15] T. A. Lasko, J. G. Bhagwat, K.H. Zou, and L.O. Machado, “Th use of receiver operating characteristic curves in biomedical informatics,”Journal of Biomedical Informatics, vol. 38, pp. 404-415, 2005.
[16] I. Nurtanio, I. K. E., Purnama, M.H. Purnomo, and M. Hariadi, “A snake model for dental panoramic image segmentation”,