Vol. 7, No. 2, July 2013 ISSN 0216 – 0544
99
LUNG FIELD SEGMENTATION ON COMPUTED TOMOGRAPHY
IMAGE USING ACTIVE SHAPE MODEL
a
Sri Widodo, bWijiyanto a
Medical Record and Health Informatics Academic of Citra Medika Surakarta Samanhudi, Surakarta
a
Sekolah Tinggi Manajemen Informatika dan Komputer Duta Bangsa Surakarta Indonesia
E-mail: [email protected]
Abstrak
Metode saat ini yang banyak digunakan untuk segmentasi bidang paru dari citra CT scan adalah thresholding dan Active Contour, yang mengandalkan kontras dari nilai keabuan antara parenkim paru dan jaringan sekitarnya. Kelemahan dari kedua metode tersebut adalah jika nodul tersebut besar dan terletak pada batas tepi paru, maka nodul tersebut tidak akan masuk dalam citra paru (bagian paru yang terdapat kelainan atau nodul akan hilang). Hal ini berarti proses segmentasi bidang paru dianggap gagal, karena citra nodul yang menjadi pokok perhatian akan hilang. Tujuan dari penelitian adalah segmentasi bidang paru yang mengandung kelainan pada citra CT scan dengan menggunakan Active Shape
Model. Kontribusi dalam penelitian ini adalah jenis baru dari Active Shape Model dengan
variasi tingkat keabuan dari dua batas objek, yaitu, bidang paru kanan dan kiri. Pada penelitian ini, kami mempertimbangkan struktur gambar lokal, yaitu momen dari histogram lokal yang berasal dari pengurangan antara citra asli dengan citra hasil negasi. Kami juga melakukan segmentasi bidang paru dengan thresholding dan Active Contour, sebagai bahan perbandingan dengan metode yang diusulkan. Hasil dari penelitian kami menunjukkan bahwa pendekatan segmentasi dengan Active Shape Model mempunyai akurasi 94.6%, sensitifitas 90.2%, dan spesifisitas 95.9%.
Kata kunci: Active Shape Model, Active Contour, Thresholding.
Abstract
Current method is widely used for lung field segmentation of CT scan image is Thresholding and Active Contour, which relies on contrast of gray values between lung parenchyma and surrounding tissues. Drawback of both methods is that if nodule is large and located on borders of lung, then nodules will not be included in the image of lung (nodules contained will be lost). This means that segmentation of lung field was considered a failure, because image of nodule is object of attention will be lost. Purpose of this research is lung field segmentation that contain abnormalities in CT scan image using Active Shape Model. Contribution in this paper is a new type of Active Shape Model with gray level variation of two object boundaries, namely right lung field and left lung field. In this study, we consider the local image structure, which moments of a local histogram derived from the subtraction of the original image with the negation image. We also perform lung fields segmentation using thresholding and Active Contour, as a comparison with method we proposed. Results of our study show that segmentation with ASM approach has accuracy 94.6%, sensitivity 90.2%, and specificity of 95.9%.
INTRODUCTION
Lung nodules are one type of abnormality in lung organ. They can also be possibility of lung cancer, while lung cancer is all of malignancies disease in lung. Malignancy can be derived from lung itself (primary) or spread (metastasis) of tumors from other organs [1]. Computed Tomography (CT) is considered the most accurate modality available for early detection and diagnosis of pulmonary nodules and cancer.
Studies have been conducted [2-10], automatic detection of lung nodules composed of two step, namely lung nodule candidate detection and classification to determine nodule. Detection of nodule candidates begins with lung field segmentation. Current method is widely used for lung field segmentation of CT image is thresholding and Active Contour. Both methods are equally rely on large contrast between gray values of lung parenchyma and surrounding tissues.
Drawbacks of both methods is that if nodule is large and located on the edge of boundary lungs, causing lung borders are not clear, so if done segmentation, nodule will Active Shape Model used in this study is the ASM of Cootes et al. [11]. ASM uses a statistical model for the shape appearance and consists of landmarks defining the outline of the object. The model uses some images in training set where the correct landmarks of the object have been defined. After aligning the shape by Procrustes algorithm, the shape variations are described using Linear Principle Component Analysis (PCA). The PCA analysis results in a model including a statistical model of both edge profiles and shape [12, 13].
To find the object using ASM the mean shape is placed on the approximate correct position in an unseen image. The algorithm tries to fit the mean shape to the object edges in the unseen image by finding the best fit within the edge profile of each landmark and
then moves the landmark to the best fit of the edge. This procedure is repeated for each landmark and finally a new shape is generated. Since this new shape may not look like the correct shape, each model parameter is limited to less than 3 times of the standard deviations of that parameter resulting from the shape variations in the training set. This iterative process is stopped after a predefined number of iterations or it is repeated till reaching neglectable changes of the shape in two successive. To test the accuracy of the segmentation method with ASM, then the results will be compared with the manual segmentation of ground truth.
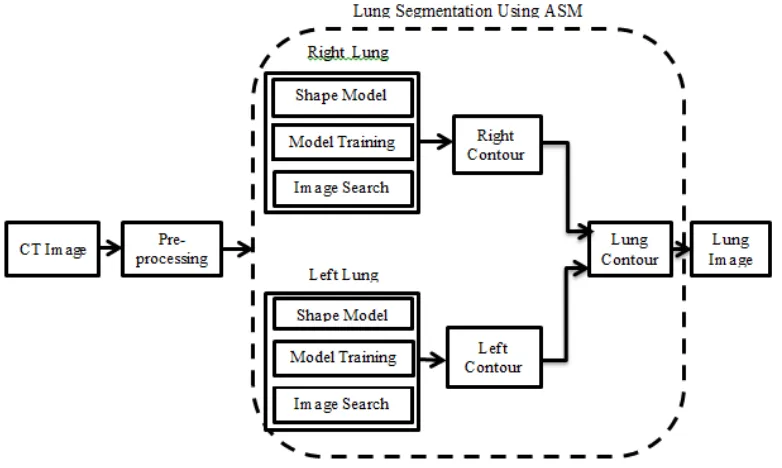
LUNG FIELD SEGMENTATION
segmentation of the left and right lung fields use ASM, each of which consists of three phases, namely:1. Shape Model.
The first step in ASM is to form the model using the landmarks positions of the images in the training set. There are three steps (see Figure 1) to build the shape model which are:
a. Procrustes analysis.
Procrustes analysis is a form of statistical shape analysis used to analyze a collection of shapes. In this case, the shapes are equalized by removing the translational, rotational and scaling components [14].
b. Shape Alignment.
to the mean shape and continue this procedure till the mean shape does not
change in two consequent
iterations[14].
c. Principle Component Analysist (PCA). PCA is a linear orthogonal transformation transmitting data set to a new coordinate system as the first greatest variance in data is assigned to the first dimension. The principal components are the eigenvectors of the covariance matrix [14].
2. Model Training.
This section explains how to find the gray level information of each landmark using the images in the training set. It is generally possible to consider all areas around the landmark but traditional ASM only considers a line crossing the landmark [14].
3. Image Search.
In this stage, an initial estimation of the shape is manually applied to an unseen image. The initial shape should hit the object edges in the unseen image and at the same time be reasonably short. Then ASM uses the edge profile and the covariance matrix of the mean normalized derivatives generated in the last stage to find the best movement.
A result of lung segmentation is left and right lung contour. The next step is adding
the contour of the left and right, which will generate the contour of the lung. Lung image that separated from the surrounding tissue is done by multiplying the original image with the contour of pulmonary. Multiplication of image can be done by multiplying each pixel with a certain value can be modeled mathematically using the Equation (2) and Equation (3)
Th
y
x
f
y
x
Nf
y
x
f
(
,
);
(
,
)
(
,
)
*
(2)255 ) , ( then 255 ) , ( f ); ,
(
f x y i Nf x y Nf x y (3)
With Th
1, F(x,y) is the original image,Nf (x, y) is Result of multiplication between
original image intensity with value of contour image.
To calculate accuracy, sensitivity and specificity of lung field segmentation is done by adding image segmentation results using ASM with groundtruth segmentation results are converted into data types unsigned integer (uint8). Furthermore detected pixels are grouped into 4 groups: TP (true positive), TN (true negative), FP (false positive) and FN (false negative). TP is a lung pixel detected correctly. TN is lung pixels identified incorrectly. FP is not lung pixels were identified as lung pixels, while FN is not detectable lung pixels.
To test performance of proposed segmentation method is calculating accuracy, sensitivity and specificity. Accuracy indicates performance of proposed method. Sensitivity indicates lung pixels are detected correctly. Equation of accuracy, sensitivity and specificity shown in Equation (4), Equation (5), and Equation (6).
TN threshold can be explained as follows:
Edge Detection
Edge detection is process of detecting significant changes in gray level of an image. Changes in level of intensity are measured by a gradient image. For example, an image f(x, y) is a function of two-dimensional, then gradient vector of x and y respectively, the first derivative with respect to x and y can be written in form of Equation (7) [15]. two-dimensional image, gradient approximated using Equation (8).
calculated using multiple equation models, one of equations can be seen in Equation
Edge detection is used in this study are: edge detection with convolution prewit method. Prewit measure used is 3x3 with horizontal elements of middle to Gx is equal to 0 and vertical elements in the middle for Gy is also equal to 0, as shown in Equation (12) and will be converted into one.
Dilation
Dilatation function is adding pixels on each edge of a binary object that is an area that has a value of 1 where dilatation of adding 8 pixels which are interconnected to surrounding objects.
Dilation is a process of incorporation of background points (0) become part of object (1). Using of dilation is to place pivot point S at point A. Give the number 1 for all points (x,y) are exposed to or affected by the structure of S at that position. Dilation equation is shown in Equation (14).
Filling Image Areas
To fill the image area used an algorithm based on morphological reconstruction. Image area is an area of dark pixels surrounded by lighter pixels. If location of the image is determined, the next operation is to fill location using the 4-connected background neighbors for image input 2-D and 6-connected background neighbors for 3-D input. The output of this process is the area surrounded by a light-colored pixels will have value one.
Erosion
Erosion function is to remove 8 pixels of binary object associated with edges of object. Erosion is removal of object point (1) as part of background (0). Process of erosion is put pivot point S at point A. If any part of S
which are beyond pivot point A, then it is removed or used as background. Erosion is shown in Equation (15).
E(A,S)=AxS (15)
Multiplication
Image of multiplication is performed to obtain final image of lung. Final lung is defined as a lung image that separated from surrounding tissue. Multiplication of image can be done by multiplying each pixel with a certain value. It can be modeled mathematically using the Equation (2) and Equation (3) above. With Th 1, F(x,y) is the original image, Nf (x,y) is result of multiplication between original image intensity with value of Th. In our study process of multiplication is multiplication of lung mask image segmentation results with lung CT images was done histogram equalization process.
SEGMENTATION USING ACTIVE
CONTOUR
Steps of segmentation with active contour can be described as follows:
a. Perform early initialization of active contour as seen in Equation (16).
x
,
y
:
x
,
y
0
(
x
,
y
)
C
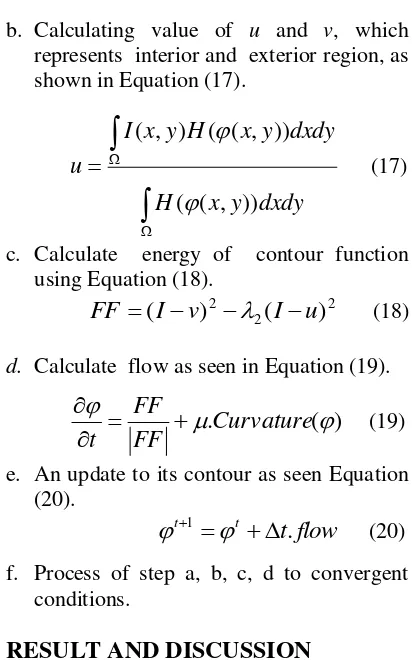
(16)b. Calculating value of u and v, which represents interior and exterior region, as shown in Equation (17).
d. Calculate flowas seen in Equation (19).
.
Curvature
(
)
e. An update to its contour as seen Equation(20). Bethesda Hospital Yogyakarta. Orientation of axial slices with 10-24 slice of the patient is taken, so the total slices used in the experiments amounted to 100 slices, using a jpg format. The image size of 505x427 pixels and a thickness of 0.5-10 mm. Manually segmentation is done by marking the area of the lung using a paint program by groundthruth. Groundtruths is pulmonary physician from Bethesda Hospital of Yogyakarta and dr. Moewardi hospital of Surakarta.
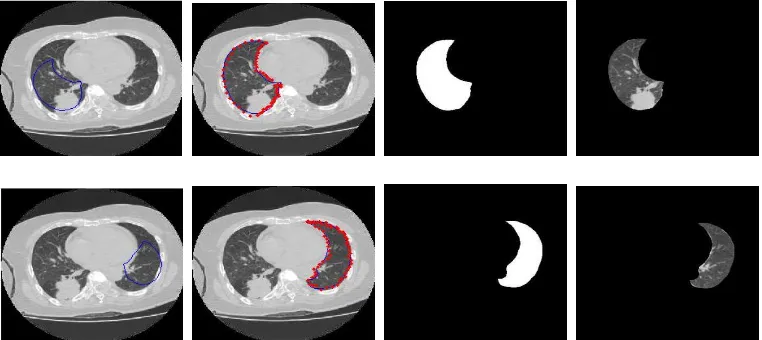
The first experiment is lung CT scan image segmentation on a wedge into the 29th with a great shape abnormality as seen in Figure 2 and Figure 2.
Figure 2. ASM Segmentation Process. Upper:From Left to Right is Right Lung Segmentation, Bottom: From Left to Right is Left Lung Segmentation
(a)
(b)Figure 3. (a) The contours of the Lungs, (b). Lung Image Final.
(a) (b) (c) (d)
Figure 4. Lung Segmentation Results In Great Shape abnormalities. (a). Manual segmentation Results By Groundthruth, (b). With Thresholding Segmentation, (c). The results of the Active Contour Segmentation, (d) Segmentation with ASM.
(a) (b)
Figure 6. (a) The contours of the Lungs, (b). Lung Image Finall
Table 1. Calculation of Accuracy With Large Abnormalities Shape
Segmentation Methods
Accura cy (%)
Sensitivity (%)
Specifici ty (%)
Threshold 90.2 88.8 90.5 Active Contour 92.4 89.9 92.9
ASM 94.1 93.5 94.2
It shows that the failure of segmentation by ASM has higher accuracy compared with the thresholding and active contour method. The results of the calculation accuracy of the methods used are shown in Table 1.
Further experiments are lung CT image segmentation failed to do by ASM. The results are shown in Figure 5 and Figure 6.
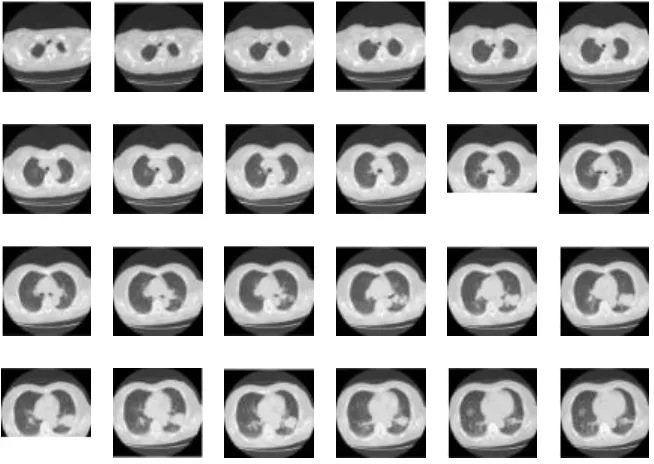
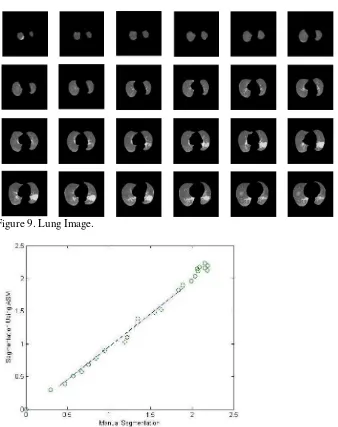
To test the accuracy of the ASM method, we also examined the CT images of patients consisted of 24 slices respectively, as shown in Figure 7, the counter segmentation is shown in Figure 8, and the lung image is shown in Figure 9.
To determine the ratio between manual segmentation and segmentation method using active shape models is done by identifying the edges of the lung boundary pixel by pixel. The inside of the curve (which is the boundary of the lungs image) is filled with intensity value 1.
Then calculate the value histogram. The results of the ratio of the lung contours in a sequence of 24 slices can be shown in Figure 10. By using the least squares method, obtained linear regression by y = 2.2902 x - 2.8923.
We also did a 3-D reconstruction of lung images above. Results of the 3-D reconstruction can be seen in figure 11.
Figure 8. The Contours of the Segmentation Results with ASM
Figure 9. Lung Image.
Manual Segmentation.
Figure 11. Visualization of 3-D image of Lung
The final experiment is a segmentation of 20 CT scans of 20 patients. ASM method has high accuracy compared to two other methods, namely threshold and the active contour. This shows the ASM segmentation method is suitable for segmentation of lung containing abnormalities. The results of the comparison of the three methods used are listed in Table 2.
CONCLUSION
Conclusion from above experiments is that segmentation by thresholding and active contour methods fail to segment lung CT images containing disease (abnormalities). This is due in pulmonary with large nodules size have lung borders are not clear (low contrast value). Segmentation by active shape model can be identified region of lung CT with large abnormalities form.
Table 2. Segmentation Results Using three Methods With All Data
Segmentation Methods
Accu racy
Sensiti vity
Specificity
Threshold 92.2 91.3 92.4 Active Contour 92.4 87.5 93.7
ASM 94.6 90.2 95.9
Segmentation by thresholding can run well on lung CT scan image that have small diseases shape or in lung that had no disease (normal lung).
Our research successfully segmenting diseased lung (abnormal), which can not be done by conventional methods, but process still requires intervention of user (process of manually initialization in abnormal lung CT image). Therefore, this method can be improved towards automation, so user intervention can be reduced.
REFERENCES
[1] A. Yusuf , A. Harryanto, E. Syahruddin, S. Endardjo, S. Mudjiantoro, and N. Sutandio, “Type of Lung Cancer Non-Small cell Carcinoma”, National guidelines for
diagnosis and management in
Indonesia, 2005.
[2] D. Cascio, S. C. Cheran, A. Chincarini, and G. De Nunzio, “Automated Detection of Lung Nodules in Low-dos Computed Tomography,” International
Journal of Computer assisted Radiology
and Surgery, vol. 2, no. 1, pp. 357-359,
2007.
[3] H. C. Roberts, A. Walsham, E. Colak, H. Kashani, C. Mongiardi, and D.Patsios, “The Utility of Computer-aided-detection for the Assessment of Pulmonary Arterial Filling detects at CT Angiography,” International Journal of
Computer assisted Radiology and
[4] I. Gori, “A Multi-Scale Approach to Lung Nodule detection in Computed Tomography,” International Journal of
Computer assisted Radiology and
Surgery, vol 2, no. 1, pp.333-335, 2007.
[5] M. Dolej and J. Kybic, “The Lung TIME Annotated Lung Nodule Dataset and Nodule Detection Framework,” Faculty of Electrical Engineering, Czech Technical University in Prague, Czech Republic.
[6] T. Hara, X. Zhou, S. Okura, H. Fujita, T. Kiryu, and H. Hoshi, “Nodule
Detection Methods Using
autocorrelation Feature on 3D chest CT Scans,” International Journal of
Computer assisted Radiology and
Surgery, vol 2, no. 1, pp. 361-362, 2007.
[7] T.Kobota, A. Jerebko, M. Salganicoff, and A. Krishnan, “A Segmentation Algorithm With Competition-diffusion and Distance Transform For Automated Estimated of Pulmonary Nodule Diameter,” International Journal of
Computer assisted Radiology and
Surgery, vol 2, no. 1, pp. 364-366, 2007.
[8] L. Borosky, M. C. Lee, L. Zhao, L. Agnihotri, and C. A. Powell,
“Computer-aidec Diagnosis for Lung cancer Using a Classifier Ensemble,”
International Journal of Computer
assisted Radiology and Surgery, vol 2,
no. 1, pp. 362-364, 2007.
[9] S. Matsumoto, Y. Ohno, and H. Yamagata, International Journal of
Computer assisted Radiology and
Surgery, vol 2, no. 1, pp. 359-360, 2007.
[10] Y. Nomura, H. Itoh, E. Maeda, and Y. Masutani, International Journal of
Computer assisted Radiology and
Surgery, vol 2, no. 1, pp. 355-357, 2007.
[11] T. F. Cootes, C. J. Taylor, D. H. Cooper,
and J.Graham, “Active Shape Models-
their Training and Application”,
Computer Vision and Image
Understanding, vol. 61, no.1, pp. 38-59,
1995.
[12] S. Klim, S. Mortensen, B. Bodvarsson, L. Hyldstrup, and H. H. Thodberg , "More Active Shape Model ", Technical Report, Informatics and Mathematical
Modeling, Technical University of
Denmark, 2002.
[13] G. Hamarneh, R. Abu-Gharibeh, and T.Gustavsson, "Active Shape Models-Part I: Modeling Shape and Gray Level Variations", in Proceedings of the
Swedish Symposium on Image Analysis,
1998.
[14] N. B. Rizvandi, A.Pizurica, and
W.Philips, “Deformable Shape
Description Using Active Shape
Model”, Department of
Telecommunications and Information Processing (TELIN), Ghent University, Sint-Pietersnieuwstraat 41, B-9000 Gent, Belgium, 2007.
[15] S. Mark, A. Nixon, and A. S. Aguado,
Feature Extraction And Image
Processing, Second Edition, Jordan Hill