Corresponding author: Sri Idaiani
E mail: [email protected] ; [email protected]
Sri Idaiani
National Institute of Health Research and Development, Ministry of Health, Indonesia
Riset Kesehatan Dasar 2007 (Riskesdas 2007) dirancang untuk menyediakan data berbasis bukti untuk perencanaan kebijakan kesehatan. Salah satu data yang dikumpulkan adalah gangguan mental emosional atau distres psikologik. Tujuan penelitian ini mengidentifikasi faktor yang berperan terhadap gangguan mental emosional pada penduduk di Jawa Tengah.
Data merupakan sebagian data Riskesdas 2007 yang dikumpulkan oleh pewawancara yang terlatih melalui survei nasional yang terintegrasi dengan Susenas 2007. Kami melakukan analisis terhadap 62.549 subjek yang berasal dari penduduk Jawa Tengah. Gangguan mental emosional dinilai dengan Self Reporting Questionnaire yang terdiri dari 2 pertanyaan diberikan pada subyek berumur ≥ 15 tahun. Nilai batas pisah kuesioner 5/6, artinya apabila responden menjawab”ya” minimal 6 pertanyaan, mereka diindikasikan mengalami gangguan mental emosional. Pengolahan data menggunakan program statistik STATA versi 10.
Usia tua (65 tahun atau lebih) dibandingkan usia muda memiliki risiko 63% mengalami gangguan mental emosional [risiko relatif suaian (RRa) = 1,63; 95% interval kepercayaan (CI) = 1,52<1,75]. Perempuan dibandingkan laki<laki mempunyai risiko 43% lebih tinggi (RRa = 1.43; 95% CI = 1,35<1,51) mengalami gangguan mental emosional.
Usia tua dan perempuan mempunyai risiko lebih tinggi mengalami gangguan mental emosional Oleh karena itu program kesehatan jiwa harus lebih ditujukan kepada kelompok usia lanjut. (
! " #$
: gangguan mental emosional, usia tua, riskesdas 2007
Baseline Health Research 2007 (Riset Kesehatan Dasar 2007 or Riskesdas 2007) was planned to provide evidence based data for health policy. One of the information collected was on mental emotional disorders or psychological distress. The objective of this study was to identify dominant factors related to mental emotional disorder.
. Data were obtained from the Riskesdas 2007. We analyzed 62,549 subjects from Central Jawa. Mental
emotional disorders were assessed by a Self Reporting Questionnaire which consisted of 20 questions given to subjects aged ≥ 15 years. Questionnaire cut off point was 5/6 which meant that if the respondent answered “yes” to at least 6 questions indicated a mental emotional disorder. Interviews were conducted by skilled interviewers. Data were processed by STATA 10 version.
Compared to the young, the elderly had a 63% risk to mental emotional disorders [adjusted relative risk (RRa) = 1.63; 95% confidence interval (CI) =1.52 1.75]. Women had 43% risk to mental emotional disorders compared to men (RRa =1.43; 95% CI = 1.35 1.51).
The elderly and women were more at risk to mental emotional disorders. Therefore, mental health
programs should be more addressed to elderly. ( ! " #$
Community Mental Health Survey which can represent Indonesian society is still very limited, especially large scaled national survey. The data obtained such a survey is important to evaluate the community and also for planning any program, since a good health program should be based on evidence found in the population.
Based on Riskesdas 2007, the prevalence of
mental emotional disorder among Indonesian
aged more than 15 years was 11.6%.1 Mental
emotional disorder is symptoms people
suffering it is being have mental problems. This condition can continue to be serious mental disorder if it was not managed.
In 2000 Indonesia implemented de
centralization, which resulted in an expansion of provinces as well as regions/municipalities. Until 2005 it has been administratively noted that there were 33 provinces consisting of 349 regions and 91 municipalities. Based on Law no 32 year 2004, which declared that in the decentralization era, program planning will be implemented at the regional/municipal level. Hence all provinces, even regions and
municipalities, required an area based data.2
Central Java as one of the provinces in Java is located between two large provinces: West Java and East Java. Its location is 5˚40’ and 8˚30’ South Latitude and between 108˚30’ and
111˚30’ East Longitude (including the
Karimunjawa Island). The farthest distance from West to East is 263 km and from North to South 226 km (excluding Karimunjawa Island). Administratively, the Central Java Province is divided into 29 regions and 6 municipalities. Area coverage of Central Java in 2006 was 3.25 million hectares or approximately 25.04% of the area of the Island of Java (1.70% of the entire
Indonesian area).3
Based on the National Economic and Social
Survey (Susenas) in 2006, the population of
Central Java was 3218 million or around 14% of the Indonesian population. This puts Central Java as the third most densely populated area in Indonesia after West Java and East Java. The population of women is larger than men and this is indicated by the sex ratio (the ratio of male
inhabitants against female inhabitants) of 99 574.4
The population of Central Java is not equally distributed within the entire area of Central Java. In general, the population is concentrated in municipalities compared to regions. On average the population density in Central Java is 989 per square kilometer, and the most densely populated area is Surakarta City with a density level of approximately 12 thousand persons per
square kilometer.3,4 The number of households
decreased from 8.64 million in 2005 to 8.43 million in 2006 or 2.37%. However, the average population per household has not changed. In 2006 the average population per household in
Central Java was 3.8 persons.4 Based on age
group, this province have 27% from 0 14 years, 65.2% from 15 64 years and 7.8% from 65 and
more years.2
The objective of this study was to identify dominant factors related to mental emotional disorders.
!"
The population of this study was inhabitants of Central Java. They were from selected households in selected census blocks. This analysis made use of the data provided by the
data center of Riskesdas 2007. There were
62,549 subjects. Riskesdas 2007 was a survey
designed to describe the health issues of inhabitants throughout Indonesia compre hensively, accurately and oriented towards the interest of policy makers at the provincial and
regional/municipal level.1
The population for Riskesdas 2007 was the
entire members of a household or individuals throughout Indonesia. Source population was household members from chosen households in the census blocks. Household samples and
household members in Riskesdas 2007 were
identical to the list of household samples and household members in Susenas 2007. Hence, it can be said that the calculation methodology
and sampling method for Riskesdas 2007 is
identical to the two stage sampling implemented
Corresponding author: Sri Idaiani
E mail: [email protected] ; [email protected]
Of each region/municipality included in the sample frame, a number of census blocks were taken proportionally to the number of
region/municipality in the respective
region/municipality. The possibility of a census block being included into a census block sample of a region/municipality was in proportion to the number of households in a region/municipal. If in a census block there were 150 (one
Riskesdas was conducted simultaneously from July till December 2007. An inclusion criterion was member of a household included in a chosen household of a chosen census block at Susenas 2007. Respondents whose mental health was assessed must at least be 15 years
old and willing to participate in the research. 1
We used trained interviewers to collect the data using the questionnaire. The questionnaire
consisted of several questions included
respondents background. Assessment of mental health was conducted by means of an interview
by a trained interviewer using the Self Reporting
Questionnaire (SRQ) consisting of 20 questions. Although basically this interview should be self administered, in a situation where many of the inhabitants were illiterate, an interview
administered process is permitted.5,6 A
respondent was indicated as suffering from a disorder if the total ”yes” answers exceeds the set cutting off point. In research in various countries, the SRQ cutting off point ranges between 3 to 10.5,6,7 In Riskesdas it is set at 5/6 as cutting off point meaning that respondents answering ”yes” to 6 or more questions will be considered suffering from emotional mental disorder or distress which was potential for a mental disorder if further examined by a psychiatrist.6
Cutting off point 5/6 was set according to the validity test research implemented by Iwan Gani Hartono, researcher at the National Institute of Health Research and Development
of the Ministry of Health in 1955.8 In his
research, SRQ sensitivity was 88% and
specificity 81%, positive predictive value 60% and negative predictive value was 92%. This validity test procedure is mandatory to obtain the cutting off point and to produce a good
questionnaire in various settings.9,10 The cutting
off point varies from one research to another, depending on sample taking methods, language used, and research objective.6 In this survey, SRQ used is purely 20 questions. SRQ 20 consists of questions focusing more on neurosis experienced during the last 30 days
We divided sociodemographic characteristics into 3 subgroups (15 34, 35 64, and 65 97 years). Education was based on the last diploma obtained by the respondent and same level schools are grouped together. In job divisions, subgroups were employee as civil servant, retired, Army/Police employees, and other employees. Self employed were merchants or owners of business. Level of expenditure per capita originally was divided into 5 levels or 5 quintile, with quintile 5 as the highest quintile and the lowest or poorest quintile is 1. In this study, higher was grouped quintile 3, 4 and 5, and lower was quintile 1 and 2).
Editing was implemented by each regional technical supervisor. After editing, data cleaning and data merging with Susenas data was completed, data analysis was done.
Data analysis used the STATA 10. Data processing was undertaken after the data was clean. Bivariat analysis was used to assess association between categorical variables. After bivariat analysis, we continued to analyze using multivariate analysis. We calculated the relative risk to assess the relationship between the determinants and mental emotional disorder.
This survey was conducted with approval by the Ethics Committee at National Institute of Health Research and Development Ministry of Health.
"#$ "
response rate of 97.3%. Out of 62,549 subjects, 55,467 (88.7%) did not have mental emotional disorders and 7,082 (11.3%) have mental emotional disorders. The ratio between those with mental emotional disorders and those without mental emotional disorder was 1:8.
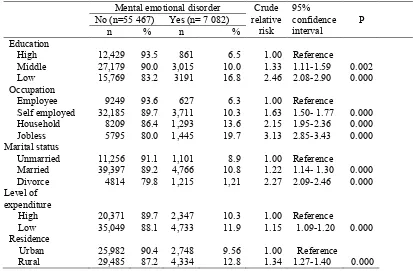
Subjects with old age, low education, jobless, divorce, low level expenditure, and rural residence were more likely to have mental emotional disorder compared to the reference group.
Table 1. Some sociodemographic characteristics and the risk of mental emotional disorder
Mental emotional disorder Crude
relative risk
95% confidence interval
P
No (n=55 467) Yes (n= 7 082)
n % n %
Education
High 12,429 93.5 861 6.5 1.00 Reference
Middle 27,179 90.0 3,015 10.0 1.33 1.11 1.59 0.002
Low 15,769 83.2 3191 16.8 2.46 2.08 2.90 0.000
Occupation
Employee 9249 93.6 627 6.3 1.00 Reference
Self employed 32,185 89.7 3,711 10.3 1.63 1.50 1.77 0.000
Household 8209 86.4 1,293 13.6 2.15 1.95 2.36 0.000
Jobless 5795 80.0 1,445 19.7 3.13 2.85 3.43 0.000
Marital status
Unmarried 11,256 91.1 1,101 8.9 1.00 Reference
Married 39,397 89.2 4,766 10.8 1.22 1.14 1.30 0.000
Divorce 4814 79.8 1,215 1,21 2.27 2.09 2.46 0.000
Level of expenditure
High 20,371 89.7 2,347 10.3 1.00 Reference
Low 35,049 88.1 4,733 11.9 1.15 1.09 1.20 0.000
Residence Urban
Rural
25,982 29,485
90.4 87.2
2,748 4,334
9.56 12.8
1.00 1.34
Reference
1.27 1.40 0.000
Table 2 revealed two dominant factors for the risk of mental emotional disorder, age and gender. The older subjects had more risk to be mental emotional disorder compared to subjects aged 15 34 years. Those aged 35 64 and ≥65
years had 33% and 63% increased risk to be
mental emotional respectively. Women
increased the risk of mental emotional disorder 43%.
Table 2. The relationship between age, gender and risk mental emotional disorder
Mental emotional disorder Adjusted
relative risk*
95% CI P
No (n=55,467) Yes (n=7,082)
n % n %
Age (years)
15 34 22,202 90.7 2,280 9.3 1.00
35 64 27,667 89.1 3,382 10.9 1.33 1.07 1.20 0.000
65 97 5,598 79.8 1,420 20.2 1.63 1.52 1.75 0.000
Gender
Male 27,074 91.3 4,881 8.7 1.00
Female 28,393 86.2 5,119 13.7 1.43 1.35 1.51 0.000
Corresponding author: Sri Idaiani
E mail: [email protected] ; [email protected] !&" #""& '
Based on the results of Riskesdas 2007, the
prevalence of mental emotional disorder or psychological distress in Central Java was 11.3%. The prevalence of mental emotional disorder in Central Java was approximately the same as the prevalence of mental emotional
disorder at national level which is 11.6%.1,12 In
a quite similar survey in Brazil, the prevalence of psychological distress or mental emotional disorder was 22.7% but in relation to stressful
were conducted towards population and used SRQ as one of its measuring instrument. The difference prevalence was probably caused of different situation, characteristics and cut off points. Vietnam and Brazil surveys used 8, whereas Al Ain in Pakistan as well as Ethiopia used 6 as a cut off.14, 16
disorder increased from employee, self
employed, household to jobless. Elderly (aged ≥ 65 years) with no job were more at risk than the young.
In this survey, a simple SRQ was used. Although this instrument is very simple, it has been proven to be quite a cost effective tool because it is easy to use and hence suitable for developing countries with illiterate population and does not require a lot of funding.5 Other surveys, such as the mental health survey in Iraq also uses SRQ as a research measuring
instrument with the addition of other
questionnaires which is more able to disclose a more specific diagnosis such as Composite
International Diagnostic Interview (CIDI).18
This method is better at disclosing the society’s
mental health status although not all
respondents given the SRQ questions will also
be interviewed with other more specific
instruments such as CIDI.17
Another article revealed that age contributes the strongest association to mental emotional disorder.12. That results were slightly different with this study, in this study the strongest association was an insufficiency of job (jobless), while another strong association was
low education. In the final model,
socioeconomic and marital status did not appear, while in previous study these factors were measured.
In conclusion, elderly and women were more at risk to mental emotional disorders. For future development of mental health surveys, it would be better if diagnosis given by an SRQ interview can be followed up by an interview using a more specific instrument by taking an existing sub sample and can, thus, be more cost effective like Iraq mental health survey.
The limitations of this study were not including other variables contributing to mental health, such as social support, personality, life events stressors, physical morbidity, etc. The cross sectional approach did not reveal the real relationship between variables and mental emotional.
The author wishes to thank all subjects who willingly participated in this study. The author would also like to express her sincerest gratitude for Professor Bastaman Basuki for technical assistance of this article(
) ' "
1. Departemen Kesehatan Republik Indonesia.
Laporan Riskesdas 2007. Jakarta: Depkes RI; 2008. Indonesian.
2. Departemen Kesehatan Republik Indonesia.
Profil kesehatan 2007. Jakarta: Depkes RI; 2007. Indonesian.
3. Pemprov Jateng. Jawa Tengah.
[Internet].Semarang: [update 2009; cited 2010
April 10]. Available from:
http://www.jatengprov.go.id/
5. Harpham T, Reichenheim M, Oser R, Thomas E, Hamid N, Jaswal S, et al. Measuring health in cost effective manner. Health Policy and Planning [Internet].2003[cited 2020 Nov 30]; 18(3): 344. Available from: http://www.ncbi.
nlm.nih.gov/pubmed/12917276
6. WHO. A user’s guide to the self reporting questionnaire. Geneva: WHO; 1994.
7. Al Subaie AS, Mohammed K, Al Malik T. The
Arabic self reporting questionnaire as a psychiatric screening instrument in medical patients. Ann Saudi Med [Internet]. 1998 [cited 2010 Nov 30]; 18(4):308 10. Available from: http://www.kfshrc.edu.sa/annals/Old/184/97 360.pdf
8. Hartono IG. Psychiatric morbidity among
patients attending the Bangetayu community health centre in Indonesia [tesis]. Perth: University of Western Australia; 1995.
9. Bowling A. Measuring disease, 2nd edition.
Philadelphia: Open University Press; 2001. 10. Mc Dowell I. Measuring health: A guide to
rating scales and questionnaire, 3rd edition. New York: Oxford University Press; 2006.
11. Desjarlais R, Eisenberg L, Good B, Kleinman A. World mental health. New York: Oxford University Press; 1995.
12. Idaiani S, Suhardi, Kristanto AY. Analisis gejala
gangguan mental emosional penduduk
Indonesia. MKI. 2009; 59:10474 9. Indonesian. 13. Lima MS, Beria JU, Tomasi E, Conceicao AT,
Mari JJ. Stressful life events and minor
psychiatric disorders: an estimate of the population attributable fraction in a Brazilian communitybased study. Int J Psychiatry Med [Internet]. 1996; 26:211 22. Available from:
http://baywood.metapress.com/app/home/contri bution.asp?referrer=parent&backto=issue,7,8;jo urnal,58,157;linkingpublicationresults,1:300314, 1
14. Saleh MTA, Ghubash R, Daradkeh TK. Al Ain community psychiatric survey I prevalence and sociodemographic correlates. Soc Psychiatry Psychiatr. Epidemiol [Internet]. 2001 [cited 2009 Jul 11]; 36: 20 28. Available from: http://www.springerlink.com/content/2bcl6cf4y d61lb7w/fulltext.pdf
15. Tuan T, Harpham T, Huong NT. Validity and reliability of the self reporting questionnaire 20 items in Vietnam.Hongkong J Psychiatry [Internet].2004 [cited 2010 Dec 10]; 14(3):15
8.Available from:
http://hkjpsych.com/journal_file/0403_v14n3_1 5 18_Validity.pdf
16. Kedebe D, Alem A,Rashid. The prevalence and socio demographic correlates of mental distress in Addis Ababa, Ethiopia [Internet]. 1999 [cited
2010 Dec 5]. Available from:
http://onlinelibrary.wiley.com/doi/10.1111/j.160 0 0447.1999.tb10687.x/ abstract
17. Ludermir AB, Lewis G. Investigating the effect of demographic and socioeconomic variables on misclassification by the SRQ 20 compared with
a psychiatric interview. Soc psychiatry.
Psychiatr epidemiol [Internet]. 2005 [cited 2010 Dec 5]. 40: 36–41. doi: 10.1007/s00127 005 0840 2