IJNMT, Vol. V, No. 1 | June 2018 8
ISSN 2355-0082
Data Visualization of Poverty Level at
Provinces in Indonesia from
The year 2013-2015
Stevencua
1, Johan Setiawan
2Department of Information Systems Universitas Multimedia Nusantara, Tangerang, Indonesia
1[email protected] 2[email protected]
Received on August 30th, 2017
Accepted on June 8th, 2018
Abstract—The aim of this paper is to create a data visualization that can convey information on poverty distribution of every province in Indonesia and to find a connection with education level. The method used is Eight-step data visualization and data mining methodology. Data for this research are taken from BPS from the year 2013 to 2015. Data collected after the data extracted and cleansing is 6000 records. Time needed to convert data from several publications and put it into one Excel file is 2 weeks. Tableau is chosen as tools for creating the Data Visualization. With this tools, data showed in a story dashboard which consists of 3 dashboards. The first dashboard is a mapping of poverty data onto provinces of Indonesia. The second dashboard is a mapping and distribution of education levels on cities and counties in Indonesia. The third dashboard is showing a ranking of areas with the highest percentage level of a citizen of education lower than elementary school in Indonesia. Based on the User Acceptance Test to BPS staff, authors have been able to produce the Story required, and interactive. As a conclusion from Data Visualization has been made, high poverty in certain areas not immediately is directly proportional to the level of education.
Index Terms— Dashboard, Data Visualization,
poverty, Tableau.
I. INTRODUCTION
According to the BPS report on 2017, Indonesia is a country that has a land area of 1.913.579 square kilometers which consists of 17.504 islands. Albeit the size that it has, equity in Indonesia has not been going on well. An article from 2017 by Directorate-General of Disadvantage Area Development mentioned that developments have always been focused on Java Island. It is one of the causes of poverty in other parts of the country.
One of the main focus of Indonesia government in this term (2014-2019) is to minimize the gap between regions in every part of the country. According to Minister of Finance Sri Mulyani Indrawati, this can be done by developing infrastructures in underdeveloped
regions or regions that have a high level of poverty on record.
The problem with this large country, the government needs more time to decide which region should become their priority for development. A decentralized governing system Indonesia uses means coordination between central government and regional government is needed in the form of information regarding poverty level or social economic conditions of each region.
With the advanced technology we have right now, it is easy to get such information because the data are open to everyone, such as data from www.data.go.id and www.bps.go.id. Unfortunately, data for the public from BPS is in the publication format (PDF), not in another format such as spreadsheet or text format.
By having open data, information should be easier to obtain and faster to be used to solve poverty problems. Nevertheless, these data are still in the format of publications, in numbers and could only become a meaningful information if managed properly. One of the techniques that can be used in order to convey information better is in the form of data visualization.
To make information regarding these poverty data easier to understand by ordinary people, authors want to create a data visualization that can display poverty data and its relationship with the education level of each province in Indonesia. It aimed to help parties that need a mapping of poverty distribution in Indonesia.
Data used for the visualization are obtained from www.bps.go.id and ranged from the year 2013 to 2015.
The formulation of the problems are as followed:
9 IJNMT, Vol. V, No. 1 | June 2018
ISSN 2355-0082
How to build a data visualization dashboard that can be used to analyze poverty of all provinces in Indonesia.
II. LITERATURE REVIEW
A. Data Visualization
Data visualization is a technique to transform data or information into visual matter. [1] Usage of data visualization could make data or information that we have become clearer in order to be communicated to others [2].
The goal of data visualization is to get insight from graphics or images interactively, into many aspects that related to some processes that we are interested in. [3].
B. Dashboard
The dashboard is a visual display of important information that is needed to reach a goal, arranged on a single screen so the information can be seen at a glance [4].
C. Database
The database is a collection of related data. The database is designed, developed and filled with data for a specific purpose for a specific group of users [5].
The database is a computer structure that is divided and integrated which stores collection of data from end-user that consists of raw facts and metadata (data of data), where the end-user data are integrated and arranged [6].
D. Data Warehouse
Data Warehouse is a collection of subject-oriented, integrated, always changing, and non-volatile data. The purpose of a data warehouse is to integrate big-sized corporate data into a storage where the user can easily run the query, produce reports, and analyze [7].
As [7] said, some of the benefits of using data warehouse are as follows:
High return on investment
Competitive advantages
Increasing productivity from decision makers
E. Data Mining
Data mining is a process of gathering valid and understandable information from a big database and using it for taking crucial business decisions [7].
F. Data Cleaning
Data cleaning, known also as data cleansing or data scrubbing, is a process of detecting and cleaning errors and inconsistency from data in order to increase
the quality of data that are going to be stored in database or data warehouse [8].
G. Extract, Transform, Load (ETL)
Perta Extract, transform, and load (ETL) process is an essential process in data warehouse development.
As told by the name, this process is divided into three phases, as follows according to [9]:
1. Extract. In this phase, data were extracted from various sources. This phase is quite a challenging aspect because accuracy in extracting data is needed. The goal of this phase is to get data from various sources in order to be combined into a single format that can be used for data transformation.
2. Transform. In this phase, the transformation of data from the original format into a format that can be used for the data warehouse is commenced. There are many ways to do so, such as:
a. Taking some columns from data
b. Interpret encoded values
c. Encode independent data
d. Calculate new values
e. Sorting
f. Combining data from multiple sources
g. Divide columns into more new columns
h. Aggregation
i. Validation of simple or complex data
3. Load. Loading data to final storage (usually a data warehouse). Data can be loaded with various ways such as bulk loading using DBMS software or sequential loading by inserting data each row at a time. Bulk loading is usually recommended because loading data sequentially takes longer time in the process of parsing the statement that is inserted in the query..
H. Poverty Gap Index (P1)
IJNMT, Vol. V, No. 1 | June 2018 10
ISSN 2355-0082
I. Poverty Severity Index (P2)
Poverty Severity Index gives illustration regarding the distribution of expenditure among poor residents. The higher the index, the level of inequality of the poor residents’ expenditure is higher [10].
J. Poverty Line
The poverty line is a sum of Food Poverty Line and Non-Food Poverty Line. Residents that have expenditure per capita per month lower than the poverty line are categorized as poor residents.
The Food Poverty Line is a value of minimum food expenditure which is equal to 2100 kilocalories per capita per day.
The Non-Food Poverty Line is a minimum requirement for housing, clothes, education, and healthcare [10].
III. RESEARCH METHODOLOGY
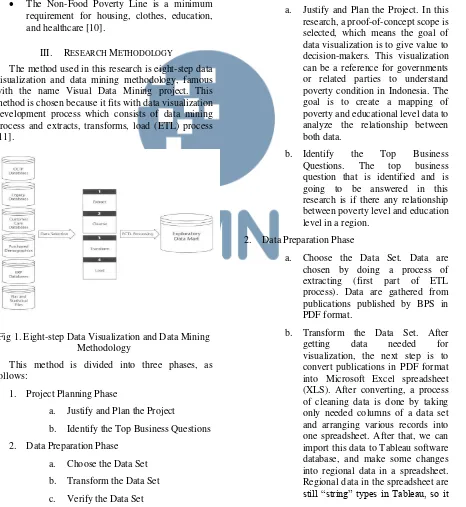
The method used in this research is eight-step data visualization and data mining methodology, famous with the name Visual Data Mining project. This method is chosen because it fits with data visualization development process which consists of data mining process and extracts, transforms, load (ETL) process [11].
Fig 1. Eight-step Data Visualization and Data Mining Methodology
This method is divided into three phases, as follows:
1. Project Planning Phase
a. Justify and Plan the Project
b. Identify the Top Business Questions
2. Data Preparation Phase
a. Choose the Data Set
b. Transform the Data Set
c. Verify the Data Set
3. Data Analysis Phase
a. Choose the Visualization or Mining Tool
b. Analyze the Visualization or Mining Model
c. Verify and Present the Visualization or Mining Model
IV. RESULTS
This section consists of results in every phase which are conducted using the eight-step data visualization and data mining methodology.
1. Project Planning Phase
a. Justify and Plan the Project. In this research, a proof-of-concept scope is selected, which means the goal of data visualization is to give value to decision-makers. This visualization can be a reference for governments or related parties to understand poverty condition in Indonesia. The goal is to create a mapping of poverty and educational level data to analyze the relationship between both data.
b. Identify the Top Business Questions. The top business question that is identified and is going to be answered in this research is if there any relationship between poverty level and education level in a region.
2. Data Preparation Phase
a. Choose the Data Set. Data are chosen by doing a process of extracting (first part of ETL process). Data are gathered from publications published by BPS in PDF format.
b. Transform the Data Set. After
getting data needed for
11 IJNMT, Vol. V, No. 1 | June 2018
ISSN 2355-0082
needed to be changed into the geographic role in Tableau software.
c. Verify the Data Set. This activity is to make sure the data set is already well transformed and can be used for visualization. Verification of errors is done here. One of the errors found is where there are record mistakes when a region in 2015 publications don’t exist in 2013 and 2014 publications. The solution is to add those missing regions into the 2013 and 2014 data and move cities accordingly as the latest data. There are also some missing regional data that are not detected in Tableau software during the transformation
process of regional data
geographical role. In order to fill this unknown data, we have to input regional coordinates (longitude and latitude). To find the coordinates, a supplementary tool is used from the website www.mapcoordinates.net/en which uses Google Maps as base map.
3. Data Analysis Phase
a. Choosing the visualization or data mining tool. The tool used to create a data visualization is Tableau visualization software. The reason of using Tableau is because it has some advantages against another tool like Microsoft PowerBI, as summarized in Table 1.
Table 1. Comparison of Tools
Comparisons Tableau Power BI
Visualization Data
Limits Unlimited 3500 data
Calculations Built-in
Calculations Syntax Compare Several
Categories Yes No
Customize Pop-Up
Content Yes No
Offline Iterations Yes No
Story from Multiple
Dashboards Yes No
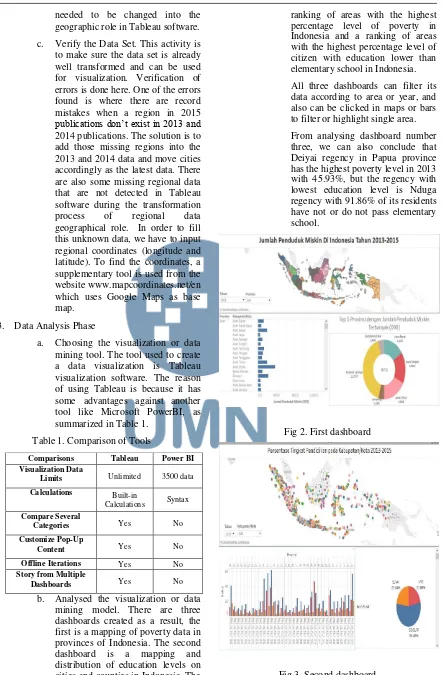
b. Analysed the visualization or data mining model. There are three dashboards created as a result, the first is a mapping of poverty data in provinces of Indonesia. The second dashboard is a mapping and distribution of education levels on cities and counties in Indonesia. The third dashboard is showing a
ranking of areas with the highest percentage level of poverty in Indonesia and a ranking of areas with the highest percentage level of citizen with education lower than elementary school in Indonesia.
All three dashboards can filter its data according to area or year, and also can be clicked in maps or bars to filter or highlight single area.
From analysing dashboard number three, we can also conclude that Deiyai regency in Papua province has the highest poverty level in 2013 with 45.93%, but the regency with lowest education level is Nduga regency with 91.86% of its residents have not or do not pass elementary school.
Fig 2. First dashboard
IJNMT, Vol. V, No. 1 | June 2018 12
ISSN 2355-0082
Another finding is the Southwest Maluku regency, ranked 24 in highest poverty, is actually ranked 481 out of 511 regencies and cities in Indonesia in low education, which means it has a high education with a rate of not passing elementary school of 7.42%. Although the percentage of each area is of course not the same (considering the number of residents in each area is different and the 100% of the level is not the same).
From this finding, we can see that education level can influence poverty level in some areas but not directly influence it, there are so many other factors that we can put into the equation such as a number of residents, infrastructure conditions that influence goods and services access to the certain area.
Fig 4. Third dashboard
c. Verifying and presenting the visualization or mining model. After the visualization is created, a final verification process is conducted to make sure the visualization has already represented the true value of the data. The verification is done by taking samples of some data in the visualization and match them with the raw data from the publications. A story dashboard is created in order to accommodate the three dashboards in one functional display. User acceptance test is also conducted by reviewing the visualization to a staff of BPS. The visualization has been uploaded to
Tableau Public website and can be seen online.
V. CONCLUSION
The data visualization created can display poverty and educational data interactively using data set that was transformed into Microsoft Excel spreadsheet, from numerical and statistical publications of BPS which were PDF documents before. Data visualization is done using Tableau software to create maps, bars, pie charts, which then combined into a story dashboard consists of three dashboards that show poverty data, education level, and ranking of regions per category.
Data visualization also give information that education level is one of the factors that influence poverty level in certain regions, however, it doesn’t have a direct influence. Factors such as a number of residents’ difference in each region, infrastructure that helps goods and services’ access that influence economy also must be taken into the equation when analyzing factors and cause of poverty in certain regions.
Data visualization that has been created can be used as a reference for research and development to anyone that needed it in order to raise the welfare of residents from the underdeveloped regions.
ACKNOWLEDGEMENT
The author thanks, Mr. Johan Setiawan as a supervisor that has been guiding from the beginning.
REFERENCES
[1] Murray, S. (2013). Interactive Data Visualization for The Web: An Introduction to Designing with, Part 3. O'Reilly Media, Inc.
[2] Few, S., & EDGE, P. (2007). Data Visualization: Past, Present, Future. IBM Cognos Innovation Center. Retrieved from Perceptual Edge.
[3] Telea, A. C. (2014). Data Visualization: Principles and Practice, Second Edition. CRC Press.
[4] Few, S. (2013). Information Dashboard Design: Displaying Data for at-a-glance monitoring. Analytics Press.
[5] Elmasri, R., & Navathe, S. B. (2007). Fundamentals of Database Systems. Boston: Pearson/Addison Weasley. [6] Rob, P., & Coronel, C. (2009). Database Systems: Design,
Implementation, and Management. Boston: Course Technology, Cengage Learning.
[7] Connolly, T. M., & Begg, C. E. (2010). Database Systems: A Practical Approach to Design, Implementation, and Management (Fifth Edition). Boston: Pearson Education, Inc. [8] Li, J. (2014). Data Cleaning. In F. M. Hammond, J. F. Malec,
T. G. Nick, & R. M. Buschbacher, Handbook for Clinical Research (p. 101). Demos Medical Publishing.
[9] Ali, F. S. (2014). International Scientific Journal of Management Information Systems. A Survey of Real-Time Data Warehouse and ETL.
[10] Badan Pusat Statistik. (2017). Badan Pusat Statistik. Retrieved from Badan Pusat Statistik: https://www.bps.go.id/ [11] Soukup, T., & Davidson, I. (2002). Visual Data Mining.