BRAND LOYALTY: A CASE OF THE CRUISE
INDUSTRY
Xiang (Robert) Li James F. Petrick
ABSTRACT. This study revisits the dimensional structure of the brand loyalty construct. Following recent developments in loyalty studies, this research conceptualizes brand loyalty as a four-dimensional construct comprising of cognitive, affective, conative, and behavioral loyalty. It is proposed that the first three dimensions collectively form a higher order factor—namely attitudinal loyalty—which then leads to behavioral loyalty. However, this conceptualization is not supported by the data. Alternatively, a modified model—based on the traditional conceptualization that attitudinal loyalty is a first-order, one-dimensional construct—was found to better fit the data. Thus, this study revalidates the traditional two-dimensional conceptualization of loyalty. It also contributes to the literature by introducing and validating a five-item attitudinal loyalty measure.
KEYWORDS. Attitudinal loyalty, cognitive loyalty, affective loyalty, conative loyalty, behavioral loyalty, brand loyalty
The recent increase in brand loyalty research seems to have echoed the emer-gence of the relationship marketing para-digm (Morais, Dorsch, & Backman, 2005), which emphasizes the importance of estab-lishing relationships between customers and businesses (Gronroos, 1994; Sheth & Parvatlyar, 1995). Nevertheless, brand loy-alty research has been consistently criti-cized for lacking theoretical grounding and conceptual depth (Dimanche & Havitz, 1994; Iwasaki & Havitz, 2004; Jacoby & Chestnut, 1978; Oliver, 1999; Pritchard, Havitz, & Howard, 1999). It is particularly disquieting that no consensus has been
reached on what loyalty is. That is, what components should be included when con-ceptualizing or measuring customers’ brand loyalty, and where to draw the line between loyalty and its antecedents or outcomes. Moreover, the vast majority of previous loyalty studies have focused on consumer goods, while the advent of the ‘‘service economy’’ (Gummersson, 2002) or ‘‘experience economy’’ (Pine & Gilmore, 1999) has called for more research on services. Therefore, this study seeks to systematically examine the conceptual domain and structure of brand loyalty in a tourism service context.
Journal of Travel & Tourism Marketing, Vol. 25(1) 2008 Available online at http://jttm.haworthpress.com #2008 by The Haworth Press. All rights reserved.
68 doi: 10.1080/10548400802164913
Xiang (Robert) Li is Assistant Professor, School of Hotel, Restaurant, and Tourism Management, University of South Carolina, Columbia, SC 29208, USA (E-mail: [email protected]). James F. Petrick is Associate Professor, Department of Recreation, Park and Tourism Science, Texas A&M University, College Station, TX 77843, USA. (E-mail: [email protected]).
One sector in need of retaining loyal customers is the cruise industry, which is traditionally characterized by a high level of repurchase (i.e., behavioral loyalty) (Petrick, 2004). To continue the current market balance and to block potential competitors from entry, major cruise companies have been investing heavily on cruise capacity expansion (Lois, Wang, Wall, & Ruxton, 2004). This growth in berths has made it imperative for the industry—among other things—to retain its current clientele, and improve repurchase rate, to maintain present occupancy rates (Miller & Grazer, 2003). Thus, it seems that research focusing on customer loyalty may provide operational significance to the cruise industry.
This paper seeks a better understanding of the structure of cruisers’ brand loyalty. Specifically, the study will examine the dimensionality of loyalty, and identify mea-sures of loyalty from a multidimensional perspective. Theoretical significance aside, exploring the structure of loyalty may provide guidance to the measurement and management of loyalty.
LITERATURE REVIEW
Traditional View
The loyalty construct has been a central research topic among marketing scholars (Rundle-Thiele, 2005). Until recently, the conceptualization of loyalty has been adopted from three major approaches (Jacoby & Chestnut, 1978; Morais, 2000; Rundle-Thiele, 2005). It has been suggested that loyalty may refer to customers’ beha-vioral consistency, attitudinal predisposition toward purchasing a brand, or both.
Behavioral Loyalty
The majority of early loyalty studies took a behavioral approach, and interpreted loyalty as synonymous with repeat purchase. This was grounded on a stochastic view of consumer behavior (Rundle-Thiele, 2005),
which proposes that consumer behavior, as well as market structure, are characterized by randomness rather than rationality (Bass, 1974). Tucker (1964, p. 32) went so far as to assert that ‘‘no consideration should be given what the subject thinks or what goes on in his central nervous system; his behavior is the full statement of what brand loyalty is.’’ More recently, Ehrenberg (1988) contended that researchers should understand how people make brand purchases, before under-standing why people buy. Finally, from a measurement perspective, O’Mally (1998, p. 49) suggests that behavioral measures of loyalty provide ‘‘a more realistic picture of how well the brand is doing vis-a`-vis competitors...’’
A major criticism of the behavioral loyalty approach is that it fails to distinguish customers making purchase decisions because of genuine brand preference, from those who purchase solely for convenience or cost reasons (Back, 2001). In other words, underlying customers’ repeat brand purchase may be inertia (i.e., repeat brand purchases for the sake of saving time and energy; Assael, 2004), rather than the customer-brand bond (Fournier, 1998). Furthermore, due to inconsistency between behavioral measures, one customer classified as a loyal client based on Method A, may be classified as disloyal by Method B (Morais, 2000). Thus, several researchers have argued that the loyalty phenomenon cannot be ade-quately understood without measuring indi-viduals’ attitude toward a brand (Backman & Crompton, 1991; Day, 1969; Dick & Basu, 1994).
Attitudinal Loyalty
The stochastic philosophy essentially maintains that marketers are unable to influence buyer behavior in a systematic manner. In contrast, the deterministic philo-sophy suggests that behaviors do not just happen, they can be ‘‘a direct consequence of marketers’ programs and their resulting impact on the attitudes and perceptions held by the customer’’ (Rundle-Thiele, 2005,
p. 38). Researchers holding a deterministic view hence advocate the need to understand the loyalty phenomenon from an attitudinal perspective.
Guest (1944) was arguably the first researcher to propose the idea of measuring loyalty as an attitude. He used a single preference question asking participants to select the brand they liked the best, among a group of brand names. A number of researchers followed his approach, and con-ceptualized loyalty as attitudes, preferences, or arguably purchase intentions—all of which can be considered as a function of psychological processes (Jacoby & Chestnut, 1978). Terms such as cognitive loyalty (Jarvis & Wilcox, 1976) and intentional loyalty (Jain, Pinson, & Malhotra, 1987) subse-quently emerged to capture different compo-nents of the psychological processes. More recently, Reichheld (2003) argued that loy-alty may be assessed using only one vari-able—‘‘willingness to recommend’’ (which is otherwise considered as an attitudinal loy-alty outcome).
A major criticism of the attitudinal loyalty approach is that it lacks power in predicting actual purchase behavior, even though a recent meta-analysis on attitude-behavior studies (Kraus, 1995) reported that attitudes significantly predict future behavior (Rundle-Thiele, 2005). It has been found that using attitudinal loyalty alone may not capture the entirety of the loyalty phenom-enon (Morais, 2000). Meanwhile, some authors have suggested that the limited explanatory power of attitudinal loyalty could be the result of intervening influences from other factors constraining purchase behaviors (Backman & Crompton, 1991).
Composite Loyalty
The foregoing review implies that neither the behavioral nor attitudinal loyalty approach alone provides a satisfactory answer to the question ‘‘what is loyalty?.’’ Day (1969) argued that genuine loyalty is consistent purchase behavior rooted in positive attitudes toward the brand. His
two-dimensional conceptualization of loy-alty suggested a simultaneous consideration of attitudinal loyalty and behavioral loyalty, which profoundly influenced the direction of loyalty research (Jacoby & Chestnut, 1978; Knox & Walker, 2001).
A number of researchers have operatio-nalized loyalty using a composite approach (Backman & Crompton, 1991; Dick & Basu, 1994; Morais, Dorsch, & Backman, 2004; Petrick, 2004; Pritchard et al., 1999; Selin, Howard, Udd, & Cable, 1988; Shoemaker & Lewis, 1999). For instance, Dick and Basu conceptualized loyalty as the relationship between relative attitude (attitudinal dimen-sion) and repeat patronage (behavioral dimension). They maintained that true brand loyalty only exists when consumer beliefs, affect, and intention all point to a focal preference toward the brand or service provider. In leisure literature, Backman and Crompton (1991) conceptualized psycholo-gical attachment and behavioral consistency as two dimensions of loyalty. Their findings revealed that ‘‘attitudinal, behavioral, and composite loyalty capture the loyalty phe-nomenon differently’’ (p. 217). To date, although some researchers still conceptualize loyalty as a unidimensional construct, the vast majority of researchers have adopted the composite loyalty approach.
Recent Conceptual Development
behaviors or attitudes when designing loy-alty programs’’ (Jones & Taylor, 2007, p. 36). Many new conceptualizations of loyalty are somewhat influenced by Oliver’s work (Oliver, 1997, 1999). Oliver followed the same cognition-affect-conation structure as Dick and Basu (1994), but suggested that loyalty formation is more likely to be an attitudinal development process, and that customers may demonstrate different levels of loyalty in different stages of this process. Thus, Oliver implied that loyalty is neither a dichotomy (loyalty vs. no loyalty), nor multicategory typology (e.g., low, spurious, latent, and high loyalty), but a continuum. Specifically, Oliver (1997, 1999) posited that the loyalty-building process starts from some cognitive beliefs (cognitive loyalty), followed by affective loyalty (i.e., ‘‘I buy it because I like it’’), to conative loyalty (i.e., ‘‘I’m committed to buying it’’), and finally action loyalty (i.e., actual ‘‘action inertia’’). Although the temporal sequence of loyalty formation remains controversial (Rundle-Thiele, 2005), a number of researchers have adopted Oliver’s four-dimensional loyalty conceptualization (Back, 2001; Harris & Goode, 2004; Jones & Taylor, 2007; Lee, 2003; McMullan & Gilmore, 2003).
For instance, Harris and Goode (2004) operationalized and tested Oliver’s 4-facet measure in two online service scenarios (purchasing books and flight tickets). The authors concluded that the hypothesized cognitive-affective-conative-action loyalty sequence provided a better fit of the data than other possible variations. In a similar vein, McMullan and Gilmore (2003) devel-oped a 28-item scale to measure the four phases of loyalty, following Oliver’s con-ceptualization. Their empirical test in a restaurant-dining context supported the four-dimensional conceptualization.
Back (2001) agreed with most of Oliver’s (1997, 1999) development on the traditional two-dimensional view. However, based on the tripartite model of attitude structure (Breckler, 1984), he argued that cognitive, affective, and conative loyalty are essen-tially three components of the traditional
attitudinal loyalty construct; and all three should lead to action/behavioral loyalty. Furthermore, Back argued that the cogni-tive, affeccogni-tive, and conative phases of loyalty might not be a sequential formation process, as suggested by Oliver (1997, 1999). To Back, the three aspects are more likely to be independent factors of attitudinal loyalty attributable to unique variance. Empirical testing revealed that both affective and conative loyalty were positively associated with behavioral loyalty, while cognitive loyalty was not (Back, 2001; Back & Parks, 2003). Notably, although he maintained that cognitive, affective, and conative loyalty were three elements of attitudinal loyalty; Back did not measure the overarching construct of attitudinal loyalty, or include it in his model.
Lee (2003) also adopted part of Oliver’s conceptualization. However, she argued that ‘‘the cognitive stage is more likely to be an antecedent to loyalty rather than loyalty itself’’ (p. 22). Thus, Lee’s loyalty measure contained three dimensions: attitudinal, conative, and behavioral loyalty. Her study lent partial support to the three-dimensional conceptualization. Although conative loyalty was significantly and positively influenced by attitudinal loyalty, the direct effect of cona-tive loyalty on behavioral loyalty was found to be negative, which was opposite of the hypothesized direction. Lee postulated that this negative relationship might be the result of perceived constraints.
More recently, Jones and Taylor (2007) explored the dimensionality of customer loyalty. The authors suggested that with cognitive components of loyalty getting more attention, recent marketing literature seems to support a three-dimensional con-ceptualization of loyalty (cognitive, attitudi-nal, and behavioral). Parallel to this, the interpersonal psychology literature has tra-ditionally adopted a two-dimensional (beha-vioral and cognitive) conceptualization of interpersonal commitment—a construct clo-sely akin to loyalty. Jones and Taylor’s study supported a two-dimensional loyalty con-struct, in which behavioral loyalty remains
as one dimension, while attitudinal and cognitive loyalty are combined into one dimension. A closer look at Jones and Taylor’s measures indicates that what they called ‘‘attitudinal loyalty’’ might be termed ‘‘affective loyalty’’ in Oliver’s terminology, while their behavioral loyalty was essentially conative loyalty. Thus, Jones and Taylor revealed a conative versus cognitive/affective loyalty structure.
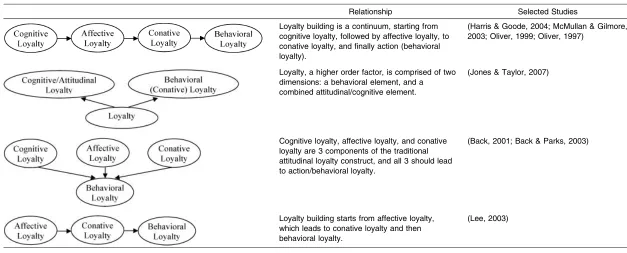
Overall, it seems consensus has not been reached on the specific structure of, or dimensions contained in the loyalty con-struct (Table 1). Nevertheless, recent discus-sion on loyalty dimendiscus-sionality broadens, rather than invalidates the traditional two-dimension view.
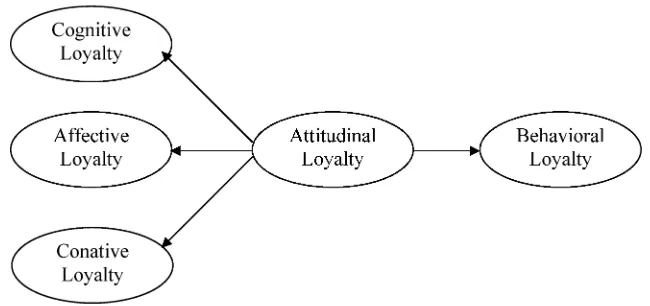
The Proposed Model
Based on the foregoing review, the present paper attempts to integrate previous findings and propose a conceptual model of loyalty dimensionality (Figure 1). Following recent conceptual development (Harris & Goode, 2004; McMullan & Gilmore, 2003; Oliver, 1999), the present research conceptualizes loyalty as a four-dimensional construct comprising of cognitive, affective, conative, and behavioral components. The first three components collectively represent the attitu-dinal aspect of loyalty. Together they form a higher order factor termed attitudinal loy-alty, which then leads to behavioral loyalty. Since the behavioral aspect of loyalty has been well supported and documented (Backman & Crompton, 1991; Cunningham, 1956; Iwasaki & Havitz, 2004; Morais et al., 2004; Pritchard et al., 1999), the focus of the present paper is on the breakdown of the attitudinal aspect of loyalty.
The operational definition of brand loy-alty, and its four components are listed below:
N
Cognitive Loyalty: The existence of be-liefs that (typically) a brand is prefer-able to others (Harris & Goode, 2004).N
Affective Loyalty: The customer’s favorable attitude or liking toward theservice brand/provider based on satis-fied usage (Harris & Goode, 2004).
N
Conative Loyalty: Behavioral intention to repurchase the service brand char-acterized by a deep brand-specific commitment (Harris & Goode, 2004).N
Behavioral Loyalty: The frequency of repeat or relative volume of same-brand purchase (Tellis, 1988).N
(Brand) Loyalty: ‘‘A deeply held psy-chological commitment to rebuy or repatronize a preferred product/service consistently in the future, thereby caus-ing repetitive same-brand or same brand-set purchasing, despite situa-tional influences and marketing efforts having the potential to cause switching behavior’’ (Oliver, 1999, p. 34).The model is developed from marketing, social psychology, and leisure literature. The four-dimensional structure originated from Oliver’s (1997, 1999) conceptualization. However, following Back (2001), the present paper argues that the first three dimensions are three independent components of attitu-dinal loyalty—an overarching construct. This argument is theoretically grounded on the widely accepted tripartite model of attitude structure (Breckler, 1984; Eagly & Chaiken, 1993; Reid & Crompton, 1993). The tripartite model suggests that there are three components of people’s attitudes: cognition, affect, and behavioral intention. The three components of attitude are inde-pendent of each other, and each exhibits unique variance that is not shared by the other two (Bagozzi, 1978). Further, some have argued that attitudes do not have to embrace all three components at the same time (Tian, 1998). Thus, the three compo-nents may not be sequential as suggested by Oliver (1997, 1999).
TABLE 1. Competing New Conceptualizations on Loyalty Dimensionality
Relationship Selected Studies
Loyalty building is a continuum, starting from cognitive loyalty, followed by affective loyalty, to conative loyalty, and finally action (behavioral loyalty).
(Harris & Goode, 2004; McMullan & Gilmore, 2003; Oliver, 1999; Oliver, 1997)
Loyalty, a higher order factor, is comprised of two dimensions: a behavioral element, and a combined attitudinal/cognitive element.
(Jones & Taylor, 2007)
Cognitive loyalty, affective loyalty, and conative loyalty are 3 components of the traditional attitudinal loyalty construct, and all 3 should lead to action/behavioral loyalty.
(Back, 2001; Back & Parks, 2003)
Loyalty building starts from affective loyalty, which leads to conative loyalty and then behavioral loyalty.
(Lee, 2003)
Xiang
(Robert)
Li
and
James
F.
Petrick
loyalty leading to behavioral loyalty) has been both theoretically and empirically established in the past (Ajzen, 1991; Albarracin, Johnson, Fishbein, & Muellerleile, 2001; Dick & Basu, 1994).
It is believed that the proposed concep-tualization is congruous with the traditional two-dimension view of loyalty, which has been widely accepted across disciplines, and has generated meaningful results. A major development is that the present conceptuali-zation suggests that attitudinal loyalty is a higher-order factor, comprising of cognitive, affective, and conative dimensions. In essence, the proposed model incorporates, rather than invalidates the traditional two-dimensional view of loyalty.
RESEARCH METHODS
Instrument Development
The survey questionnaire was developed based on a literature review, as well as extensive personal communications with leading loyalty researchers in the fields of marketing and leisure studies. To enhance the quality of this review, the authors also posted a request for updated loyalty (or commitment) literature on the Ameri-can Marketing Association Listserv, which generated valuable inputs from scholars all
over the world. After the initial version of the questionnaire was developed, 14 experts were invited to review and pretest the instrument. Further, a shortened question-naire was pilot tested among three under-graduate classes (N 5 114). The final instrument was developed based on the expert panel’s suggestions and pilot test results.
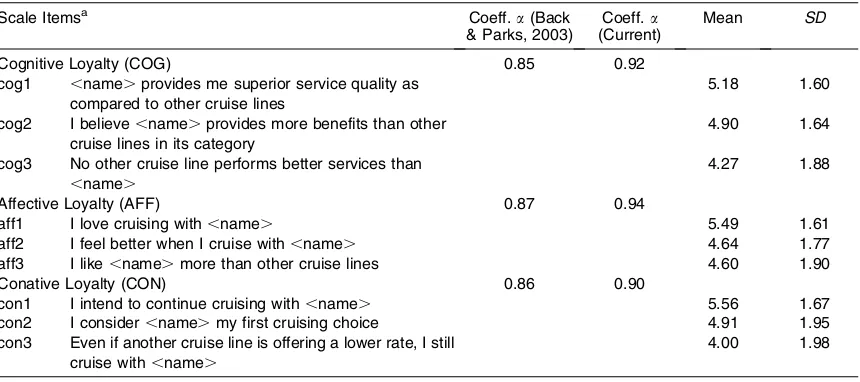
In this study, three 7-point Likert-type scales proposed by Back (2001) and Back and Parks (2003) were used to mea-sure cognitive loyalty, affective loyalty, and conative loyalty, respectively (see Table 2). Action or behavioral loyalty, fol-lowing the most frequently-used approach, was measured by proportion of brand purchase (Cunningham, 1956; Iwasaki & Havitz, 1998). Specifically, this was opera-tionalized as the number of cruises the respondent had taken with the focal cruise line in the past 3 years, divided by the total number of cruises s/he had taken during that time.
Online Panel Survey
This study utilized an online panel survey, which is a fairly commonplace method in marketing research (Dennis, 2001; Deutskens, de Jong, de Ruyter, & Wetzels, 2006; Duffy, Smith, Terhanian, & Bremer, 2005; Hansen, 2005; Sparrow & Curtice,
2004; Van Ryzin, 2004). Online survey panels ‘‘are made up of individuals who are prerecruited to participate on a more or less predictable basis in surveys over a period of time’’ (Dennis, 2001, p. 34). Despite its obvious advantage in cost efficiency and speed, some researchers have expressed concern regarding the validity of informa-tion collected from online panel studies— particularly due to the potential for sampling bias (Duffy et al.; McWilliams & Nadkarni, 2005). Some researchers have even argued that repeat and paid participation in surveys might bias online survey panelists’ attitudes and behaviors, and make them closer to ‘‘professional respondents’’ (Dennis, 2001). However, a series of recent studies (Dennis, 2001; Deutskens et al., 2006; Duffy et al., 2005) have revealed that, despite minor differences, online panel and traditional methodologies generate equivalent results in most cases. Since the representativeness of public opinion is not the primary concern of the study, the authors deemed online panel surveys appropriate for this study.
The Survey Process
The survey was conducted from March 15 to 22, 2006. Participants of this study were
currently active cruisers, who took a cruise vacation in the past 12 months. Following Cruise Lines International Association (CLIA) (2005), the authors specified four demographic and behavioral characteristics of the sample when acquiring the online panel. Participants of this study were cruise travelers who cruised at least once in the past 12 months, were over 25 years old, and had a household income of $25,000 or more. Moreover, a 50–50 gender distribution was desired. For survey design purposes, only responses about CLIA member cruise lines (CLIA, 2006b) were collected. These lines make up 95% of the overall North America cruise market (CLIA, 2006a). Further, cruise lines, rather than specific ships were chosen to ensure that participants’ responses were at the brand level.
The survey started from a screening question, asking whether the respondent took a cruise vacation in the past 12 months or not. Respondents who said ‘‘Yes’’ were presented a list of CLIA’s member lines (CLIA, 2006b), and asked which line they cruised with on their most recent cruise vacation. Clicking any of the cruise com-pany names would lead the respondent to the actual survey, which was customized
TABLE 2. Scale Wording and Measurement Property
Scale Itemsa Coeff.a(Back
& Parks, 2003)
Coeff.a
(Current)
Mean SD
Cognitive Loyalty (COG) 0.85 0.92
cog1 ,name.provides me superior service quality as
compared to other cruise lines
5.18 1.60
cog2 I believe,name.provides more benefits than other
cruise lines in its category
4.90 1.64
cog3 No other cruise line performs better services than
,name.
4.27 1.88
Affective Loyalty (AFF) 0.87 0.94
aff1 I love cruising with,name. 5.49 1.61
aff2 I feel better when I cruise with,name. 4.64 1.77
aff3 I like,name.more than other cruise lines 4.60 1.90
Conative Loyalty (CON) 0.86 0.90
con1 I intend to continue cruising with,name. 5.56 1.67
con2 I consider,name.my first cruising choice 4.91 1.95
con3 Even if another cruise line is offering a lower rate, I still
cruise with,name.
4.00 1.98
aAll items were measured on 7-point scales.
to the brand being chosen. Those who had not cruised with any of CLIA cruise lines in the past 12 months were thanked and asked to disregard the survey. A technical mechan-ism was used to ensure that all questions had to be answered before submission. The survey took approximately 12 minutes to complete.
The sample size needed for this study was mainly determined by Cohen’s (1988) power analysis. Following MacCallum, Browne, and Sugawara (1996); the minimum sample size for the proposed model (df 5 32) is approximately 350, in order to achieve power of 0.80.
RESULTS
The aforementioned procedure yielded a total of 727 responses, or, a response rate of 31.8% out of 2,283 email invitations that were sent. The response rate of the present study compares favorably to other online panel studies (Zoomerang, 2005). The authors took a conservative approach and deleted 61 invalid responses. Further, responses from 112 first-time cruisers were excluded. Thus, the effective sample size for the present study was 554.
Sample Characteristics
Respondents were mostly male (55.8%), had an average age of 53.9, were dominantly white (91.7%), and married (80.5%). About two thirds (63.9%) had a college degree or more and the median income was $75,000 to $100,000. On average, respondents had taken 8.3 cruises with 3.4 different lines in their lifetime. For their brand purchase history (i.e., experiences with the specific cruise line they chose), respondents had taken an average of 3.1 cruises with the cruise line, and had a history of 6.2 years cruising with that line.
Nonresponse bias was checked by com-paring three demographic characteristics (age, gender, and household income) of the respondents to those of the 2,283 people
invited to the survey. Overall, no significant bias was detected. Further, sampling bias was checked by comparing respondents’ demographic statistics to those of average cruise passengers, as reported in CLIA’s 2004 Cruise Market Profile(CLIA, 2005). It seemed that respondents of this study were demographically similar to typical cruisers, but slightly more active in behavior.
Modeling and Hypotheses Testing
A structural equation modeling (SEM) procedure was employed to analyze the data. The analysis followed guidelines sug-gested by Byrne (2001) and Ullman (2001). Before testing the model, a variety of practical issues were checked—including sample size, missing values, univariate and multivariate outliers, continuous scales, lin-earity, univariate and multivariate normal-ity, and so on. The only detected issue was that Mardia’s (1970) normalized estimate of multivariate kurtosis was fairly large, which suggested the data might have a multi-variate nonnormal distribution. One approach to dealing with multivariate non-normal data is nonparametric bootstrapping (Byrne, 2001; Kline, 2005). Thus, bootstrap results based on 500 bootstrap samples are reported in the following section. Further, inter-correlations between major constructs were obtained, as recommended by Hatcher (1994). It was found that cognitive, affec-tive, and conative loyalty had exceedingly high correlations (all . 0.97). This will be addressed later.
The SEM procedure was conducted in four stages: (a) testing the proposed model, (b) model comparison, (c) model modifica-tion, and (d) assessing validity and reliabil-ity.
Stage 1: Testing the Proposed Model
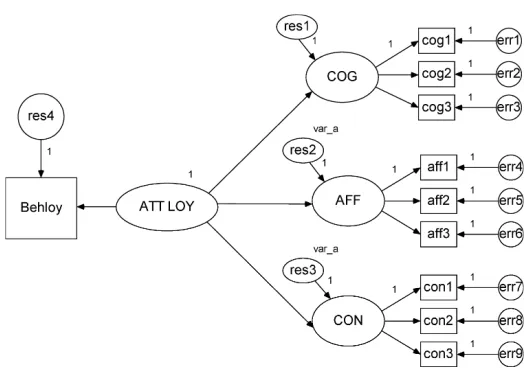
encompassing construct (in this case, attitudi-nal loyalty). Hair, Anderson, Tatham, and Black (1998) suggested that second-order CFA models allow for a stronger statement about the dimensionality of a construct than tradi-tional approaches.
The second-order CFA model was tested following a procedure recommended by Byrne (2001). First, the identification of the higher order portion of the model was addressed, since this part of the model was initially just-identified with 3 first-order factors. As suggested by Byrne, this problem can be solved by placing equality constraints on certain parameters known to yield esti-mates that are approximately equal, through the application of the critical ratio difference (CRDIFF) method. It was found that the estimated values of the higher order residuals related to affective (20.0031) and conative loyalty (20.021) were almost identical, and the computed critical ratios for differences between the two residuals were 20.703 (absolute value,1.96). Thus, it was decided to constrain the variance of the residuals related to affective and conative loyalty to be equal. The hypothesized model, with the equality constraints specified, is presented in Figure 2.
The next step involved obtaining the goodness-of-fit statistics and modification indices (MI) (So¨rbom, 1986) related to the hypothesized model. Since most researchers have argued that chi-square is highly sensi-tive to sample size, it has been suggested that the use of multiple indices may collectively present a more realistic picture of model fit (McDonald & Ringo Ho, 2002). Following Byrne’s (2001) recommendation, GFI (acceptable when . 0.9; Hu & Bentler, 1995), CFI (acceptable when . 0.9; Bentler, 1990),, and RMSEA (acceptable when , 0.1; Browne & Cudeck, 1993) were chosen to assess model fitness. Also included were the normed chi-square (NC) (x2/df, acceptable when,5; Bollen, 1989), and the Bollen-Stine bootstrap x2 (BSboot)—the
chi-square test based on Bollen and Stine’s (1992) bootstrap procedure.
Considering the model was neither too large nor complex, the goodness-of-fit sta-tistics indicated a poor fit (see Table 3). The multiple large MI values further evidenced that there could be substantial misfit in the hypothesized second-order model structure. Further, the MI results were fairly complex, and did not present a meaningful solution to improve the model fit.
FIGURE 2. Hypothesized Second-Order Model
Stage 2: Model Comparison
For years, statisticians have called for the use of alternative models (i.e., comparing the performances of rival a priori models) in model specification and evaluation (Bagozzi & Yi, 1988; Jo¨reskog & So¨rbom, 1996; MacCallum & Austin, 2000). Thus, the authors examined alternative loyalty con-ceptualizations by testing a series of compet-ing models (Table 1). These included:
N
Rival Model 1: Oliver’s four-dimen-sional sequential model (Harris & Goode, 2004; McMullan & Gilmore, 2003; Oliver, 1997, 1999);N
Rival Model 2: Back’s four-dimen-sional first-order model (Back, 2001; Back & Parks, 2003);N
Rival Model 3: Lee’s three-dimensional sequential model (Lee, 2003); andN
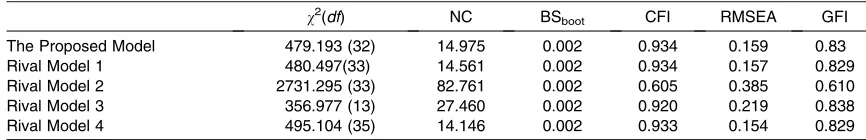
Rival Model 4: The traditional two-dimensional model (Backman & Crompton, 1991; Day, 1969; Dick & Basu, 1994; Jacoby & Chestnut, 1978; Pritchard et al., 1999).Table 3 displays the fitness statistics of these models. It seems that the fitness levels of all these models were no different from, or even worse than the hypothesized one. In other words, none of the models provided a good fit of the data. In light of these results, it was decided that exploratory analysis should be used to purify measures (Churchill, 1979).
Stage 3. Model Modification
Following Churchill’s (1979) recommen-dation, an exploratory factor analysis (EFA) was employed to identify the potential
pattern of the nine items, which were supposed to measure cognitive, affective, and conative loyalty. Note that the EFA results should and would only serve as a reference for the present discussion on loyalty dimensionality. It was found that the nine items in discussion all loaded on a single dimension, instead of the three dimen-sions hypothesized. Next, Cronbach’s alpha, and alpha-if-item-deleted analysis was also performed. The Cronbach’s alpha for the nine items was quite high, and deleting any one of the items would have little effect on alpha.
The EFA results seemed to support the one-dimension conceptualization of attitu-dinal loyalty. Further, recall that the inter-correlations among cognitive, affective, and conative loyalty were exceptionally high (all exceeding 0.97). Kline (2005) suggested that when two factors have a correlation over 0.85, they may not be accommodated in one structural equation model, as the two factors demonstrate poor discriminant validity (Rundle-Thiele, 2005), and could cause SEM to be statistically unstable. Put simply, they may be measuring the same construct. These results implied that the traditional one-dimensional conceptualiza-tion of attitudinal loyalty was theoretically and statistically more solid than the pro-posed model.
Moreover, the alpha-if-item-deleted ana-lysis showed that when all nine items were used to measure one single first-order factor, they might be redundant with each other. Byrne (2001, p. 134), in her discussion on model modification, suggested ‘‘error corre-lations between item pairs are often an indication of perceived redundancy in item content.’’ To solve such problems, some
TABLE 3. Goodness-of-Fit Statistics of the Models
x2(df) NC BSboot CFI RMSEA GFI
The Proposed Model 479.193 (32) 14.975 0.002 0.934 0.159 0.83
Rival Model 1 480.497(33) 14.561 0.002 0.934 0.157 0.829
Rival Model 2 2731.295 (33) 82.761 0.002 0.605 0.385 0.610
Rival Model 3 356.977 (13) 27.460 0.002 0.920 0.219 0.838
researchers have suggested that deleting questionable items could be an effective way to improve a measurement model with-out sacrificing its theoretical meaningfulness (Bentler & Chou, 1987; Byrne, 2001; Morais, Backman, & Dorsch, 2003). Further, Hatcher (1994) recommended that to avoid excessive complexity in measurement mod-els, researchers may limit the number of indicators used to measure one latent vari-able to around four. Netemeyer, Bearden, and Sharma (2003) also maintained that shorter scales are typically preferred.
In light of these recommendations, it was concluded that the initial misfit of Rival Model 4 might be due to redundant items, and deleting these items may generate a better measure of one-dimensional attitudi-nal loyalty. This modification process, though post hoc in nature, strictly followed recommended procedures (Bentler & Chou, 1987; Byrne, 2001; Hatcher, 1994). Items associated with questionable MIs, insignif-icant paths (if at all), large standardized errors—and most importantly, conceptual or semantic fuzziness—were considered as can-didates for deletion.
Specifically, this deletion process started with CON3, which had the largest standard error, and a comparatively weaker path. Two other items—AFF1 and CON1—were subsequently deleted, as both items were associated with multiple significant MIs. In fact, several expert panelists mentioned in the pilot test phase that AFF1 was somewhat confusing. Finally, COG1 was deleted based on its comparatively large residuals, and weak loadings, as well as its semantic redundancy with the other two cognitive items. This process resulted in a one-dimen-sional loyalty measure containing five items: COG2 (‘‘I believe ,name. provides more benefits than other cruise lines in its cate-gory’’), COG3 (‘‘No other cruise line per-forms better services than,name.’’), AFF2 (‘‘I feel better when I cruise with,name.’’), AFF3 (‘‘I like ,name. more than other cruise lines’’), and CON2 (‘‘I consider
,name. my first cruising choice’’). The five-item model, with x2(5, N 5 554) 5
26.131, p , 0.001, CFI 5 0.994, GFI 5 0.982, RMSEA50.087, demonstrated good fit.
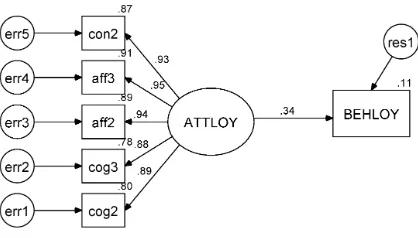
Finally, the modified loyalty model was tested in a structural equation model, with attitudinal loyalty as an exogenous variable, and behavioral loyalty as an endogenous variable (see Figure 3). The model, withx2(9, N5554)552.399,p,0.001, CFI50.988, GFI 5 0.969, RMSEA 5 0.093, demon-strated a good fit of the data. However, it was noted that the RSMC2 (0.115) of
BEHLOY was fairly low, which indicated that attitudinal loyalty accounted for only a small portion of the variance associated with behavioral loyalty.
Stage 4. Assessing Validity and Reliability
The preceding procedure, though post hoc in nature, essentially generated a five-item scale measuring attitudinal loyalty. Before drawing final conclusions, the authors deemed it necessary to examine the psycho-metric properties of this measure. First, convergent validity of indicators is evidenced by the ability of the scale items to load on its underlying construct (Bagozzi, 1994). Convergent validity may be further evi-denced if each indicator’s standardized loading on its posited latent construct is greater than twice its standard error (Anderson & Gerbing, 1988). All items under investigation met these two require-ments.
Second, discriminant validity may be assessed by comparing the average variance
FIGURE 3. Exploring the Relationship Between Attitudinal Loyalty and Behavioral Loyalty
extracted (AVE) for the focal measure with a similar, but conceptually different, construct; and the square of the correlation between the two factors (Hatcher, 1994; Netemeyer et al., 2003). Discriminant validity is demonstrated if both AVEs are greater than the squared correlation. This requirement was satisfied after checking the AVEs and the squared correlation value for the attitudinal loyalty measure and three similar, but conceptually different constructs (satisfaction, quality, and value) (see Table 4). Thus, discriminant validity of the scale was established.
Third, scale reliability was checked in multiple ways. These included Cronbach’s coefficient alpha (avalues need to exceed 0.7; Nunnally & Bernstein, 1994), indicator reliability (RSMC2 needs to exceed 0.5;
Fornell & Larcker, 1981), composite relia-bility (the recommended cutoff point is 0.6; Bagozzi & Yi, 1988), and AVE (AVE needs to exceed 0.5; Fornell & Larcker, 1981). It
was found that the five-item measure met all these requirements.
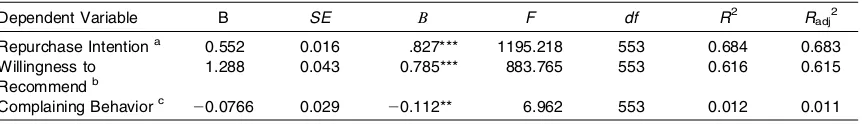
Finally, nomological validity is considered to be established when the proposed measure successfully predicts other constructs that previous literature suggests it should predict (Netemeyer et al., 2003). To test it, the authors ran three regression models, where attitudinal loyalty (operationalized as the mean of the five items) was modeled as predictors of three behavioral outcomes. The three variables—all of which have been suggested as loyalty outcomes—included repurchase intention (Morais et al., 2004), willingness to recommend (Dick & Basu, 1994), and complaining behavior (Davidow, 2003). As shown in Table 5, in all three models, attitudinal loyalty’s effect on the dependent variables was statistically significant, and its effects were consistent with what has been previously observed (Davidow, 2003; Dick & Basu, 1994; Morais et al., 2004; Petrick, 2004;
TABLE 4. Correlations Between Major Constructs
VAL QUA ATTLOY SAT
Value (VAL)d 0.849a 0.630c 0.551 0.623
Quality (QUA)e 0.794b 0.929 0.567 0.663
Attitudinal Loyalty (ATTLOY)
0.742 0.753 0.873 0.555
Satisfaction (SAT)f 0.789 0.814 0.745 0.841
aThe diagonal entries (in italics) represent the average variance extracted by the construct. bThe correlations between constructs are shown in the lower triangle.
cThe upper triangle entries represent the variance shared (squared correlation) between constructs. dMeasured by Sirdeshmukh, Singh, and Sabol’s (2002) four-item, 7-point scale.
eMeasured by Petrick’s (2002) four-item, 7-point subscale of his SERV-PERVAL scale. fMeasured by Spreng, MacKenzie, and Olshavsky’s (1996) four-item, 7-point scale.
TABLE 5. Summary of Regression Analyses
Dependent Variable B SE B F df R2 R
adj2
Repurchase Intentiona 0.552 0.016 .827*** 1195.218 553 0.684 0.683
Willingness to
Recommendb
1.288 0.043 0.785*** 883.765 553 0.616 0.615
Complaining Behaviorc 20.0766 0.029 20.112** 6.962 553 0.012 0.011
Note.**p,.01, ***p,.001.
a
Measured by Grewal, Monroe, and Krishnan’s (1998) two-item, 5-point scale.
b
Measured by Reichheld’s (2003) one-item, 11-point scale.
Rundle-Thiele, 2005). These provide further support for the validity of the scale.
Combined, tests on the convergent, dis-criminant and nomological validity, and the reliability of the five-item measure showed that it served as a good measure of the single-dimensioned attitudinal loyalty con-struct. It was thus concluded that the five-item measure, measuring attitudinal loyalty as a single-dimension, first-order construct, demonstrated better fit of data than the hypothesized second-order model.
CONCLUSIONS AND IMPLICATIONS
This study attempted to explore the dimensional structure of the loyalty con-struct. Following recent developments in loyalty studies (Back, 2001; Jones & Taylor, 2007; Oliver, 1997, 1999), loyalty in this paper was conceptualized as a four-dimensional construct, comprising of cogni-tive, affeccogni-tive, conacogni-tive, and behavioral loyalty. Further, this paper postulated that three components of loyalty (cognitive, affective, and conative loyalty) collectively formed a higher order factor—namely atti-tudinal loyalty. However, this conceptualiza-tion was not supported by the data. A competing model based on the traditional conceptualization that attitudinal loyalty is a one-dimensional, first-order factor was found to provide a better fit of the data than other possible variations. Further, the paper supported the attitudinal loyalty-behavioral loyalty link (Ajzen, 1991; Albarracin et al., 2001; Dick & Basu, 1994). Nevertheless, the relatively low var-iance of behavioral loyalty explained by attitudinal loyalty suggests that the atti-tude-behavior link may be moderated by other factors, which is also consistent with previous studies (Back, 2001; Dick & Basu, 1994).
In sum, this study supported the tradi-tional two-dimensional conceptualization of loyalty, which maintains that loyalty has an attitudinal and a behavioral component
(Backman & Crompton, 1991; Cunningham, 1956; Iwasaki & Havitz, 2004; Morais et al., 2004; Pritchard et al., 1999). Moreover, this finding seems to be congruent with psychol-ogy literature on interpersonal commitment, which has consistently suggested that pro-relationship acts (i.e., commitment) have two components—behavioral and cognitive (Jones & Taylor, 2007). Findings are also similar to Jones and Taylor, who concluded that ‘‘…regardless of the target (friend, spouse, service provider), loyalty captures, in essence, what Oliver (1999) referred to as ‘what the person does’ (behavioral loyalty) and the psychological meaning of the rela-tionship (attitudinal/cognitive loyalty)’’ (p. 45).
While the two-dimensional conceptualiza-tion of brand loyalty is not new to marketing or psychology researchers, what the present results reveal is that the two dimensions might be more complex than previously suggested. Remaining in the final five-item attitudinal loyalty measure are cognitive, affective, and conative components; which is consistent with the tripartite model of attitude structure in the psychology litera-ture (Breckler, 1984; Eagly & Chaiken, 1993; Reid & Crompton, 1993). One might spec-ulate that although these three aspects of loyalty loaded in the same dimension, they could account for unique aspects of the construct. Admittedly, the present results may also imply that the respondents couldn’t tell the differences between cognitive, affec-tive, and conative loyalty; even though these components make conceptual sense.
In addition to clarifying the conceptual structure of customers’ brand loyalty, this research also contributes to the literature by introducing and validating a five-item atti-tudinal loyalty measure. The scale was deemed to be theoretically and psychome-trically sound, and might be used in future loyalty research.
Although this study is primarily theore-tical, it is believed that the revealed con-ceptual structure of customer brand loyalty may provide insights for cruise management. Although the data did not support the
proposed multidimensional structure of atti-tudinal loyalty, the final five-item scale does contain cognitive, affective, and conative components. For many service providers who focus primarily on the technical aspects of their services (i.e., helping customers build cognitive belief), this suggests that they should include affective and conative infor-mation in their marketing messages. Further, the relatively low variance of behavioral loyalty explained by attitudinal loyalty suggests that simply winning customers’ positive attitude does not necessarily lead to positive outcomes. Consumer behavior is extremely complicated, and marketers need to better understand other moderators to the attitude-behavior link.
Facing more sophisticated customers and challenged by more aggressive competitors, cruise line management, as well as many other tourism sectors, have invested tremen-dous resources to retain and reward loyal customers. The present scale provides a feasible tool for identifying, and potentially segmenting loyal and disloyal customers. Information generated via this tool may help managers design loyalty programs, and reward the right type of customer attitudes and behaviors (Jones & Taylor, 2007). It may also facilitate the benchmarking of customers’ loyalty within, and across differ-ent tourism services.
LIMITATIONS AND FUTURE RESEARCH
The present results may be limited to respondents who participated in this study, and who cruised at least once with one of CLIA’s member lines in the past 12 months. Further research is necessary in order to determine whether the conceptual structure can be generalized to cruise passengers in other cultures and geographic regions, other recreationists, and ultimately consumers of different services.
Another limitation of this study is it did not consider differences in cruise lines. Employing different marketing strategies
and loyalty programs and targeting different market segments, the cruise lines used in this study might exhibit considerable differences affecting customer loyalty building. It is uncertain whether and how these ‘‘noises’’ will influence the theoretical relationships suggested. It is quite possible that the current results are very different at the individual cruise line level; and that by combining cruise lines, the present results cannot be applied at the individual cruise line level.
The five-item attitudinal loyalty scale used in this study, though demonstrating good validity and reliability, was generated from post hoc analyses. Admittedly, the original purpose of this paper is to examine the dimensionality of the loyalty construct, not scale development. Thus, the study is further limited by not going through a complete scale development process (Churchill, 1979; Netemeyer et al., 2003).
Yet, in conclusion, it is believed that this study contributes to the literature by system-atically reviewing and empirically examining recent conceptual developments on loyalty dimensionality. As a result, the traditional two-dimensional loyalty conceptualization was revalidated, and a five-item attitudinal loyalty scale was generated. It is hoped that these findings will provide new insights for customer loyalty research, measurement, and management.
ENDNOTE
1. The negative residuals here, considering their magnitude, may be treated as 0 (Kline, 2005).
REFERENCES
Ajzen, I. (1991). The theory of planned behavior. Organizational Behavior and Human Decision Processes,50(2), 179-211.
recommended two-step approach. Psychological Bulletin,103(3), 411-423.
Assael, H. (2004). Consumer behavior: A strategic approach. Boston: Houghton Mifflin.
Back, K. (2001). The effects of image congruence on customer satisfaction and brand loyalty in the lodging industry. Unpublished doctoral dissertation, The Pennsylvania State University.
Back, K., & Parks, S. C. (2003). A brand loyalty model involving cognitive, affective, and conative brand loyalty and customer satisfaction. Journal of Hospitality & Tourism Research,27(4), 419-435. Backman, S. J., & Crompton, J. L. (1991). The
usefulness of selected variables for predicting activity loyalty.Leisure Sciences,13(3), 205-220. Bagozzi, R. P. (1978). The construct validity of the
affective, behavioral, and cognitive components of attitude by analysis of covariance structures. Multivariate Behavioral Research,13(1), 9-31. Bagozzi, R. P. (1994).Principles of marketing research.
Oxford, UK: Basil Blackwell.
Bagozzi, R. P., & Yi, Y. (1988). On the evaluation of structural equation models.Journal of the Academy of Marketing Science,16(1), 74-94.
Bass, F. M. (1974). The theory of stochastic preference and brand switching. Journal of Marketing Research,11(1), 1-20.
Bentler, P. M. (1990). Comparative fit indexes in structural models. Psychological Bulletin, 107(2), 238-246.
Bentler, P. M., & Chou, C.-P. (1987). Practical issues in structural modeling. Sociological Methods & Research,16(1), 78-117.
Bollen, K. A. (1989).Structural equations with latent variables. New York: Wiley.
Bollen, K. A., & Stine., R. A. (1992). Bootstrapping goodness-of-fit measures in structural equation models. Sociological Methods and Research,21(2), 205-229.
Breckler, S. J. (1984). Empirical validation of affect, behavior, and cognition as distinct components of attitude. Journal of Personality and Social Psychology,47(6), 1191-1205.
Browne, M. W., & Cudeck, R. (1993). Alternative ways of assessing fit. In K. A. Bollen & J. S. Long (Eds.),Testing structural equations models(pp. 445-455). Newbury Park, CA: Sage.
Byrne, B. M. (2001).Strucutral equation modeling with AMOS: Basic concepts, applications, and program-ming. Mahwah, NJ: Lawrence Erlbaum Associates. Churchill, G. A. J. (1979). A paradigm for developing better measures of marketing constructs.Journal of Marketing Research,16(1), 64-73.
Cohen, J. (1988). Statistical power analysis for the behavioral sciences (2nd ed.). Hilldale, NJ: Lawrence Erlbaum Associates.
Cruise Lines International Association. (2005).CLIA’s 2004 cruise market profile: Report of findings. Retrieved April 8, 2006, from http://www.cruising. org/press/research/2004%20market%20Profile%20 Presentation_files/frame.htm
Cruise Lines International Association. (2006a).About CLIA. Retrieved April 8, 2006, from http://www. cruising.org/about.cfm
Cruise Lines International Association. (2006b).Cruise lines & ship profiles. Retrieved March 11, 2006, from http://www.cruising.org/CruiseLines/index.cfm Cunningham, R. M. (1956). Brand loyalty—What,
where, how much?Harvard Business Review,34(1), 116-128.
Davidow, M. (2003). Organizational responses to customer complaints: What works and what doesn’t.Journal of Service Research,5(3), 225-250. Day, G. S. (1969). A two-dimensional concept of brand loyalty.Journal of Advertising Research,9(3), 29-35.
Dennis, J. M. (2001). Are Internet panels creating professional respondents? Marketing Research, 13(2), 34-38.
Deutskens, E. C., de Jong, A., de Ruyter, K., & Wetzels, M. (2006). Comparing the generalizability of online and mail surveys in cross-national service quality research.Marketing Letters,17(2), 119-136. Dick, A. S., & Basu, K. (1994). Customer loyalty: Toward an integrated framework. Journal of the Academy of Marketing Science,22(2), 99-113. Dimanche, F., & Havitz, M. E. (1994). Consumer
behavior and tourism: Review and extension of four study areas. Journal of Travel & Tourism Marketing,3(3), 37-57.
Duffy, B., Smith, K., Terhanian, G., & Bremer, J. (2005). Comparing data from online and face-to-face surveys. International Journal of Market Research,47(6), 615-639.
Eagly, A. H., & Chaiken, S. (1993).The psychology of attitudes. Orlando, FL: Harcourt Brace Jovanovich.
Ehrenberg, A. S. C. (1988).Repeat buying: Theory and applicationLondon: Charles Griffin and Co. Fornell, C., & Larcker, D. F. (1981). Evaluating
structural equation models with unobservable vari-ables and measurement error.Journal of Marketing Research,18(1), 39-50.
Fournier, S. (1998). Consumers and their brands: Developing relationship theory in consumer research. Journal of Consumer Research, 24(4), 343-373.
Grewal, D., Monroe, K. B., & Krishnan, R. (1998). The effects of price-comparison advertising on buyers’ perceptions of acquisition value, transac-tion value, and behavioral intentransac-tions. Journal of Marketing,62(2), 46-59.
Gronroos, C. (1994). From marketing mix to relation-ship marketing: Towards a paradigm shift in marketing.Asia-Australia Marketing Journal,2(1), 9-29.
Guest, L. (1944). A study of brand loyalty.Journal of Applied Psychology,28(1), 16-27.
Gummersson, E. (2002). Relationship marketing and a new economy: It’s time for deprogramming. Journal of Services Marketing,16(7), 585-589. Hair, J. F., Jr., Anderson, R. E., Tatham, R. L., &
Black, W. C. (1998).Multivariate data analysis(5th ed.). Upper Saddle River, NJ: Prentice-Hall International, Inc.
Hansen, T. (2005). Understanding consumer online grocery behavior: Results from a Swedish study. Journal of Euromarketing,14(3), 31-58.
Harris, L. C., & Goode, M. M. H. (2004). The four levels of loyalty and the pivotal role of trust: A study of online service dynamics. Journal of Retailing,80(2), 139-158.
Hatcher, L. (1994).A step-by-step approach to using the SAS system for factor analysis and structural equation modeling. Cary, NC: SAS Institute Inc. Hu, L. T., & Bentler, P. M. (1995). Evaluating model
fit. In R. H. Hoyle (Ed.), Structural equation modeling: Concepts, issues, and applications (pp. 76-99). Thousand Oaks, CA: Sage.
Iwasaki, Y., & Havitz, M. (1998). A path analytic model of the relationships between involvement, psychological commitment, and loyalty.Journal of Leisure Research,30(2), 256-280.
Iwasaki, Y., & Havitz, M. (2004). Examining relation-ships between leisure involvement, psychological commitment and loyalty to a recreation agency. Journal of Leisure Research,36(1), 45-72.
Jacoby, J., & Chestnut, R. (1978). Brand loyalty measurement and management. New York: Wiley. Jain, A. K., Pinson, C., & Malhotra, N. K. (1987).
Customer loyalty as a construct in the marketing of banking services. International Journal of Bank Marketing,5(3), 49-72.
Jarvis, L. P., & Wilcox, J. B. (1976). Repeat purchasing behavior and attitudinal brand loyalty: Additional evidence. In K. L. Bernardt (Ed.), Marketing: 1776–1976 and beyond (pp. 151-152). Chicago: American Marketing Association.
Jones, T., & Taylor, S. F. (2007). The conceptual domain of service loyalty: How many dimensions? Journal of Services Marketing,21(1), 36-51. Jo¨reskog, K. G., & So¨rbom, D. (1996). LISREL 8
user’s reference guide. Chicago: Sci. Software Int. Kline, R. B. (2005).Principles and practice of structural
equation modeling(2nd ed.). New York: Guilford. Knox, S., & Walker, D. (2001). Measuring and
managing brand loyalty. Journal of Strategic Marketing,9(2), 111-129.
Kraus, S. J. (1995). Attitudes and the prediction of behavior: A meta-analysis of the empirical litera-ture. Personality and Social Psychology Bulletin, 21(1), 58-75.
Lee, J. (2003).Examining the antecedents of loyalty in a forest setting: Relationships among service quality, satisfaction, activity involvement, place attachment, and destination loyalty. Unpublished doctoral dis-sertation, The Pennsylvania State University. Lois, P., Wang, J., Wall, A., & Ruxton, T. (2004).
Formal safety assessment of cruise ships.Tourism Management,25(1), 93-109.
MacCallum, R. C., & Austin, J. T. (2000). Applications of structural equation modeling in psychological research. Annual Review of Psychology,51(1), 201-226.
MacCallum, R. C., Browne, M. W., & Sugawara, H. M. (1996). Power analysis and determination of sample size for covariance structure modeling Psychological Methods,1(2), 130-149.
Mardia, K. V. (1970). Measures of multivariate skewness and kurtosis with applications. Biometrika,57(3), 519-530.
McDonald, R. P., & Ringo Ho, M.-H. (2002). Principles and practice in reporting structural equation analyses. Psychological Methods, 7(1), 64-82.
McMullan, R., & Gilmore, A. (2003). The conceptual development of customer loyalty measurement: A proposed scale.Journal of Targeting, Measurement and Analysis of Marketing,11(3), 230-243. McWilliams, E. G., & Nadkarni, N. (2005).
Differences in reported travel behavior for an online panel versus mail panel [Electronic version]. e-Review of Tourism Research (eRTR),3, 16-17. Miller, A. R., & Grazer, W. F. (2003). Complaint
behavior as a factor in cruise line losses: An analysis of brand loyalty. Journal of Travel & Tourism Marketing,15(1), 77-91.
Morais, D. B. (2000). Reconceptualization of loyalty under a resource investment perspective: A study of group leaders in the leisure service industry. Unpublished doctoral dissertation, Clemson University, SC.
Morais, D. B., Backman, S. J., & Dorsch, M. J. (2003). Toward the operationalization of resource invest-ments made between customers and providers of a tourism service.Journal of Travel Research,41(4), 362-374.
Morais, D. B., Dorsch, M. J., & Backman, S. J. (2004). Can tourism providers buy their customers’ loyalty? Examining the influence of customer-provider investments on loyalty. Journal of Travel Research,42(3), 235-243.
providers: A focus on resource investments.Journal of Travel & Tourism Marketing,18(1), 49-57. Netemeyer, R. G., Bearden, W. O., & Sharma, S.
(2003). Scaling procedures: Issues and applications. Thousand Oaks, CA: Sage Publications.
Nunnally, J., & Bernstein, I. (1994). Psychometric theory(3rd ed.). New York: McGraw-Hill. Oliver, R. L. (1997). Satisfaction: A behavioral
perspective on the consumer. New York: Irwin/ McGraw-Hill.
Oliver, R. L. (1999). Whence consumer loyalty. Journal of Marketing,63(4), 33-44.
O’Mally, L. (1998). Can loyalty schemes really build loyalty?Marketing Intelligence and Planning,16(1), 47-65.
Petrick, J. F. (2002). Development of a multi-dimensional scale for measuring the perceived value of a service.Journal of Leisure Research,34(2), 119-134.
Petrick, J. F. (2004). Are loyal visitors desired visitors? Tourism Management,25(4), 463-470.
Pine, B. J., & Gilmore, J. H. (1999). The experience economy. Boston: Harvard Business School Press. Pritchard, M. P., Havitz, M. E., & Howard, D. (1999).
Analyzing the commitment-loyalty link in service contexts. Journal of the Academy of Marketing Science,27(3), 333-348.
Reichheld, F. F. (2003). The one number you need to grow.Harvard Business Review,81(12), 2-10. Reid, L. J., & Crompton, J. L. (1993). A taxonomy of
leisure purchase decision paradigms based on level of involvement.Journal of Leisure Research,25(2), 182-202.
Rundle-Thiele, S. (2005). Loyalty: An empirical exploration of theoretical structure in two service markets. Unpublished doctoral dissertation, University of South Australia, Adelaide, Australia. Selin, S. W., Howard, D. R., Udd, E., & Cable, T. T. (1988). An analysis of consumer loyalty to municipal recreation programs. Leisure Sciences, 10(3), 217-223.
Sheth, J. N., & Parvatlyar, A. (1995). Relationship marketing in consumer markets: Antecedents and consequences.Journal of the Academy of Marketing Science,23(4), 255-271.
Shoemaker, S., & Lewis, R. C. (1999). Customer loyalty: The future of hospitality marketing. International Journal of Hospitality Management, 18(4), 345-370.
Sirdeshmukh, D., Singh, J., & Sabol, B. (2002). Consumer trust, value, and loyalty in relational exchanges.Journal of Marketing,66(1), 15-37. So¨rbom, D. (1986). Model modification (Research
Report No. 86-3). Uppsala, Sweden: University of Uppsala, Department of Statistics.
Sparrow, N., & Curtice, J. (2004). Measuring the attitudes of the general public via internet polls: An evaluation. International Journal of Market Research,46(1), 23-44.
Spreng, R. A., MacKenzie, S. B., & Olshavsky, R. W. (1996). A reexamination of the determinants of consumer satisfaction.Journal of Marketing,60(3), 15-32.
Tellis, G. J. (1988). Advertising exposure, loyalty, and brand purchase: A two-stage model of choice. Journal of Marketing Research,25(2), 134-144. Tian, S. (1998). Testing the efficacy of an attitudinal
process model of the relationship between service quality and visitor satisfaction in a tourism context. Unpublished doctoral dissertation, Texas A&M University, College Station, TX.
Tucker, W. T. (1964). The development of brand loyalty.Journal of Marketing Research,1(3), 32-35. Ullman, J. B. (2001). Structural equation modeling. In B. G. Tabachnick & L. S. Fidell (Eds.), Using multivariate statistics (4th ed., pp. 653-771). Needham Heights, MA: Allyn & Bacon.
Van Ryzin, G. G. (2004). The measurement of overall citizen satisfaction. Public Performance & Management Review,27(3), 9-28.
Zoomerang (2005). ZoomPanel and Sample Sales Training[Powerpoint file]. San Francisco: Author.
SUBMITTED: June 28, 2007 FINAL REVISION SUBMITTED: September 18, 2007 ACCEPTED: September 27, 2007 REFEREED ANONYMOUSLY