Vibrational spectroscopic characterization of the phosphate mineral
althausite Mg
2
(PO
4
)(OH,F,O) – Implications for the molecular structure
Ray L. Frost
a,⇑, Andrés López
a, Yunfei Xi
a, Ricardo Scholz
ba
School of Chemistry, Physics and Mechanical Engineering, Science and Engineering Faculty, Queensland University of Technology, GPO Box 2434, Brisbane, Queensland 4001, Australia
b
Geology Department, School of Mines, Federal University of Ouro Preto, Campus Morro do Cruzeiro, Ouro Preto, MG 35,400-00, Brazil
h i g h l i g h t s
We have studied the mineral althausite Mg2(PO4)(OH,F,O). It occurs as a secondary product in
granitic pegmatites.
Raman and infrared bands are assigned to HOPO3
3 and PO34 units.
No bands which are attributable to water were found.
Vibrational spectroscopy enables aspects of the molecular structure of althausite.
g r a p h i c a l
a b s t r a c t
a r t i c l e
i n f o
Article history:
Received 2 July 2013
Received in revised form 30 September 2013
Accepted 2 October 2013 Available online 14 October 2013
Keywords:
Althausite Phosphate Raman Infrared Pegmatite
a b s t r a c t
Natural single-crystal specimens of althausite from Brazil, with general formula Mg2(PO4)(OH,F,O) were
investigated by Raman and infrared spectroscopy. The mineral occurs as a secondary product in granitic pegmatites. The Raman spectrum of althausite is characterized by bands at 1020, 1033 and 1044 cm 1,
assigned tom1symmetric stretching modes of the HOPO33 and PO34 units. Raman bands at around
1067, 1083 and 1138 cm 1are attributed to both the HOP and PO antisymmetric stretching vibrations.
The set of Raman bands observed at 575, 589 and 606 cm 1are assigned to the
m4out of plane bending
modes of the PO4and H2PO4units. Raman bands at 439, 461, 475 and 503 cm 1are attributed to them2
PO4and H2PO4bending modes. Strong Raman bands observed at 312, 346 cm 1with shoulder bands at
361, 381 and 398 cm 1are assigned to MgO stretching vibrations. No bands which are attributable to
water were found. Vibrational spectroscopy enables aspects of the molecular structure of althausite to be assessed.
Ó2013 Elsevier B.V. All rights reserved.
Introduction
Althausite Mg2(PO4)(OH,F,O) is a hydroxy phosphate of
magne-sium. The mineral is found in complex granitic pegmatites, formed by oxidation and hydration of primary minerals. The mineral orig-inates from Minas Gerais [1], at the Sapucaia pegmatite mine, about 50 km east–southeast of Govenador Valdares, and in good crystals from the Criminoso pegmatite mine, about 35 km north.
The mineral varies in color from dark blue–green to black. The mineral is found at many sites worldwide[1–9]including at Olary, South Australia [9], and is found in magnetite–serpentinite deposits. The name of the mineral honors Professor Egon Althaus (1933–), Karlsruhe University, Karlsruhe, Germany.
The mineral is orthorhombic[10], pseudotetragonal with point group: 2/m. The cell data is Space Group: P21/c, with a= 8.258,
b= 6.054,c= 14.383,b= 120 150 andZ= 4.
According to Roemming and Raade, magnesium atoms occur in both five- and sixfold coordination, and the coordination polyhedra are highly distorted[10]. The Mg octahedra form chains along D by
1386-1425/$ - see front matterÓ2013 Elsevier B.V. All rights reserved.
http://dx.doi.org/10.1016/j.saa.2013.10.018
⇑Corresponding author. Tel.: +61 7 3138 2407; fax: +61 7 3138 1804.
E-mail address:r.frost@qut.edu.au(R.L. Frost).
Contents lists available atScienceDirect
Spectrochimica Acta Part A: Molecular and
Biomolecular Spectroscopy
edge-sharing. Hydroxyl and fluorine occur in a largely ordered dis-tribution among two different structural sites and occupy alternat-ing positions along ‘channels’ parallel to D. The mineral is related to the mineral wagnerite Mg2PO4F[11–14]. Wagnerite may be
con-sidered the fluorine end-member and althausite, the hydroxyl end member. Another mineral, which is chemically closely related to althausite, is holtedahlite Mg2PO4OH[15]. Althausite has some
for-mal structural features in common with the minerals libethenite– olivenite–adamite–eveite–andalusite, in that they contain similar cation polyhedra with 5- and 6-coordination and the same kind of edge-sharing octahedral chains[12,16]. Complex phase relation-ships exist in the MgO–P2O5–H2O system[11].
Raman spectroscopy has proven most useful for the study of mineral structures. The objective of this research is to report the Raman and infrared spectra of althausite and to relate the spectra to the molecular structure of the mineral. This is the first report of a systematic study of the mineral althausite from Brazil.
Experimental
Samples description and preparation
The althausite sample studied in this work was collected from Minas Gerais[1], at the Sapucaia pegmatite mine, about 50 km east–southeast of Govenador Valdares. The sample was incorpo-rated to the collection of the Geology Department of the Federal University of Ouro Preto, Minas Gerais, Brazil, with sample code SAC-024.
Scanning electron microscopy (SEM)
Experiments and analyses involving electron microscopy were performed in the Center of Microscopy of the Universidade Federal de Minas Gerais, Belo Horizonte, Minas Gerais, Brazil (http://www.microscopia.ufmg.br). Althausite crystal cleavage fragment was coated with a 5 nm layer of evaporated Au. Second-ary Electron and Backscattering Electron images were obtained using a JEOL JSM-6360LV equipment.
Raman microprobe spectroscopy
Crystals of althausite were placed on a polished metal surface on the stage of an Olympus BHSM microscope, which is equipped with 10, 20, and 50 objectives. The microscope is part of a
Renishaw 1000 Raman microscope system, which also includes a monochromator, a filter system and a CCD detector (1024 pixels). The Raman spectra were excited by a Spectra-Physics model 127 He–Ne laser producing highly polarized light at 633 nm and col-lected at a nominal resolution of 2 cm 1 and a precision of
± 1 cm 1 in the range between 200 and 4000 cm 1. Repeated
acquisitions on the crystals using the highest magnification (50) were accumulated to improve the signal to noise ratio of
the spectra. Raman spectra were calibrated using the 520.5 cm 1
line of a silicon wafer. The Raman spectrum of at least 10 crystals was collected to ensure the consistency of the spectra.
Infrared spectroscopy
Infrared spectra were obtained using a Nicolet Nexus 870 FTIR spectrometer with a smart endurance single bounce diamond ATR cell. Spectra over the 4000–525 cm 1 range were obtained
by the co-addition of 128 scans with a resolution of 4 cm 1and a
mirror velocity of 0.6329 cm/s. Spectra were co-added to improve the signal to noise ratio.
Spectral manipulation such as baseline correction/adjustment and smoothing were performed using the Spectracalc software package GRAMS (Galactic Industries Corporation, NH, USA). Band component analysis was undertaken using the Jandel ‘Peakfit’ soft-ware package that enabled the type of fitting function to be se-lected and allows specific parameters to be fixed or varied accordingly. Band fitting was done using a Lorentzian–Gaussian cross-product function with the minimum number of component bands used for the fitting process. The Gaussian–Lorentzian ratio was maintained at values greater than 0.7 and fitting was under-taken until reproducible results were obtained with squared corre-lations ofr2greater than 0.995.
Results and discussion
Vibrational spectroscopy background
In aqueous systems, the Raman spectra of phosphate oxyanions show a symmetric stretching mode (
m
1) at 938 cm 1, anantisym-metric stretching mode (
m
3) at 1017 cm 1, a symmetric bendingmode (
m
2) at 420 cm 1and am
4bending mode at 567 cm 1[17– 19]. Ross in Farmer listed some well-known minerals containing phosphate which were either hydrated or hydroxylated or both [20]. The vibrational spectrum of the dihydrogen phosphate anion has been reported by Farmer[20]. The PO2symmetric stretchingmode occurs at 1072 cm 1 and the POH symmetric stretching
mode at 878 cm 1. The POH antisymmetric stretching mode
was found at 947 cm 1 and the P(OH)
2 bending mode at
380 cm 1. The band at 1150 cm 1 was assigned to the PO 2
anti-symmetric stretching mode. The position of these bands will shift according to the crystal structure of the mineral.
The vibrational spectra of phosphate minerals have been pub-lished by Farmer’s treatise Chapter 17 [20]. Table 17.III in Ref. [20] reports the band positions of a wide range of phosphates and arsenates. The band positions for the monohydrogen phos-phate anion of disodium hydrogen phosphos-phate dihydrate is given as
m
1 at 820 and 866 cm 1,m
2 at around 460 cm 1,m
3 as 953,993, 1055, 1070, 1120 and 1135 cm 1,
m
4 at 520, 539, 558,
575 cm 1. The POH unit has vibrations associated with the OH
spe-cie. The stretching vibration of the POH units was tabulated as 2430 and 2870 cm 1, and bending modes at 766 and 1256 cm 1.
Water stretching vibrations were found at 3050 and 3350 cm 1.
The position of the bands for the disodium hydrogen phosphate is very dependent on the waters of hydration. There have been sev-eral Raman spectroscopic studies of the monosodium dihydrogen phosphate chemicals[21–25].
Vibrational spectroscopy
The Raman spectrum of althausite over the 100 to 4000 cm 1
spectral range is illustrated inFig. 1a. This figure shows the peak position and the relative intensities of the Raman bands. It is noted there are large parts of the spectrum where no intensity is ob-served and therefore, the spectrum is subdivided into sections based upon the types of vibration being studied. The infrared spec-trum of althausite over the 500–4000 cm 1spectral range is
re-ported in Fig. 1b. This figure shows the position and relative intensities of the infrared bands. There are large parts of the infra-red spectrum where little or no intensity is observed. Hence, the spectrum is subdivided into sections based on which bands are being studied.
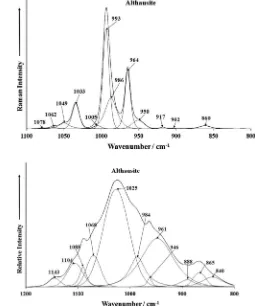
The Raman spectrum of althausite over the 800 to 1200 cm 1
is expected to have interactions between the phosphate and hydro-xyl units. This means that HOPO3
3 units will form. Raman bands
are observed at 964, 986 and 993 cm 1. It is proposed that these
three bands are attributed to the PO stretching vibrations of HOPO3
3 , PO34 and H2PO4units.
According to Roemming and Raade[10], the phosphate units in the crystal structure of althausite are not equivalent and the inter-action with the hydroxyl or fluorine units will be different, so it is not unexpected that a number of phosphate stretching vibrations would be observed.
Galy [23] first studied the polarized Raman spectra of the H2PO4 anion. Choi et al. reported the polarization spectra of
NaH2PO4 crystals. Casciani and Condrate [26] published spectra
on brushite and monetite together with synthetic anhydrous monocalcium phosphate (Ca(H2PO4)2), monocalcium dihydrogen
phosphate hydrate (Ca(H2PO4)2H2O) and octacalcium phosphate
(Ca8H2(PO4)65H2O). These authors determined band assignments
for Ca(H2PO4) and reported bands at 1012 and 1085 cm 1as POH
and PO stretching vibrations, respectively. The three Raman bands at 1033, 1049 and 1062 cm 1are attributed to both the HOP and
PO antisymmetric stretching vibrations. Casciani and Condrate [26]tabulated Raman bands at 1132 and 1155 cm 1and assigned
these bands to P-O symmetric and the P-O antisymmetric stretch-ing vibrations. It is proposed that the proton on the hydroxyl units is very liable and can oscillate between the OH units and the phos-phate units. In this way the hydrogen phosphos-phate units are formed. The low intensity Raman bands at 968 and 988 cm 1are ascribed
to the hydroxyl deformation modes of the OH units in the althau-site structure.
The infrared spectrum of althausite is shown in Fig. 2b. This infrared spectrum shows even greater complexity than the Raman spectrum (Fig. 2a). The infrared spectrum may be band component analyzed into component bands. The infrared bands at 932, 976 and 1002 cm 1 are assigned to the PO stretching vibrations of
the HOPO3
3 , PO34 and H2PO4 units. The three infrared bands at
1031, 1066 and 1135 cm 1 are assigned to the antisymmetric
stretching vibrations of these units.
The Raman spectra of althausite in the 400 to 700 cm 1and 100
to 400 cm 1spectral range are displayed inFig. 3. The spectrum in Fig. 3a may be subdivided into sections. (a) the bands at around 589 cm 1 (b) the bands in the 439 to 503 cm 1 spectral range
and (c) bands in the 312 to 398 cm 1. In addition, there is a low
intensity band at 702 cm 1. The Raman bands observed at 575,
589 and 606 cm 1 are assigned to the
m
4 out of plane bending
modes of the PO4 and H2PO4 units. The Raman spectrum of
NaH2PO4shows bands at 526, 546 and 618 cm 1. The observation
of multiple bands in this spectral region supports the concept of symmetry reduction of both the phosphate and hydrogen phos-phate units. Raman bands at 439, 461, 475 and 503 cm 1 are
attributed to the
m
2 PO4and H2PO4 bending modes. The Ramanspectrum of NaH2PO4 shows two Raman bands at 460 and
482 cm 1. The observation of multiple Raman bands in this
spec-tral region for the althausite mineral supports the concept of sym-metry reduction of the phosphate anion. Strong Raman bands are observed at 312, 346 cm 1with shoulder bands at 361, 381 and
398 cm 1. These bands are assigned to MgO stretching vibrations.
Again, the observation of multiple bands in this spectral region supports the concept of the non-equivalence of phosphate units in the structure of althausite. There are a number of bands in the Fig. 1.(a) Raman spectrum of althausite over the 100 to 4000 cm1spectral range
and (b) infrared spectrum of althausite over the 500 to 4000 cm 1spectral range.
Fig. 2.(a) Raman spectrum of althausite over the 800 to 1400 cm 1spectral range
Raman spectrum of the far low wavenumber region. These bands are ascribed to lattice vibrations.
The Raman spectrum in the 3300 to 3800 cm 1spectral region
is displayed inFig. 4a. The spectral profile is complex with multiple overlapping bands. Raman bands are observed at 3472, 3488, 3500, 3511 and 3523 cm 1. These bands are assigned to the OH
stretch-ing vibrations of the OH units in the althausite structure. From these values, a hydrogen bond distance may be calculated of around 2.94 Å, which is in good agreement with that obtained from XRD data of 2.39 Å[10]. The Raman spectrum over the 1100 to 1400 cm 1spectral range is shown inFig. 5a. No Raman bands at
around 1630 cm 1were observed, thus confirming the absence of
water in the structure of althausite. A broad Raman peak was found at around 1320 cm 1 and a sharper peak at 1130 cm 1 was
observed.
The infrared spectrum of althausite in the 2800 to 3800 cm 1
spectral range is reported inFig. 4b. The spectrum is broad with the main peak observed at 3500 cm 1. There is a long tail on the
low wavenumber side and additional bands may be resolved. These bands may be attributed to the stretching vibrations of the OH units. An additional infrared band at 3679 cm 1is observed.
The infrared spectrum of althausite showed no bands at around 1630 cm 1. This indicates that no water was present (Fig. 5b).
Raade and Tysseland reported the infrared spectrum of althausite in their paper of 1975. They showed a stretching wavenumber for althausite at 3510 cm 1[27]. These workers also synthesised
the mineral analogue of althausite for which some splitting of the infrared bands occurred’ thus indicating the non-equivalence of the OH units in the structure of althausite. Such a concept is strongly supported by our Raman spectra where multiple OH stretching vibrations are observed.
Fig. 3.(a) Raman spectrum of althausite over the 400 to 700 cm 1spectral range
and (b) Raman spectrum of althausite over the 100 to 400 cm 1spectral range.
Fig. 4.(a) Raman spectrum of althausite over the 1900 to 2400 cm 1spectral range
and (b) infrared spectrum of althausite over the 2800 to 3800 cm 1spectral range.
Fig. 5.(a) Raman spectrum of althausite (upper spectrum) in the 1100 to 1400 cm 1spectral range and (b) infrared spectrum of althausite (lower spectrum)
Conclusions
Althausite is one of many phosphate minerals found in granitic pegmatites. However, this particular phosphate mineral of formula Mg2(PO4)(OH,F,O) is an anhydrous mineral in which no water is
present in the mineral formula. Whilst the color of the mineral var-ies and is probably a function of the mineral origin, the mineral is often black or bluish black. Thus, it might be expected that the mineral might be difficult to measure its Raman spectrum; how-ever this is not the case and the Raman spectra are readily obtained.
The mineral is a typical phosphate and Raman and infrared bands are attributed to HOP and PO bending and stretching vibra-tions of the HOPO3
3 and PO34 units. The Raman spectrum of
alt-hausite shows multiple bands attributable to the OH units. At least four bands are observed, thus indicating the non-equivalence of the OH units in the althausite structure. The infrared spectrum displays a broad band centered upon 3500 cm 1. Vibrational
spec-troscopy enables aspects of the molecular structure of althausite to be assessed.
Acknowledgments
The financial and infra-structure support of the Discipline of Nanotechnology and Molecular Science, Science and Engineering Faculty of the Queensland University of Technology, is gratefully acknowledged. The Australian Research Council (ARC) is thanked for funding the instrumentation. The authors would like to acknowledge the Center of Microscopy at the Universidade Federal de Minas Gerais (http://www.microscopia.ufmg.br) for providing the equipment and technical support for experiments involving electron microscopy. R. Scholz thanks to CNPq – Conselho Nacional de Desenvolvimento Científico e Tecnológico (Grant Nos. 306287/ 2012-9).
References
[1]M. Baijot, F. Hatert, S. Philippo, Can. Mineral. 50 (2012) 1531–1554. [2]T.J. Campbell, W.L. Roberts, Mineral. Rec. 17 (1986) 237–254.
[3]F. Cech, Z. Johan, P. Povondra, Notes et Memoires du Service Geologiques (Morocco) 32 (1972) 121–128.
[4]A.M. Fransolet, Notes et Memoires du Service Geologiques (Morocco) 35 (1974) 137–143.
[5]J.D.R. Hirson, An. Acad. Bras. Cienc. 37 (1965) 471–475. [6]P. Keller, Aufschluss 25 (1974) 577–591.
[7]P. Keller, Neues Jahrb. Mineral. (1980) 49–56.
[8]P.B. Leavens, T.A. Simpson, Mineral. Rec. 6 (1975) 64–73. [9]I.R. Plimer, I.D. Blucher, Mineral. Mag. 43 (1979) 505–507. [10]C. Roemming, G. Raade, Am. Mineral. 65 (1980) 488–498.
[11]F. Brunet, C. Chopin, F. Seifert, Contrib. Mineral. Petrol. 131 (1998) 54–70. [12]G. Raade, Neues Jahrb. Mineral. (1990) 289–300.
[13]A. Coda, G. Giuseppetti, C. Tadini, Atti della Accad. Naz. Lin. 43 (1967) 212–224. [14]L. Ren, E.S. Grew, M. Xiong, Z. Ma, Can. Mineral. 41 (2003) 393–411. [15]G. Raade, M.H. Mladeck, Lithos 12 (1979) 283–287.
[16]G. Raade, C. Roemming, Z. Kristallogr. 177 (1986) 15–26.
[17]R.L. Frost, W. Martens, P.A. Williams, J.T. Kloprogge, Mineral. Mag. 66 (2002) 1063–1073.
[18]R.L. Frost, W.N. Martens, T. Kloprogge, P.A. Williams, Neues Jahrb. Mineral. (2002) 481–496.
[19]R.L. Frost, P.A. Williams, W. Martens, J.T. Kloprogge, P. Leverett, J. Raman Spectrosc. 33 (2002) 260–263.
[20] V.C. Farmer, Mineralogical society monograph 4: The Infrared Spectra of Minerals, London, 1974.
[21]C.E. Bamberger, W.R. Busing, G.M. Begun, R.G. Haire, L.C. Ellingboe, J. Solid State Chem. 57 (1985) 248–259.
[22]B.K. Choi, M.N. Lee, J.J. Kim, J. Raman Spectrosc. 20 (1989) 11–15. [23]A. Galy, J. Phys. Radiat. 12 (1951) 827.
[24] H. Poulet, N. Toupry-Krauzman, in: Proc. Int. Conf. Raman, Spectrosc. 6th, 2 (1978) 364–365.
[25]N. Toupry-Krauzman, H. Poulet, M. Le Postollec, J. Raman Spectrosc. 8 (1979) 115–121.
[26] F.S. Casciani, R.A. Condrate, Sr., in: Proc. Int. Congr. Phosphorus Compounds, 2nd (1980) 175–190.