No. 28 Vol.1 Thn. XIV November 2007 ISSN: 0854-8471
TeknikA
21
ON THE HOLED PLATE UNDER TENSION LOAD
Sabril Haris HG
Laboratorium Material dan Struktur, Jurusan Teknik Sipil, Universitas Andalas
ABSTRACT
Two types of holed plate subjected tension load are examined by using Abaqus numerical software for non linear calculation. The absence of the element around the hole becomes the interesting issues such as the effective area and the stress concentration. In this paper, variations on diameter of hole and stress-strain curve based on Voce’s law are investigated regarding the plate response in the elastic and plastic region. The maximum load from the numerical work is compared by the analytical result and a good agreement is obtained.
1. INTRODUCTION
The holed plate subjected tension load will have experience the phenomena called by stress concentration due to the absence of the elements around the hole. This increasing stress makes those element will attain yield stress first meanwhile the others are still in the elastic region. Since the yielding process occurred, it will affect the response of the whole plate because yielding elements now have the less stiffness regarding in the plastic state.
The subject of this paper is to observe the stress concentration on the holed plate by using the nonlinear software Abaqus. Two types of holed plate are subjected static monotonic load until the ultimate condition reached. A detailed analysis of this simulation is presented in view of the yielding in the elements around the hole and the propagation process to the others.
Several aspects are discussed, such as response in the elastic region that comprises determination of first yield-load and significant yield-load, and response in the plastic region that covers ultimate conditions of plate. Furthermore, the effect of diameter of hole and parameter of stress-strain curve material model are also analyzed.
2. DESCRIPTION OF MODEL
2.1 Dimension of Plate
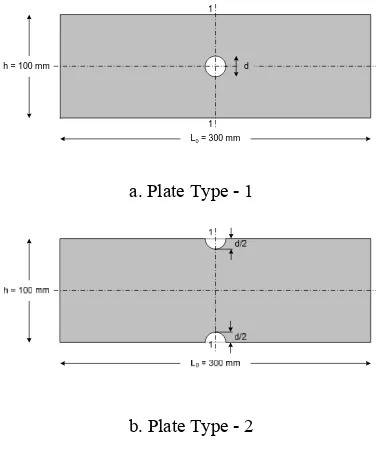
There are two types of plate that will be used in this simulation. The first is plate with one hole in the center of plate and the other is plate with two-half hole in the out-fiber side.
Dimension of plates are fixed for all of the models. They are the length of plate L0 = 300 mm,
the width of plate h = 100 mm, and plate thickness t = 10 mm. Then, the full cross section area A0 can be
calculated as 1000 mm2.
Diameter of hole (d) are varied for d = 0, 10, 20, and 30 mm. So, for d = 0 mm, plate 1 and type-2 are identical.
For both types, in the cross section 1-1, area of plate is defined as the net area (Anet) which is
calculated as Anet = t (h - d). The models are shown
in Fig. 1.
a. Plate Type - 1
b. Plate Type - 2
Figure 1 Types of Plate
2.2 Material
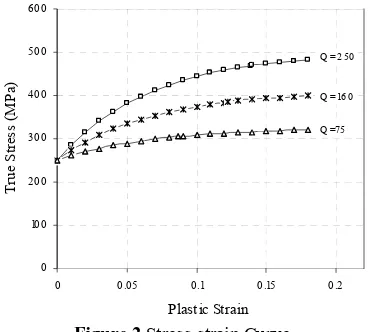
Material used in this paper is the mild steel grade 41, which is widely used in many steel structures with yield stress σy = 250 MPa. In order to define
the input to Abaqus, Voce’s law [1] is used to construct stress-strain curve for the material characteristic. This formula is shown in Eq. (1).
(
-C.ε)
0
σ = σ + Q 1 - e (1)
Base on some experimental data of uniaxial tensile test [2,3], basic parameter in Eq. (1) determined as follows:
σ0 = 250 MPa
Q = 250 C = 15 h = 100 mm
L0= 300 mm
d 1
10 varied constan maximu and then Piec stress-s
Elas used fo follows von Mi
2.3 Mo
By solid w handle hole, fin
2.4 Loa
The is subje the othe unexpec effect, t are rele Stat for some valu nt. Plastic strai
um value 0.18 n stress values cewise-linear r train are obtain
Figure 2
stic modulus E or Poisson’s rat
s isotropic hard ses criterion fo
deling
using Abaqus which is regular
stress concen ner meshing el
Figure 3
ading Conditio
e tension loadin ected the unifo er side becom cted additiona the vertical and eased unless the tic monotonic
0.1
Plastic Strain strain-stress cu ue, i.e. 75 and n data are set 8 with uniform s are generated relationships fo ned as well as
Stress-strain C
E is 200000 M tio (μ). For the dening for wor or the effective
software, pla rly meshed as s ntration at the lements are cho
Element Mes
on
ng conducted i orm load in th mes the fixed su
al stress rega d lateral fixatio e nodes in the m
loading are su
0.15 0.2 m increment 0
by Voce’s law for three types
shown in Fig. 2
Curve
MPa while 0.3 e yield surface rk hardening a e stress.
ate is modeled shown below.
area around t osen.
shing
in this simulati he one side wh upport. To avo arding Poisson ons in the supp
middle one. ubjected until t
be
RESPONSE REGION
For two types o holes (d) and p ss relationship ysis is observa ond one is in th
Effective Area
Loading the p tic response ween load and d Elastic respon mula:
σ = E . ε
For uni-axial te divided by the ned as the e ded by the leng er to use initi
for the conditio Replacing σ by
F = k ΔL
Eq. (3) shows
ΔL by the stiff Differences of to the hole, bo he hole, theref effective area that fulfills Eq Aeff / L0
From the load h model, the
arization in th nning curve a ation of load-d eved by using lts shown in Ta
Tab
Difference valu s not influence
in the elastic re It is interestin
Plate Type d
No Hole
Type 1
Type 2
OF PLATE IN
of plate, variat parameter Q i ps are obser ation in the el he plastic region
a
plate for small denoted by displacement. nse of the str
ension σ can be cross section a elongation or gth of the plat ial dimension on in this elast y F/A0 and ε by
; where k =
the linear rela fness k = E A0
cross section oth for two typ fore it is neces
(Aeff) instead
q.(3). The stiffn
d-displacement stiffness k is he elastic part
are taken to c displacement.
the formula. A able 1.
ble 1 Effective
ue of Q in the e the result sinc
egion
ng then to fin d (mm) k
0 666.6 10 661.5 20 645.7 30 618.6 10 661.2 20 645.5 30 621.0
N THE ELAS
tion on the dia in the stress s rved below. astic region an n.
l deformation linear relatio
ructures meet
e defined as th area. Meanwhi displacement te. Further then
than instanta tic region. y ΔL/L0, we ge
ationship betw / L0.
area will take pes of plate. Be ssary then to d d of the initia fness then beco
t curve plotte easy to obta . Some data a construct the
Then, Aeff w
Aeff = k L0 / E
Area
e material prop ce the respons
nd the relatio Aeff (mm
667 1000.00 578 992.37 708 968.56 663 927.99 260 991.89 594 968.39 038 931.56
STIC
ameter
strain-First nd the
gives onship
ts the aneous
et:
(3)
ween F
place ecause define l area omes k
ed for ain by at the linear will be
E. The
perties es are
No. 28
the fact plate th3.2 Firs
It is be take observi Abaqus stress d If w uniform can be c
The their nu
No H
Typ
Typ Plate
8 Vol.1 Thn
ional purpose, ized value Aefross sectional a
gure 4 Norma
m the curve in n normalized A
eff tor for the red hat is limited fo
st Yield
s widely know en place on the
ng the stress s simulation, w due to that phen we assumed t m, the load that calculated as th
Fyield = Aeff .
e yield-load va umerical results
Table 2
Hole 0
area for no hol
alized Effective
n Gig.4, we ge duction area du or this study.
wn that stress c e element arou values whic we can see the
nomenon. the stresses on
t generates firs he formula in E
σyield
alues calculated s are shown in
2 First Yield Lo
formula n 250.000
ember 2007
re replaced byrespectively. A e plate.
e Area vs d/h
et the relationsh ter of hole as:
(
(d/h)2 in Eq.4 ue to hole in t
oncentration w und the hole. ch get from t
increasing of t
n the plates a st yielding (Fyi
Eq. (5). 153.125 1. 125.075 1. 106.525 2. 155.750 1. 128.400 1. 115.125 2. kN) Table 2 gives centrations occ need the small greater diame ss concentratio ds for plate type h the same diam The stress conc wn in Fig. 5.
Figure
Significant Yie ve
The load that lted from num e after that poi rly linear. The e
lement around nge the stiffnes Significant yi tional load. T ificant-yield ched. First line ore the significa esents some da instance, for p meter and Q = curs due to hol lest load to ach eter we have, on we get. It c e 2 are greater meter of hole.
centration for b
a.Plate Typ
b.Plate type
5 Stress Conc
eld on The Lo
t generates fi merical result int the respons effect of local d the hole, is ss of the structu ield point c To calculate
load, two e represents the
ant point as we ata just after th plate type 1 w
250, the sign the first yield
re 6 Significan
SSN: 0854-8
ormation that le on the plate hieve the first the higher ra can be also seethan for plate t
both types of p
e-1
e-2
entration
oad-Displacem
irst yielding ( is not mean se of the plate i
yielding at the not significan ure.
comes after the value of straight lines e data on elasti ell as the secon he significant with 20 mm in
nificant-yield lo is 125.075 kN
nt Yield
8471
stress e sinceSignificant-yield loads for different value of Q are almost same because the effect of hardening which occur in some of element around the hole is still in the beginning of hardening (in the small strain). As shown in Fig. (2), in the beginning of material hardening, the difference between varied Q is small. It can be seen in the Fig. (7.c) and (7.d).
4. RESPONSE OF PLATE IN THE PLASTIC
REGION
4.1 Yield Propagation
To observe the response of plate in the plastic region, it is beneficial to spot the load-displacement curve on the part after significant yield point. The load displacement curves for two types of plate
those vary on of diameter of hole as well as variation on Q respectively are shown in Fig. (7).
Plate type 1 with one hole in the center of plate, in general, has less significant-yield load than plate type 2 with two-half hole in the out fiber side. It is agree with the load at the first yielding (Table 2).
As shown in Fig. (7.a) and (7.b), for both type, the greater diameter of hole will make the stiffness of the load-displacement curve decrease faster. From the curves, the smooth rounding path is created after significant-yield point until reach the stage with nearly linear as the new stiffness of the plate. The greatest diameter is always positioned on the lowest curve.
a. Plate Type 1, variation on d, Q = 250 b. Plate Type 2, variation on d, Q = 250
c. Plate Type 1, variation on Q, d = 20 mm d. Plate Type 2, variation on Q, d = 20 mm
Figure 7 Load-displacement Curve for Two Types of Plate
Yield propagation can be analyzed from the shape of the plate. For plate type 1, on the holed-cross section, area of plate is divided into two parts, the upper and the lower. The distance from the corner to the out-fiber is (h-d)/2 for both parts. For plate type 2, on the holed-cross section, there is only one area of plate from upper-hole side to lower-hole side and the distance is (h-d). So, propagation model for plate type 2 produce the greater value of load
than plate type 1. Yield propagation for both type of plate follows the grey-black contour as shown in Fig. (8).
a. Plate Type 1
100 150 200 250 300 350
0 2 4 6 8
displacement (mm)
L
o
ad
(
k
N
)
d = 0 mm (no hole)
d = 10 mm
d = 20 mm
d = 30 mm
100 150 200 250 300 350
0 2 4 6 8
displacement (mm)
L
o
ad
(
k
N
)
d = 0 mm (no hole)
d = 10 mm
d = 20 mm
d = 30 mm
10 0 150 2 0 0 2 50 3 0 0
0 0 .5 1 1.5 2
displacement (mm)
L
o
a
d
(
k
N
)
Q = 250
Q = 160
Q = 75
100 150 200 250 300
0 0.5 1 1.5 2
displacement (mm)
L
o
ad
(
k
N
)
Q = 250
Q = 160
No. 28
Figure
As effect t the sign after th Q.
4.2 Ma
The = 0. It c the cros
Diffuse
Applyin
Tensile defined
Aga hole, as The numeric simulat are defi the hole as (σu).
mentioned be to the load-dis nificant-yield r at point that is
ximum Load
e maximum loa can be attained ss section with
e necking for th
dσ
s mentioned pr ese analytical r
cal ones whic tion. Maximum fined when the
e, reaches the
Table 3 it is er of hole d = 2
n. XIV Nove
Plate Type 1
agation for Tw
efore, variation splacement cur
reached. The d s proportional w
ad in the plate d when diffuse hole (section
hese cases lead
and maximum
area in the cr eviously. results will be ch are obtaine m load from n e critical point
true uniform s
s shown that 20 mm or Anet =
ember 2007
wo Types of Pla
n on Q has l rve of plate af differences occ with the value
defined when necking occur 1-1 in Fig. 1.).
ross section w
compared to t ed from Abaq numerical resu , element arou strain (εu) as w
the results = 800 mm2.
There are som lts and the nu 1 and Q = 2 y close each oth anwhile, for the h differences le
ONCLUSION
Numerical wor es which are s in the beginni ne the stiffnes responses in th effective area ameter Q in th
ple relationship the effective ur around the h fness of the str d attained. Max determined fr ws a good agre
FERENCES
T.Beylytschko finite elemen Wiley, 2000. R.Tornqvist, Structures, Ph Denmark, 200 Civil Engin University of 2007.
IS
le 3 Maximum
me variation umerical ones. 250 - plate typ her with differ e others, the re
ss than 10 %.
N
rks have been subjected the ng of the elast ss of the struct
he elastic regio in the cross se he Voce’s law p between the
one is propos hole is not signi ructures until t ximum load for rom the num ement with the
o, W.K.Liu an nts for contin
Design of hD Thesis, Tec 03.
neering Mate f Mexico, Ten
SSN: 0854-8
m Loadbetween anal For Q = 75 -pe 2, the resul ences less than esults are quite
done for the tension load. ic region are u tures. It is obt on are determin ection. The eff w is immateri e full cross s sed. The first ificant to chan the significant r the holed pla merical work w
e analytical res
d Moran, Non nua and struc
Crashworthy hnical Univers
erials Labor nsile Test of
8471
lytical - plate tained ned by fect of ial. A ection
yield ge the t-yield ate can which sult.
nlinear ctures,
Ship sity of