DNA markers for eating quality of indica rice in Indonesia
P
U J IL
E S T A R I1,2, W
E N Z H UJ
I A N G3, S
A N G- H
OC
H U1,4, R
E F L I N U R2, S
U T R I S N O2, B
R A MK
U S B I A N T O R O5,
B
A C K K IK
I M1, R
I H U AP
I A O1, Y
O U N G- C
H A NC
H O6, Z
H I X I A N GL
U O7, J
O O N G- H
Y E O NC
H I N4and
H
E E- J
O N GK
O H1,8 1Department of Plant Science and Research Institute for Agriculture and Life Sciences, Plant Genomics and Breeding Institute, Seoul
National University, Seoul, 151-921, Korea;
2Indonesian Center for Agricultural Biotechnology and Genetic Resources Research and
Development, Jl. Tentara Pelajar 3A, Bogor, 16111, Indonesia;
3Jilin University, Changchun, Jilin Province 130062, China;
4Plant
Breeding, Genetics, and Biotechnology Division, International Rice Research Institute, DAPO 7777, Metro Manila 1301, Philippines;
5Indonesian Center for Rice Research, Jl. Raya No. 9 Sukamandi, Subang, Indonesia;
6National Institute of Crop Science, RDA,
Suwon, 441-100, Korea;
7Rice Research Institute, Anhui Academy of Agricultural Science, Hefei, Anhui 230001, China;
8Corresponding author, E-mail: [email protected]
With 1 figure and 6 tables
Received May 22, 2014/Accepted October 14, 2014
Communicated by Z.-K Li
Abstract
Rice eating quality is considered to be one of the top priorities in deter-mining the agronomical value of rice; thus, the rapid evaluation of eating quality at early breeding generations in breeding programmes for better eating quality is of great importance. In an attempt to develop DNA markers associated with eating quality of indica rice, we used multiple regression analysis to test 54 markers, which were preselected for their possible association with eating quality, using 24 indica varieties with different palatability scores. Of these markers, eighteen markers were found to be significantly associated with palatability according to sensory evaluation. Accordingly, a marker set in the model regression equation with a highR2(0.997) was formulated to estimate indica rice palatability. Validation suggests that markers and the statistical parameters formulated by the equation could be a potential tool to predict the palatability of cooked Indonesianindicarice and could be reliable in developing coun-try-dependent model equations for eating quality.
Key words:
eating quality
—
indica rice
—
regression analysis
Eating quality is the most important end-use trait of cooked rice.
Consequently, taste preferences become increasingly important
for utilizing and selecting rice varieties especially for consumers
in rice-producing countries. Rice grain features diverse
physico-chemical properties, such as starch quality, which is major
deter-minant of the eating and cooking properties for different
varieties (Allahgholipour et al. 2006). Among such properties,
amylose content (AC), which also contributes significantly to the
pasting property that can be measured with such instrumentation
as RVA (Rapid Visco Analyser), is an important determinant of
the eating, cooking and processing quality of rice. Total protein
content in grain also affects the palatability of cooked rice (Yu
et al. 2008), reflecting the complex interplay of numerous traits
defining rice eating quality, which is a critical component of
breeding programmes. In addition to genetic factors involved in
the synthesis of starch and protein, rice eating quality is also
lar-gely affected by environmental factors, cultural practices and
postharvest practices such as air temperature during ripening, the
amount of fertilizer, irrigation management, grain-drying after
harvest and cooking methods (Izumi et al. 2007).
While japonica rice is mostly grown and consumed in
north-eastern Asian countries, indica rice is cultivated worldwide,
including south-eastern Asian countries. Indica rice is generally
characterized by its higher amylose content and long grains; it is
bland, flaky, firm and fluffy when cooked (Kim and Rhee
2004). The textural difference between indica and japonica rice
cannot be explained only by the relative amylose content and
gelatinization temperature. The stickiness of cooked rice is
lar-gely correlated with the sucrose content and the amount of
short-chain amylopectin fraction, which, in turn, is inversely
pro-portional to the amount of amylose in the surface layer of
cooked rice extract. Once eluted from the rice during cooking,
these components are then absorbed into the surface layer,
giv-ing it a sticky quality (Hatae et al. 2004).
The sensory test, the fundamental test of eating quality,
pro-vides information on appearance, aroma, taste, hardness,
sticki-ness and overall quality. Estimation of rice palatability has been
mainly accomplished by utilizing sensory evaluation as well as
chemical analysis, even though these methods have some
pit-falls. The chemical method is costly and time-consuming,
whereas the sensory evaluation can be hampered by high
vari-ability resulting from the subjective judgment of the panel
mem-bers
(Azuma
et al.
1994).
Physicochemical
properties
determining eating quality of rice can be measured with a
smal-ler amount of rice than that required for the sensory test. Some
studies on mathematical models for predicting eating quality of
rice from physicochemical properties have also been reported.
However, it is still difficult to predict eating quality of rice by
these models. Moreover, the taste instrument to determine eating
quality of cooked indica rice is less precise. Thus, it is essential
to develop a method that can estimate indica rice eating quality
with low cost and improved speed, simplicity and precision.
et al. 2011) as well as between japonica and indica cultivars
(Li et al. 2003, Takeuchi et al. 2007, Wan et al. 2007) have been
excellent sources for marker development.
Progress in the development of molecular markers related to
rice eating quality has been achieved through genetic and
molecu-lar marker-based QTL analyses, and genomic database searches.
Some SSR (simple sequence repeat), SNP (single nucleotide
poly-morphism) and STS (sequence-tagged site) markers for
starch-synthesizing genes have been developed in this way (He et al.
2006, Zeng et al. 2007, Bao et al. 2008). Other STS markers that
were obtained by transformation of random amplification of
poly-morphic DNA (RAPD) markers have been used to differentiate
japonica varieties, particularly the superior Japanese variety,
Koshihikari (Ohtsubo et al. 2002, 2003, Ohtsubo and Nakamura
2007). These markers were also useful for evaluating the
palat-ability of japonica varieties, so several studies have used them to
predict eating quality (Ohtsubo et al. 2003, Nakamura et al. 2004,
Lestari et al. 2009). However, DNA-marker-based evaluation for
eating quality in indica rice has not been reported yet.
In this study, the eating quality of indica rice originating from
Indonesia was estimated by sensory test and physicochemical
property assays. New molecular markers associated with the
eat-ing quality of indica rice were then identified and compiled with
previously reported markers to be used for a genotyping test.
Thus, by defining physicochemical properties and molecular
markers correlated with the palatability of
indica
rice, this study
aimed at initially establish a formulated set of methods to
evalu-ate overall eating quality of cooked rice in indica varieties.
Materials and Methods
Plant materials and DNA extraction:In this study, we used a total of 24 indica rice varieties and 23 local accessions, originating from Indonesia and had diverse palatability. All varieties were grown using national recommended cultural practices at the experimental farm of Indonesian Center for Rice Research, Sukamandi, Indonesia, during the dry season from March to October. Rice grains used for physicochemical analysis were dried to 15% moisture content. For DNA extraction, all rice varieties were grown in a well-controlled greenhouse until the tillering stage. The healthy and young leaf tissues were harvested and collected. Genomic DNA was extracted using cetyl trimethylammonium bromide (CTAB).
Development of molecular marker: Analysis of nucleotide polymorphisms in the sequences among japonica and indica cultivar groups was performed to develop primers for eating quality. Additionally, we searched genomic databases to identify potential candidate genes from which to develop markers in this study (Table 1). PRIMER3 software facilitated by http://www.biotools.umassmed.edu/bioapps/primer3_www. cgi was used for primer design. The amplified bands were purified, TA-cloned and sequenced using an ABI 3700 DNA sequencer following the manufacturer’s instructions (Applied Biosystems, Foster City, CA, USA). To identify SNPs, indels (insertions and deletions) and/or microsatellites among rice varieties, the sequence results were aligned using EMBL-European Bioinformatics Institute Clustal W program (Thompson et al. 1994) (http://www.ebi.ac.uk/tools), assisted with CodonCode Aligner 1.3.4 (CodonCode Corporation, Dedham, MA, USA) and BioEdit (http://www.mbio.ncsu.edu/BioEdit/bioedit.html). To detect one base substitution in the specific fragment, a dCAPS primer was designed facilitated by dCAPS Finder 2.0 (http://helix.wustl.edu/dcaps). Previously reported markers (He et al. 2006, Zeng et al. 2007, Kobayashi et al. 2008) and some selected markers included in the marker sets comprising 13 and 14 markers in the regression equation for the evaluation of japonica rice eating quality (Lestari et al. 2009) were also utilized for analysis in this study. The list of markers previously reported and their sequences is presented in Table 1.
PCR amplification and sequencing: Standard PCR for further sequencing analysis using ExTakara Taq polymerase (Takara, Tokyo, Japan) was carried out in a PTC-200 Peltier Thermal Cycler (Bio-Rad, Hercules, CA, USA) in a total reaction volume of 50ll. The amplifications were performed under the condition of 35 cycles of 1 min at 95°C, 30 s at 55°C and 1 min at 72°C. PCR amplification of DNA
using the selected primers was performed in a total volume of 20ll with the following PCR reagents: 2ll of DNA at 20 ng/ll, 2ll of 10X buffer containing 25 mM MgCl2, 1ll of 2.5 mM dNTPs, 1 U of Taq
Polymerase (Intron Biotechnology, Seoul, Korea), and 1ll each of forward and reverse primers (10lM). The PCR amplifications were performed for a total of 35 cycles of 1 min at 95°C, 30 s at 55°C and
1 min at 72°C. Amplified PCR products were analysed by
electrophoresis on 3% agarose gels stained with ethidium bromide and/or by non-denaturing electrophoresis on 8% polyacrylamide gels stained with ethidium bromide (Model MGV-202-33, CBS Scientific Co., Del Mar, CA, USA).
Evaluation of eating quality traits:For physicochemical analysis, the rice grains were hulled and milled to the yield of 91%. PC was calculated by total nitrogen multiplied by 5.95 after determining the nitrogen content of rice material using the micro-Kjeldahl method (AOAC 1995). The AC of milled rice was determined by the relative absorbency of starch–iodine colour in digested solution of 100-mesh rice flour by the method of Perez and Juliano (1978). RVA pasting properties were determined on a Rapid Visco Analyser (RVA) in accordance with the operation manual (Newport Scientific, Warriewood, Australia). Rice starch paste profile characteristics were described by six parameters, peak viscosity (PV), hot paste viscosity (HPV), cool paste viscosity (CPV), breakdown viscosity (BDV=PVHPV), setback viscosity
(SBV=CPVPV) and consistency viscosity (CTV=CPVHPV),
according to Bao and Xia (1999).
Sensory evaluation of rice varieties:Sensory evaluation of cooked rice samples was conducted by 11 professionally trained panel members (age from 38 to 55 years) with 5 replications at the Indonesian Center of Rice Research, Sukamandi. To produce reliable and valid data, the panellists should be treated as a scientific instrument; therefore, they must be free from mental features and physical conditions which might affect their judgement. All sensory panels must have an ability to conduct the sensory test and to repeat consistently. The overall palatability/eating quality was assessed according to appearance (glossiness), flavour, texture, taste and colour and scored from 1 to 5 (1: unacceptable and 5: excellent). Palatability score by sensory test of each variety was the average value scored by 11 panels. Cooked rice samples were prepared according to the protocol of NICS, Rural Development Administration, Korea. Dry-milled head rice (300 g) was rinsed four times and soaked for 30 min with distilled water and strained from the water for 10 min. Rice was cooked using an electric rice cooker with a ratio of rice water of 1 : 1.25 w/w. After completion of the automatic cooking cycle, the rice was allowed to remain in the cooker for 30 min. Samples were transferred to plates and kept at room temperature for about ten minutes until cooked rice samples cooled down to 35–37°C. The order of sample
was presented randomly but not randomized across panellists due to the importance of serving temperature. Panel performance was monitored for repeatability and discriminative judgement. In this sensory evaluation, we ignored the environmental effect which may contribute to the eating quality. This sensory evaluation was performed at the same procedure for both the formulation of marker set and its validation.
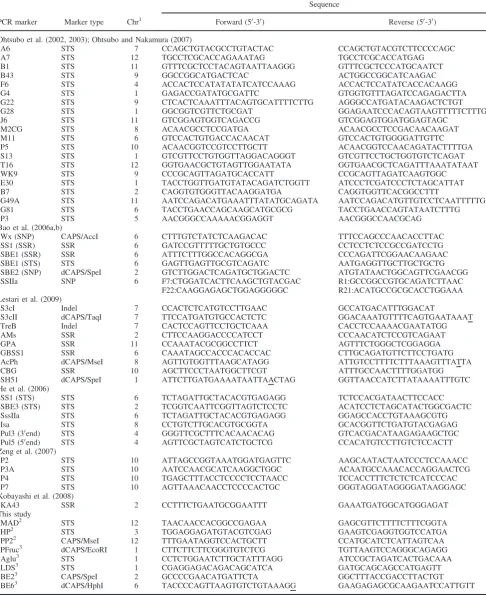
Table 1: List of markers previously reported and developed in this study for evaluation of indica rice eating quality
PCR marker Marker type Chr1
Sequence
Forward (50-30) Reverse (50-30)
Ohtsubo et al. (2002, 2003); Ohtsubo and Nakamura (2007)
A6 STS 7 CCAGCTGTACGCCTGTACTAC CCAGCTGTACGTCTTCCCCAGC
A7 STS 12 TGCCTCGCACCAGAAATAG TGCCTCGCACCATGAG
B1 STS 11 GTTTCGCTCCTACAGTAATTAAGGG GTTTCGCTCCCATGCAATCT
B43 STS 9 GGCCGGCATGACTCAC ACTGGCCGGCATCAAGAC
F6 STS 4 ACCACTCCATATATATCATCCAAAG ACCACTCCATATCACCACAAGG
G4 STS 1 GAGACCGATATGCGATTC GTGGTGTTTAGATCCAGAGACTTA
G22 STS 9 CTCACTCAAATTTACAGTGCATTTTCTTG AGGGCCATGATACAAGACTCTGT
G28 STS 1 GGCGGTCGTTCTGCGAT GGAGAATCCCACAGTAAGTTTTTCTTTG
J6 STS 11 GTCGGAGTGGTCAGACCG GTCGGAGTGGATGGAGTAGC
M2CG STS 8 ACAACGCCTCCGATGA ACAACGCCTCCGACAACAAGAT
M11 STS 6 GTCCACTGTGACCACAACAT GTCCACTGTGGGGATTGTTC
P5 STS 10 ACAACGGTCCGTCCTTGCTT ACAACGGTCCAACAGATACTTTTGA
S13 STS 1 GTCGTTCCTGTGGTTAGGACAGGGT GTCGTTCCTGCTGGTGTCTCAGAT
T16 STS 12 GGTGAACGCTGTAGTTGGAATATA GGTGAACGCTCAGATTTAAATATAAT
WK9 STS 9 CCCGCAGTTAGATGCACCATT CCGCAGTTAGATCAAGTGGC
E30 STS 1 TACCTGGTTGATGTATACAGATCTGGTT ATCCCTCGATCCCTCTAGCATTAT
B7 STS 2 CAGGTGTGGGTTACAAGGATGA CAGGTGGTTCACGGCCTTT
G49A STS 11 AATCCAGACATGAAATTTATATGCAGATA AATCCAGACATGTTGTCCTCAATTTTTG
G81 STS 6 TACCTGAACCAGCAAGCATGCGCG TACCTGAACCAGTATAATCTTTG
P3 STS 5 AACGGGCCAAAAACGGAGGT AACGGGCCAACGCAG
Bao et al. (2006a,b)
Wx (SNP) CAPS/AccI 6 CTTTGTCTATCTCAAGACAC TTTCCAGCCCAACACCTTAC
SS1 (SSR) SSR 6 GATCCGTTTTTGCTGTGCCC CCTCCTCTCCGCCGATCCTG
SBE1 (SSR) SSR 6 ATTTCTTTGGCCACAGGCGA CCCAGATTCGGAACAAGAAC
SBE1 (STS) STS 6 GAGTTGAGTTGCGTCAGATC AATGAGGTTGCTTGCTGCTG
SBE2 (SNP) dCAPS/SpeI 2 GTCTTGGACTCAGATGCTGGACTC ATGTATAACTGGCAGTTCGAACGG
SSIIa SNP 6 F7:CTGGATCACTTCAAGCTGTACGAC R1:GCCGGCCGTGCAGATCTTAAC
F22:CAAGGAGAGCTGGAGGGGGC R21:ACATGCCGCGCACCTGGAAA
Lestari et al. (2009)
S3cI Indel 7 CCACTCTCATGTCCTTGAAC GCCATGACATTTGGACAT
S3cII dCAPS/TaqI 7 TTCCATGATGTGCCACTCTC GGACAAATGTTTTCAGTGAATAAAT
TreB Indel 7 CACTCCAGTTCCTGCTCAAA CACCTCCAAAACGAATATGG
AMs SSR 2 CTTCCAAGGACCCCATCCT CCCAACATCTCCGTCAGAAT
GPA SSR 11 CCAAATACGCGGCCTTCT AGTTTCTGGGCTCGGAGGA
GBSS1 SSR 6 CAAATAGCCACCCACACCAC CTTGCAGATGTTCTTCCTGATG
AcPh dCAPS/MseI 8 AGTTGTGGTTTAAGCATAGG ATTGTCCTTTTCTTTAAAGTTTATTA
CBG SSR 10 AGCTTCCCTAATGGCTTCGT ATTTGCCAACTTTTGGATGG
SH51 dCAPS/SpeI 1 ATTCTTGATGAAAATAATTAACTAG GGTTAACCATCTTATAAAATTTGTC
He et al. (2006)
SS1 (STS) STS 6 TCTAGATTGCTACACGTGAGAGG TCTCCACGATAACTTCCACC
SBE3 (STS) STS 2 TCGGTCAATTCGGTTAGTCTCCTC ACATCCTCTAGCATACTGGCGACTC
SssIIa STS 6 TCTAGATTGCTACACGTGAGAGG GGAGCCACCTGTAAAGCGTG
Isa STS 8 CCTGTCTTGCACGTGCGGTA GCACGGTTCTGATGTACGAGAG
Pul3 (30end) STS 4 GGGTTCGCTTTCACAACACAG GTCACGACATAAGAGAAGCTGC
Pul5 (50end) STS 4 AGTTCGCTAGTCATCTGCTCG CCACATGTCCTTGTCTCCACTT
Zeng et al. (2007)
P2 STS 10 ATTAGCCGGTAAATGGATGAGTTC AAGCAATACTAATCCCTCCAAACC
P3A STS 10 AATCCAACGCATCAAGGCTGGC ACAATGCCAAACACCAGGAACTCG
P4 STS 10 TGAGCTTTACCTCCCCTCCTAACC TCCACCTTTCTCTCTCATCCCAC
P7 STS 10 AGTTAAACAACCTCCCCACTGC GGGTAGGATAGGGGATAAGGAGC
Kobayashi et al. (2008)
KA43 SSR 2 CCTTTCTGAATGCGGAATTT GAAATGATGGCATGGGAGAT
This study
MAD2 STS 12 TAACAACCACGGCCGAGAA GAGCGTTCTTTTCTTTCGGTA
HP2 STS 3 TGGAGGAGATGTACGTCGAG GAAGTCGAGGTGGTCCATGA
PP22 CAPS/MseI 12 TTTGAATAGGTCCACTGCTT CCATGCATCTCATTAGTCAA
PFruc3 dCAPS/EcoRI 1 CTTCTTCTTCGGGTGTCTCG TGTTAAGTCCAGGGCAGAGG
Aglu3 STS 1 CCTCTGGAATCTTGCTATTTAGG ATCCGCTAGATCACTGACAAA
LDS3 STS 1 CGAGGAGACAGACAGCATCA GATGCAGCAGCCATGAGTT
BE23 CAPS/SpeI 2 GCCCCGAACATGATTCTA GGCTTTACCGACCTTACTGT
BE63 dCAPS/HphI 6 TACCCCAGTTAAGTGTCTGTAAAGG GAAGAGAGCGCAAGAATCCATTGTT
1Chr: chromosome location. 2
Markers developed from the candidate genes residing QTL regions identified by Wada et al. (2008): MAD, OsMAD20 MADS box family; HP,
Homeobox domain containing protein; PP2,Phosphoserine phosphatase.
3
study (Lestari et al. 2009), marker data scores were converted to binary values. The best model equation was predicted using palatability scores as dependent variables and the binary data from molecular markers as regressors. The highest accuracy of prediction showed the lowest standard error and significantly highest coefficient of determination (R2). Cluster analysis also was generated with the unweighted pair group method (UPGMA) in NTSYS (Exeter Software, Setauket, NY, USA) (Rohlf 1993).
Results
Development of new markers and marker evaluation
Based on QTL analysis for rice eating quality (Wada et al.
2008), three genes, OsMAD20 MADS box family gene (MAD,
clone AL731752), a Homeobox domain containing protein (HP,
clone AC119747) and a Phosphoserine phosphatase (PP, clone
AP003727), were selected as candidates for the marker
develop-ment. Additionally, by searching the genomics database (DB),
five candidate genes, 6-phosphofructokinase 2 (PFruc, clone
AP002743),
Acyl
UDP-N
acetyltransferase
(Aglu,
clone
AP003453),
Lipid
A
disaccharide
synthase
(LDS,
clone
AP003237), 1.4 alpha-glucan branching enzyme IIB (BE2, clone
AP004879) and 1.4 alpha-glucan branching enzyme (BE6,
AP005763), were chosen due to their involvement in starch
bio-synthesis, suggesting they may play roles in determining rice
starch physicochemical properties. After comparing these gene
sequences in japonica with those of indica varieties (Table 1), a
total of eight DNA markers (STS, CAPS/dCAPS) were
devel-oped (Table 1).
In total, we used 54 markers, which included previously
reported markers (Lestari et al. 2009), plus those identified in
this study for evaluation of indica rice eating quality (Table 1).
Thirty of these markers showed polymorphism among indica rice
varieties. Twenty-four of these were reported previously
(Oht-subo et al. 2002, 2003, He et al. 2006, Oht(Oht-subo and Nakamura
2007, Zeng et al. 2007), including eight markers used for
evalu-ation of japonica rice eating quality (Lestari et al. 2009) and six
markers newly developed in our study (PP2, PFruc, Aglu, LDS,
BE2, HP). The list of candidate genes for QTLs related to rice
rating quality, the search of the genomic database, and the new
primer sequences are presented in Table 1. Some developed
primers were polymorphic both in japonica and in indica
varie-ties, but others showed polymorphism only in japonica varieties.
A number of unique alleles were observed in some rice varieties.
The insertion of CTTT alleles in the Tre locus was rarely found
in indica varieties, similar to the case of japonica rice for the
same allele. In contrast to japonica rice, which is rich in T
alleles in the S3c locus, the T allele was rare in indica and the
occurrence was rather limited to the varieties of low palatability.
On the other hand, Kalimutu, which is considered to be a highly
palatable rice, also showed specific alleles on S3c (G allele) and
PP loci (A allele).
Genotyping and cluster analysis
Not all primers derived from the japonica rice genome showed
polymorphism in indica varieties. Nine of 20 STS primers
reported to be associated with japonica rice palatability in
previ-ous studies (Ohtsubo et al. 2002, 2003, Ohtsubo and Nakamura
2007) demonstrated variation among indica varieties. Some
primers corresponding to the genes including Isa (isoamylase),
Pul3 (pullulanase) and starch-synthesizing genes, SS1 and SBE2
(Bao et al. 2006a,b, He et al. 2006), as well as those associated
with starch biosynthesis (Zeng et al. 2007), displayed
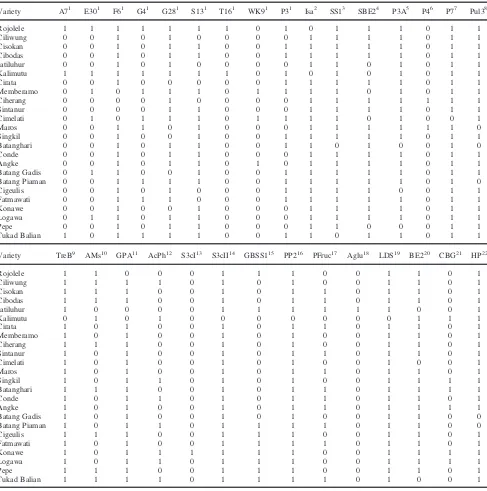
polymor-phism among indica varieties. Twenty-four indica rice varieties
were genotyped using 30 markers, revealing specific identities
for different indica varieties (Table 2). For example, Rojolele,
the variety of highest palatability, could be differentiated from
other Indonesian indica varieties in this way based on sensory
evaluation.
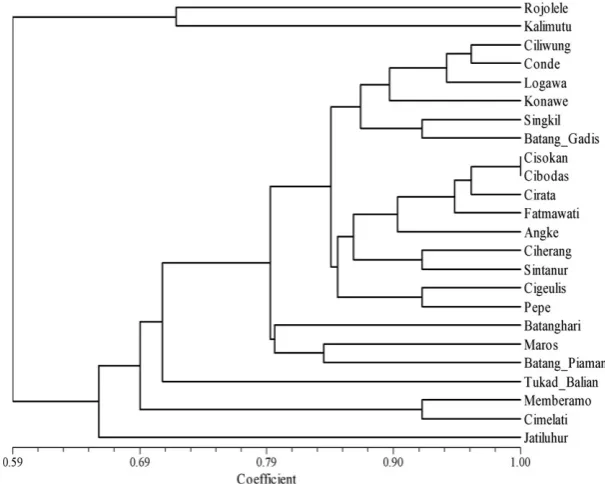
Cluster analysis was performed on similarity coefficient
matri-ces calculated from the 30 molecular markers to generate a
den-drogram (Fig. 1). Based on genetic similarity among all varieties,
we used a cut-off value of 0.66 to generate three clusters (I, II
and III), grouping 2, 21 and 1 varieties, respectively. Some
varie-ties with close ST values were in the same subcluster; however,
the variety of lowest palatability with low PC (Jatiluhur) seemed
to be far distanced from higher palatable varieties. Kalimutu with
medium ST but low PC was independently clustered.
Interest-ingly, using total markers, japonica and indica rice varieties could
be differentiated into two clusters (data not shown). However,
these markers were still not able to differentiate indica varieties
according to palatability. Therefore, an analysis of interaction
among markers to evaluate rice palatability was needed.
Eating quality traits of indica rice
The palatability scores based upon the sensory test (ST) and
the physicochemical properties of 24 indica rice varieties are
summarized in Table 3. Similar to japonica rice results, ST and
other
physicochemical
properties
gave
a
wide
range,
as
expected. The palatability value of indica rice could not be
determined quantitatively due to the glossiness of indica rice,
which cannot be precisely estimated with the Toyo taste meter
specifically designed for japonica. Seven varieties (Rojolele,
Memberamo, Cimelati, Conde, Batang Gadis, Pepe and Tukad
Balian) showed good palatability with a hedonic score higher
than 4, while two varieties (Singkil and Jatiluhur) possessed
low palatability (score less than 3). The amylose content (AC)
of Tukad Balian turned out to be the highest, while four
varieties (Jatiluhur, Kalimutu, Sintanur and Logawa) showed a
low value for protein content (PC).
Correlation analysis among the eating quality traits revealed
that ST and PC were significantly correlated, but there was no
significant correlation between AC and pasting properties
(Table 4). On the other hand, AC was not significantly
corre-lated with ST and PC, although it was significantly correcorre-lated
with most of the pasting properties, demonstrating that
palatabil-ity is a complex trait both in indica and in japonica rice.
More-over, it should be noted that because rice quality is determined
by complex traits of physical and chemical characteristics, thus,
in this study, we assume that sensory test is able to estimate the
palatability (overall eating quality) of each Indonesian variety/
local cultivar to represent eating quality.
Equation model to predict rice eating quality and its
validation
AcPh, CBG, S3cI, GBSS1) (Lestari et al. 2009) and one newly
developed in the present study (HP).
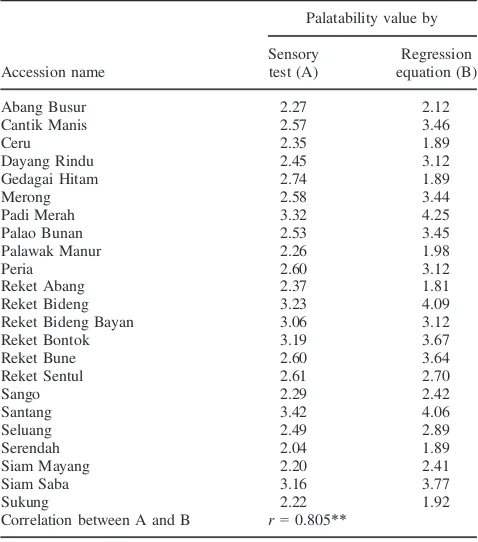
Palatability estimate according to the sensory evaluation was
calculated by the marker-based regression equation (Table 6). A
highly
significant
correlation
(r
=
0.805
**
)
was
observed
between palatability diagnosed by the regression equation and
sensory evaluation, demonstrating that this regression equation
could be a good candidate diagnostic kit to predict the
palatabil-ity of
indica
rice varieties and local accessions in Indonesia.
Discussion
Rice is one of the most important staple foods in East Asia. The
two subspecies of rice, indica and japonica, are thought that they
have originated from different gene pools of the wild relative
ancestor,
Oryza rufipogon
(Hosoya et al. 2010). Indica rice is
more widely consumed than japonica in the world, especially in
Southeast Asian countries including Indonesia. To keep up with
the increased consumer demand for higher eating quality of rice,
Table 2: Genotyping of 24 indica rice varieties using 24 previously reported markers and 6 newly developed markersVariety A71 E301 F61 G41 G281 S131 T161 WK91 P31 Isa2 SS13 SBE24 P3A5 P46 P77 Pul38
Rojolele 1 1 1 1 1 1 1 0 1 0 1 1 1 0 1 1
Ciliwung 0 0 1 0 1 0 0 0 0 1 1 1 1 0 1 1
Cisokan 0 0 1 0 1 1 0 0 1 1 1 1 1 0 1 1
Cibodas 0 0 1 0 1 1 0 0 1 1 1 1 1 0 1 1
Jatiluhur 0 0 1 0 1 0 0 0 0 1 1 0 1 0 1 1
Kalimutu 1 1 1 1 1 1 1 0 1 0 1 0 1 0 1 1
Cirata 0 0 1 0 0 0 0 0 1 1 1 1 1 0 1 1
Memberamo 0 1 0 1 1 1 0 1 1 1 1 0 1 0 1 1
Ciherang 0 0 0 0 1 0 0 0 0 1 1 1 1 1 1 1
Sintanur 0 0 0 0 1 1 0 0 0 1 1 1 1 0 1 1
Cimelati 0 1 0 1 1 1 0 1 1 1 1 0 1 0 0 1
Maros 0 0 1 1 0 1 0 0 0 1 1 1 1 1 1 0
Singkil 0 0 1 0 0 1 0 0 1 1 1 1 1 0 1 1
Batanghari 0 0 1 0 1 1 0 0 1 1 0 1 0 0 1 0
Conde 0 0 1 0 1 1 0 0 0 1 1 1 1 0 1 1
Angke 0 0 1 0 1 1 0 1 0 1 1 1 1 0 1 1
Batang Gadis 0 1 1 0 0 1 0 0 1 1 1 1 1 0 1 1
Batang Piaman 0 0 1 1 1 1 0 0 1 1 1 1 1 0 1 0
Cigeulis 0 0 1 0 1 0 0 0 1 1 1 1 0 0 1 1
Fatmawati 0 0 1 1 1 0 0 0 1 1 1 1 1 0 1 1
Konawe 0 0 1 0 0 1 0 0 0 1 1 1 1 0 1 1
Logawa 0 1 1 0 1 1 0 0 0 1 1 1 1 0 1 1
Pepe 0 0 1 0 1 1 0 0 0 1 1 0 0 0 1 1
Tukad Balian 1 0 1 1 1 1 0 0 1 1 0 1 1 0 1 1
Variety TreB9 AMs10 GPA11 AcPh12 S3cI13 S3cII14 GBSS115 PP216 PFruc17 Aglu18 LDS19 BE220 CBG21 HP22
Rojolele 1 1 0 0 0 1 1 1 0 0 1 1 0 1
Ciliwung 1 1 1 1 0 1 0 1 0 0 1 1 0 1
Cisokan 1 1 1 0 0 1 0 1 1 0 1 1 0 1
Cibodas 1 1 1 0 0 1 0 1 1 0 1 1 0 1
Jatiluhur 1 0 0 0 0 1 1 1 1 1 1 0 0 1
Kalimutu 0 1 0 1 0 0 0 0 0 0 0 1 1 1
Cirata 1 0 1 0 0 1 0 1 1 0 1 1 0 1
Memberamo 1 0 1 0 0 1 0 1 0 0 1 1 0 1
Ciherang 1 1 1 0 0 1 0 1 0 0 1 1 0 1
Sintanur 1 0 1 0 0 1 0 1 1 0 1 1 0 1
Cimelati 1 0 1 0 0 1 0 1 0 0 1 0 0 1
Maros 1 0 1 0 0 1 0 1 1 0 1 1 0 1
Singkil 1 0 1 1 0 1 0 1 0 0 1 1 1 1
Batanghari 1 1 1 0 0 1 0 1 1 0 1 1 1 1
Conde 1 0 1 1 0 1 0 1 1 0 1 1 0 1
Angke 1 0 1 0 0 1 0 1 1 0 1 1 1 1
Batang Gadis 1 0 1 0 0 1 0 1 0 0 1 1 0 0
Batang Piaman 1 0 1 1 0 1 1 1 1 0 1 1 0 0
Cigeulis 1 1 1 0 0 1 1 1 0 0 1 1 0 1
Fatmawati 1 0 1 0 0 1 1 1 1 0 1 1 0 1
Konawe 1 0 1 1 1 1 1 1 0 0 1 1 1 1
Logawa 1 0 1 1 0 1 1 1 0 0 1 1 1 1
Pepe 1 1 1 0 0 1 1 1 0 0 1 1 0 1
Tukad Balian 1 1 1 1 0 1 1 1 1 0 1 0 0 1
1
presence (1), absence (0);2fragment of 230 bp(0), 220 bp(1);3No insertion(1), insertion (0);4allele of C(1), allele of G(0);5fragment of 268 bp(1), 278 bp(0);6fragment of 139 bp(0), 153 bp(1);7fragment of 171 bp(1), 195 bp(0);8fragment of 297 bp(1), 281 bp(0);9Insertion of CTTT (1) and no
insertion (0) at nt 79-82 of the consensus region (intron);10(CT)31 and other (CT) repeat (1) and (CT)27 (0);11(CT)26 (0) and (CT)11 (1);12Point mutation from T (1) to G allele (0) at nt 397 of consensus region (intron);13No deletion (1) and deletion (CTC) (0) at nt 1255–1257 of consensus
the availability of a standardized rice eating quality reference is
important. To date, several attempts to evaluate japonica rice
eat-ing quality have been made with a number of established
molec-ular marker sets (Ohtsubo et al. 2002, 2003, Lestari et al. 2009),
but no such data on indica rice are available yet. This study is
the first report on the development of marker sets to estimate
indica rice eating quality according to sensory test.
Evaluation of rice palatability has long been conducted on
japonica rice, but little has been performed on indica rice,
espe-cially by means of the taste meter that has been designed
specifi-cally based upon japonica rice starch properties. Both the Toyo
taste meter and sensory evaluation can constitute a good measure
of the eating quality of rice. The existence of a strong positive
correlation between the palatability measured with the Toyo taste
Fig. 1: Dendrogram of 24 indicavarieties constructed on the basis of similarity coefficients in UPGMA analysis
Table 3: Means and ranges of eating quality parameters detected for the indica rice varieties examined in this study
Parameter MeanSD Range CV (%) Skewness Kurtosis
ST 3.690.49** 2.2–4.25 13.25 1.47 2.3
AC (%) 21.382.33** 16.63–26.51 10.91 0.05 0.07
PC (%) 8.841.40** 5.5.3–10.33 15.83 1.08 0.14
PVRVU 219.6441.09** 124.16–305.03 18.71 0.58 0.68
HPVRVU 127.58
21.10** 91–169.1 16.54 0.04 0.6
BDVRVU 92.0615.83** 32.91–150.08 28.06 0.27 0.72
CPVRVU 255.24
38.53** 142.08–323.31 15.10 0.74 2.09
SBVRVU 35.610.02** 26.25 to 100.75 40.71 0.33 0.15
CTVRVU 127.66
25.45** 31.06–172.45 19.94 2.03 8.05
ST, palatability score from sensory test; AC, amylose content; PC, protein content; CPV, cold paste viscosity; BDV, breakdown viscosity; PV, peak viscosity; HPV, hot paste viscosity; SBV, setback viscosity; CTV, consistency viscosity; M, palatability value estimated from the equation based on marker data; RVU, Rapid Visco Unit.
**Significant at level of 1%.
Table 4: Correlation matrix of eating quality parameters determined in indica rice varieties in this study
Parameter ST AC PC PV HPV BDV CPV SBV
ST
AC 0.324ns
PC 0.412* 0.262ns
PV 0.249ns 0.343ns 0.318ns
HPV 0.077ns
0.116ns 0.222ns 0.845**
BDV 0.333ns 0.450* 0.324ns 0.900** 0.528**
CPV 0.193ns 0.381ns 0.189ns 0.496* 0.769** 0.161ns
SBV 0.400* 0.718** 0.0144ns
0.549** 0.127ns
0.769** 0.453*
CTV 0.378ns 0.657** 0.100ns 0.049ns 0.328ns 0.19ns 0.856** 0.773**
meter and sensory tests has been confirmed (Azuma et al. 1994,
Tanaka et al. 2006, Takeuchi et al. 2007, Lestari et al. 2009),
allowing sensory evaluation to be widely used on japonica rice
as a direct index of the evaluation of rice eating quality. Protein
content (PC) showed a significant effect with a positive
correla-tion on indica rice palatability in this study. However, our
palat-ability score showed no correlation with RVA pasting properties,
except for setback viscosity (SBV) as in the previous reports
(Yu et al. 2008, Lestari et al. 2009). In addition, no significant
effect of amylose content (AC) has been shown on either indica
palatability or japonica palatability (Allahgholipour et al. 2006,
Lestari et al. 2009, Sun et al. 2011); therefore, AC and pasting
properties may not be a solid indicator to measure rice
palatabil-ity.
Sequence variations including SNPs, indels and SSRs
ran-domly located on the rice genome, in addition to the nucleotide
sequences representing QTLs/genes of interest, could be a major
source of molecular markers. With its high fidelity and efficacy,
molecular markers developed from nucleotide variation in the
genome have been instrumental for genotyping and
differentiat-ing varieties. SNPs and/or indels in starch-branchdifferentiat-ing enzyme
(SBE), sucrose starch synthase (SSS), granule bound starch
syn-thase (GBSS), Waxy gene and other starch-synthesizing genes or
loci are associated with rice eating quality traits (Bao et al.
2006a,b, He et al. 2006). As each single SNP or indel site
gener-ally showed little significant association with rice palatability, a
combination of markers rather than a single marker could be
bet-ter for evaluating rice eating quality.
The 24 indica rice varieties fell into three main clusters at a
genetic similarity level of 0.67
–
0.69 using 30 markers. Even
though these markers were all derived from QTLs for eating
quality and associated traits (Lestari et al. 2009), the clusters
produced were not projected to be related to eating quality traits.
These cluster results suggest that unweighing markers with the
same effect on the genotypic determination could result in their
biased
contribution
in
the
genetic
similarity
calculation.
Although that is a common way of genotyping and performing
genetic similarity analysis, it may not be a good approach as
reported on japonica rice evaluation (Lestari et al. 2009) and
dif-ferential integrity of markers is required to evaluate indica rice
eating quality. A successful multiple regression analysis on
eval-uation of japonica rice eating quality was reported (Ohtsubo
et al. 2003, Lestari et al. 2009), and multiple regression
equa-tions with the highest
R
2and the lowest standard error were
per-formed and proven to be effective in predicting the indica rice
palatability using sensory evaluation. With a similar approach in
this study, combined with STS markers developed previously
(Ohtsubo et al. 2002, 2003, Ohtsubo and Nakamura 2007), we
were able to estimate rice palatability on the basis of a sensory
test. Markers derived from starch-synthesizing genes, particularly
starch-branching enzyme, starch-debranching enzyme, granule
bound starch synthase (Bao et al. 2006a,b, He et al. 2006) and
other eating quality traits (Nakamura et al. 2004) together with
our developed markers are good sources for development of
PCR-based evaluation of rice eating quality.
The regression equation contained seven markers (E30, F6,
WK9, GPA, AcPh, CBG, S3cI) (Table 5) that seemed to
signifi-cantly contribute to palatability on both japonica and indica
vari-eties. Regression values (R
2) of the seven markers explained
most of the variation in the equations of both indica and
japon-ica rice. With the exception of WK9, six of these markers were
shared in common for predicting palatability using a sensory test
on both japonica and indica. While P5 showed the highest partial
Table 5: Model equation for evaluating indicarice eating qualitycon-taining the significant coefficient of each marker t-value aided by multi-ple regression analysis
PCR primer
Palatability by sensory test (ST)
Parameter estimated t-value R2
A7 3.260.21 15.85** 0.074
E30 0.330.05 6.78** 0.045
F6 0.650.05 13.76** 0.029
S13 0.130.04 3.20* 0.010
T16 6.110.25 24.27** 0.029
WK9 1.000.06 16.69** 0.048
P3 0.230.03 6.58** 0.01
GPA 2.360.11 22.23** 0.32
AcPh 0.270.04 5.91** 0.048
Pul3 1.620.08 18.92** 0.001
CBG 0.850.05 18.27** 0.060
S3cI 0.530.07 7.45** 0.010
GBSS1 0.420.04 10.01** 0.0001
SS1 3.200.15 21.80** 0.167
SBE2 0.520.05 9.69** 0.012
P3A 0.450.07 6.48** 0.008
P4 0.970.08 11.65** 0.032
HP 0.810.06 13.90** 0.094
Intercept 3.070.12 26.49**
Total 0.997
Equation Y=3.073.26(A7)0.33(E30)+0.65(F6)+0.13
(S13)+6.11(T16)+1.00(WK9)0.23
(P3)+2.36(GPA)+0.27(AcPh)+1.62(Pul3)
0.85(CBG)0.53(S3cI)+0.42(GBSS1)3.20
(SS1)0.52(SBE2)+0.45(P3A)+0.97(P4)
0.81(HP)
*and**, significant at 5 and 1% level, respectively.
Table 6: Palatability values of 23 localindicarice from Indonesia mea-sured by the sensory test and estimated by the regression equation
Accession name
Palatability value by
Sensory test (A)
Regression equation (B)
Abang Busur 2.27 2.12
Cantik Manis 2.57 3.46
Ceru 2.35 1.89
Dayang Rindu 2.45 3.12
Gedagai Hitam 2.74 1.89
Merong 2.58 3.44
Padi Merah 3.32 4.25
Palao Bunan 2.53 3.45
Palawak Manur 2.26 1.98
Peria 2.60 3.12
Reket Abang 2.37 1.81
Reket Bideng 3.23 4.09
Reket Bideng Bayan 3.06 3.12
Reket Bontok 3.19 3.67
Reket Bune 2.60 3.64
Reket Sentul 2.61 2.70
Sango 2.29 2.42
Santang 3.42 4.06
Seluang 2.49 2.89
Serendah 2.04 1.89
Siam Mayang 2.20 2.41
Siam Saba 3.16 3.77
Sukung 2.22 1.92
Correlation between A and B r=0.805**
R
2in both equation models according to the Toyo taste meter
and sensory test on japonica, the GPA marker developed
previ-ously (Lestari et al. 2009) gave the highest, possibly representing
a major QTL for palatability in indica rice.
In the equation model comprising 18 markers, most of the
reported markers developed for evaluation in japonica rice with
some modified SNP markers for simpler application (Lestari
and Koh 2013) were included. Some previously developed STS
markers used in this study were based on the japonica rice
gen-ome. The regression equations had high enough resolution to
predict the palatability of japonica rice (Lestari et al. 2009).
Considering the various palatabilities of varietal groups among
countries, broad application of the markers with some
modifica-tions is required, such as with indica, as demonstrated in this
study. Some additional markers developed based on both
japon-ica and indjapon-ica rice genomes facilitate a new appljapon-icable
regres-sion equation to evaluate indica rice palatability. Surprisingly,
validation of the equation using local rice accession from
Indo-nesia indicates its sufficient resolution to estimate the
palatabil-ity of
indica
rice originated from Indonesia. This is also due to
the fact that 23 local rice accessions were cultivated using the
same cultural practices at the same field as 24 training varieties,
and therefore, mostly genetic factors involved in palatability
were evaluated while environmental factors could be excluded.
This set marker with significant correlation (r
=
0.805
**
) is in
good agreement with previously formulated markers for eating
quality of
japonica
rice mostly originating from Korea and
Japan (Ohtsubo et al. 2002, 2003, Lestari et al. 2009). This
for-mulated marker set is like an initial step; thus, more validations
should be carried out in different laboratories across Indonesia
regions using more diverse indica rice varieties and breeding
lines to encounter the consistent estimate. Similar to the marker
set that works well on japonica rice, this marker set in the
regression equation developed in our study will be useful for
selection during early breeding generation to enhance breeding
for improved rice eating quality and prediction of eating quality
of
indica
rice varieties in Indonesia. Moreover, these markers in
our study could be valuable resources for formulation of other
marker sets to estimate
indica
rice eating quality by sensory test
depending on the taste preference of rice-consuming countries
’
people.
Acknowledgements
This study was supported in part by a grant (609001-5) from the Tech-nology Development Program for Agriculture and Forestry, Ministry of Agriculture, Forestry and Fisheries, and in part by a grant from the Next-Generation BioGreen 21 Program (Plant Molecular Breeding Center, No. PJ008125), Rural Development Administration, Republic of Korea.
References
Allahgholipour, M., A. J. Ali, F. Alinia, T. Nagamine, and Y. Kojima, 2006: Relationship between rice grain amylose and pasting properties for breeding better quality rice varieties. Plant Breed.125, 357—362. AOAC, 1995: Official Methods of Analysis, 16th edn. AOAC,
Gaithers-burg, MD.
Azuma, S., Y. Sasaki, K. Ishizaki, T. Kondou, and T. Hoshi, 1994: Improvement of grain and eating quality in rice breeding of Niigata prefecture: comparison of the some measuring methods for effective selection about eating quality. Hokuriku Crop Sci.29, 35—36. Bao, J. S., and Y. W. Xia, 1999: Genetic control of the paste viscosity
characteristics in indica rice (Oryza sativaL.). Theor. Appl. Genet.98, 1120—1124.
Bao, J. S., H. Corke, and M. Sun, 2006a: Microsatellites, single nucleo-tide polymorphisms and a sequence tagged site in starch-synthesizing genes in relation to starch physicochemical properties in non-waxy rice (Oryza sativaL.). Theor. Appl. Genet.113, 1185—1196.
Bao, J. S., H. Corke, and M. Sun, 2006b: Nucleotide diversity in starch synthase IIa and validation of single nucleotide polymorphisms in rela-tion to starch gelatinizarela-tion temperature and other physicochemical properties in rice (Oryza sativaL.). Theor. Appl. Genet.113, 1171— 1183.
Bao, J. S., L. A. Jin, P. Xiao, S. Q. Shen, M. Sun, and H. Corke, 2008: Starch physicochemical properties and their association with microsat-ellite alleles of starch-synthesizing genes in a rice RIL population. J. Agric. Food Chem.56, 1589—1594.
Hatae, K., S. Ayabe, and M. Kasai, 2004: Textural differences between
indicaandjaponicavarieties in cooked rice. In: Rice Is Life: Scientific Perspectives for the 21st Century. K. Toriyama, K. L. Heong, and B. Hardy (eds), Proceeding of the World Rice Research Conference held in Tokyo and Tsukuba, 4–7 November 2004. Los Banos (Philippines); International Rice Research Institute and Tsukuba (Japan): Japan Inter-national Research Center for Agricultural Sciences, Japan, 2005; pp. 253—255.
He, Y., Y. P. Han, L. Jiang, C. W. Xu, J. F. Lu, and M. L. Xu, 2006: Functional analysis of starch-synthesis genes in determining rice eating and cooking qualities. Mol. Breed.18, 277—290.
Hosoya, L. A., Y. I. Sato, and D. Q. Fuller, 2010: Editorial: the archae-obotany of early agriculture in Asia. Archaeol. Anthropol. Sci.2, 57— 59.
Izumi, O. E., M. Yuji, S. Kuniyuki, and K. Toshiro, 2007: Effects of ris-ing temperature on grain quality, palatability and physicochemical properties of rice. Sci. Rep. Fac. Agric. Okayama Univ.96, 13—18. Kim, S. K., and C. O. Rhee, 2004: Analyzing and improving the texture
of cooked rice. In: D. Kilcast (ed.), Texture in Food, Vol. 2, 464. Woodhead Publisher, New York, NY.
Kobayashi, A., K. Tomita, F. Yu, Y. Takeuchi, and M. Yano, 2008: Ver-ification of quantitative trait locus for stickiness of cooked rice and amylose content by developing near-isogenic lines. Breed. Sci.58, 235 —242.
Kwon, S. W., Y. C. Cho, J. H. Lee, J. P. Suh, J. J. Kim, M. K. Kim, I. M. Choi, H. G. Hwang, H. J. Koh, and Y. G. Kim, 2011: Identifica-tion of quantitative trait loci associated with rice eating quality traits using a population of recombinant inbred lines derived from a cross between two temperate japonica cultivars. Mol. Cells31, 437—445. Lestari, P., and H. J. Koh, 2013: Development of new CAPS/dCAPS
and SNAP markers for rice eating quality. HAYATI J. Biosci.20, 15 —23.
Lestari, P., T. H. Ham, H. H. Lee, M. Wook, W. Z. Jiang, S. H. Chu, S. W. Kwon, K. H. Ma, J. H. Lee, Y. C. Cho, and H. J. Koh, 2009: PCR marker-based evaluation of eating quality of cooked rice (Oryza sativaL.). J. Agric. Food Chem.57, 2754—2762.
Li, Z., J. Wan, J. Xia, and M. Yano, 2003: Mapping of quantitative trait loci controlling physic-chemical properties of rice grains (Oryza sativa
L.). Breed. Sci.53, 209—215.
Nakamura, S., H. Okadome, K. Yoza, K. Haraguchi, T. Okunishi, K. Su-zuki, H. Satoh, and K. Ohtsubo, 2004: Differentiation and search for palatability-factors of world-wide rice grains by PCR method. Nippon Nogeikagaku Kaishi78, 764—779.
Ohtsubo, K., and S. Nakamura, 2007: Cultivar identification of rice (Oryza sativaL.) by Polymerase Chain Reaction method and its appli-cation to processed rice products. J. Agric. Food Chem. 55, 1501— 1509.
Ohtsubo, K., S. Nakamura, and T. Imamura, 2002: Development of the primers sets for identification of a rice varieties, Koshihikari, by PCR. Nippon Nogeikagaku Kaishi76, 388—397.
Ohtsubo, K., S. Nakamura, and H. Okadome, 2003: Investigation on esti-mation of rice palatability by DNA analysis (Studies on estiesti-mation of rice palatability by DNA analysis part I). Nippon Nogeikagaku Kaishi 50, 122—132.
Rohlf, F. J., 1993: NTSYS-PC Numerical Taxonomy and Multi Variate Analysis System, version 1.8. Exeter Publisher, Setauket, NY. Statistical Analysis System (SAS), 2001: SAS User’s Guide, release 8.2.
Statistical Analysis Systems Institute, Cary, NC.
Suh, J. P., Y. H. Choi, K. J. Kim, Y. C. Cho, S. J. Kwon, Y. P. Jeong, J. U. Jeung, I. S. Choi, Y. G. Kim, H. C. Choi, and H. G. Hwang, 2004: Genetic diversity and QTLs for grain quality injaponicarice. Korean J. Breed. Sci.36, 31—37.
Sun, M. M., S. E. Abdula, H. J. Lee, Y. C. Cho, L. Z. Han, H. J. Koh, and Y. G. Cho, 2011: Molecular aspect of good eating quality forma-tion injaponicarice. PLoS One6, e18385.
Takeuchi, Y., Y. Nonoue, T. Ebitani, K. Suzuki, N. Aoki, H. Sato, O. Ideta, H. Hirabayashi, M. Hirayama, H. Ohta, H. Nemoto, H. Kato, I. Ando, K. Ohtsubo, Y. Yano, and T. Imbe, 2007: QTL detection for eating quality including glossiness, stickiness, taste and hardness of cooked rice. Breed. Sci.57, 231—242.
Tanaka, I., A. Kobayashi, K. Tomita, Y. Takeuchi, M. Yamagishi, M. Yano, T. Sasaki, and H. Horiuchi, 2006: Detection of quantitative trait loci for stickiness and appearance based on eating quality test in japonica rice cultivars. Breed. Res.8, 39—47.
Thompson, J. D., D. G. Higgins, and T. J. Gibson, 1994: CLUSTAL W: improving the sensitivity of progressive multiple sequence alignment through sequence weighting, position-specific gap penalties and weight matrix choice. Nucleic Acids Res.22, 4673—4680.
Wada, T., T. Ogata, M. Tsubone, Y. Uchimuya, and Y. Mastue, 2008: Mapping of QTLs for eating quality and physicochemical properties of thejaponicarice‘Koshihikari’. Breed. Sci.58, 427—435.
Wan, X. Y., J. M. Wan, C. C. Su, C. M. Wang, W. B. Shen, J. M. Li, H. L. Wang, L. Jiang, S. J. Liu, L. M. Chen, H. Yasui, and A. Yoshi-ura, 2007: A QTL detection of eating quality of cooked rice in a popu-lation of chromosomal segment substitution lines. Theor. Appl. Genet. 110, 71—79.
Yu, T. Q., W. Jiang, T. H. Ham, S. H. Chu, P. Lestari, J. H. Lee, M. K. Kim, F. R. Xu, L. Han, L. Y. Dai, and H. J. Koh, 2008: Comparison of grain quality traits between japonica rice cultivars from Korea and Yunnan province of China. J. Crop Sci. Biotech.11, 135—140. Zeng, D., M. X. Yan, Y. H. Wang, X. F. Liu, Q. Qian, and J. Y. Li,
2007:Du1, encoding a novel Prp 1 protein regulates starch biosynthe-sis through affecting the specificity ofWxbpre-mRNAs in rice (Oryza