THE EFFECT OF CAPITAL STRUCTURE ON PROFITABILITY OF PROPERTY AND CONSTRUCTION COMPANIES IN INDONESIA
Hatane Semuel
1,
Liske Widjojo
2Master Business and Administration Program Faculty of Economy Petra Christian University Surabaya
Abstract
The effect of capital structure on profitability has been discussed many times. The static order theory claims positive effect is given by capital structure, but the pecking order theory claims the contradictive one. Data of this paper is taken from 29 construction and property companies for 2009-2013 periods. The analysis method is structural equation modeling. The short term debt is founded positively affect on profitability. According to the result, property and construction companies in Indonesia should build more trust to short term debt sources’s such as property buyers, sub-contractors, and material suppliers.
Keywords : capital structure, profitability, static order, pecking order
INTRODUCTION
Background
The effect of capital structure on firm’s profitability has been discussed many times before. Modigliani and Miller (1958) have started the discussion by releasing Modgliani and Miller Theorem (MM Theorem). The theorem is based on perfect market which tax is not included. The conclusion of the theorem is capital structure has no effect on profitability. The idea of MM Theorem is supported by Donaldson (1961) with the pecking order theory. The theory suggests maximizing retained earning for budgeting. The company is allowed to make debt if retained earning is not enough anymore to budget the operational activities. The last option for budgeting is to gain new equities.
Another theory about capital structure is the static order theory which is released by Kraus and Litzenberger (1973). The theory is totally different with MM Theorem and the pecking order theory. The theory claims the positive effect of capital structure on profitability. Miller (1977) proves the theory which companies would gain profit by making debt. By making debt, the companies would decrease the tax because it is based on earnings after interests. In fact, too much debt would cause financial distressed on companies. Beside it, the cost of debts would increase following the debt ratio because the risk of the company has also increased. The advantage by decreasing tax would be smaller than the high cost of debt if the debt ratio of the company is too high. That’s why, according to the static order theory, company should optimize the debt to gain maximal profit.
Myers (1984) has developed the pecking order theory. The traditional pecking order theory suggests that making debt is the second order for budgeting. This idea cannot be applied in all conditions, (Myers, 1984). Agency theory should be noticed because there is asymmetric information between company’s externals and internals. The company’s externals are the investors who would invest their money to the company; the internals are the company’s management. The behavior of internal can be indicated such as the behavior of investing in the company itself. This behavior indicates that the market price is cheaper than the value of the
1 Professor in Post Graduate Management Program, E-mail address: [email protected]
company. This condition is termed undervalued which the top management should make debt than to raise new equities. Another condition, the internals do not invest their money in the company which indicates overpriced condition. If overpriced condition is occured, the company should raise new equity than to make debt.
Titman and Wessels (1988) has proved that there is no effect of capital structure on profitability. Kayhan and Titman (2004); Ebaid (2009); San and Heng (2011) has proved the same conclusion with Titman and Wessels (1988). Those four papers support the pecking order theory and MM theorem. Tian and Zeitun (2007) has proved different conclusion with those papers above that capital structure gives negative effect on profitability. The same conclusion is also proved by Muritala (2012); Ajanthan (2013); Khan (2012); Cortez and Susanto (2012); Mohammad and Abdullah (2012); Umar, et al. (2012); Buferna, et al. (2005); Nirajini and Priya (2013). The negative effect of capital structure on profitability supports that the pecking order theory is occurred.
Chien (2013); Boroujeni, et al. (2013); Negash (2001) have proved that the static order is occurred. They proved the positive effect of capital structure on profitability. Those differences above show a gap in the research of the effect of capital structure on profitability. There are also some moderating variables such as firm’s size and asset tangibility. Titman and Wessels (1988); Kayhan and Titman (2004) proved that capital structure gives positive effect on firm’s size. On the other side, Buferna, et al. (2005) proved that capital structure gives negative effect on firm’s size. The positive effect of capital structure on asset tangibility is proved by Cortez and Susanto (2012). Firm’s size also gives positive effect on profitability which has been proven by Umar, et al. (2012); Boroujeni, et al. (2013); Mohammad and Abdullah (2012). Umar, et al. (2012) also proved the negative effect of firm’s size on profitability in another indicators. Muritala (2012) proved that asset tangibility gives negative effect on profitability. Boroujeni, et al. (2013) proved the different result with Muritala (2012). According to those papers, there are at least four gaps occurred.
Property and construction is one of economic’s indicator in Indonesia. It concluded by the growth of both sectors which is following Indonesia’s GDP. Indonesia had economy crisis at 1997-2001, which resulted on bad growth ratio of property and construction companies. The same thing was also occurred when GDP was growing up. The growth ratio of both sectors was following to grow up. Picture 1 below would show the movement of growth ratio of property and construction sectors which compared with the movement of Indonesia’s GDP ratio.
Source : LM-FEUI (2011)
Beside sector’s movement is following the GDP, both sectors have high production volume growth (LM-FEUI, 2011). Picture 2 below shows the production volume growth of many sectors in Indonesia.
Source : Estimated by LM-FEUI, based on BPS’s data (2011)
Picture 2. The Growth of Each Economy’s Sectors on Gross Domestc Production
THEORY AND HYPOTHESES 1. Budgeting
Modigliani and Miller (1958) stated that companies have some alternative of budgeting such as by equities, making debts, and combining the equity with debts. Each alternative of budgeting has cost which explained further below,
a. Budgeting by Equities
Budgeting by equities is usually preferred by newborn companies. The company’s owner has to debt some money being the company’s equity. The equity’s raising for the very first time is called as companies go public. The cost of budgeting by equities is difficult to be calculated. It caused by there is no similar comparison for each kind of investation. There are some methods to calculate the cost of budgeting by equities. The most popular one is Capital Assets Pricing Model which is abbreviated to be CAPM. The method is popularized by William Sharpe (1964), Jack Treynor (1962), John Lintner (1965), and Jan Mossin (1966). CAPM is based on calculation of expected return and risk which is developed by Harry Markowitz (1952). The calculation of expected return and risk could be used to calculate the portfolio investations by investor. The calculation method still has a problem if there are a lot of portfolios because of the difficulties to calculate.
b. Budgeting by making debt
usually per six months. At the maturity time, the obligation’s buyer would get the par value or face value.
2. Capital Structure
Capital structure is defined by Damodaran (2001) as a compotition of debt an equities to budget the company’s operational. The theory about capital structure is started by MM Theorem which is released by Modigliani and Miller (1958). The theorem is based on perfect market which no taxes is included. There are also no differences of interest rate for companies and personal. Those conditions are not available in fact. There are always differences of interest rate for companies an personal, taxes, and transaction cost. Modigliani and Miller (1958) did the research based on perfect market which is resulted two propotitions. The first propotition stated that there is no differences between using budgeting by equities and making debt. The second propotition stated that even there is an advantage of budgeting by making debt, it would result on increasing the cost of budgeting by equities. The risk of the companies with higher debt ratio is also increased. It would cause the investor asked the higher compensation for their investment on the higher risk company. The advantage of budgeting by making debt is also decreased following the demand of investors on higher compensation. Even the perfect market on Modigliani and Miller (1958) research’s are not occurred in fact, the research has been being the basic of many researchs about the effect of capital structure on profitability. The research about capital structure itself has been developed being two big theories such as static order theory and pecking order theory. Both theories are contradictive to each other. Static order theory stated that capital structure would affect positive on profitability, but pecking order theory stated that capital structure would affect negative on profitability.
a. Static order theory
Static order theory is released by Kraus and Litzenberger (1973). Kraus and Litzenberger has developed capital structure theory which is based on the real market’s condition. Kraus and Litzenberger (1973) stated that there is positive effect of capital structure on profitability. The positive effect is occurred because the tax is calculated based on earnings after interests. Earnings after interests would be decreased by the present of interest.
Even the budgeting by making debt could decrease the tax cost, company are not allowed to budget the whole operational activities by making debt. Too high debt ratio would cause financial distressed on company. According to this idea, company should calculate the optimal debt ratio to gain maximal profit.
b. Pecking order theory
The pecking order theory is released by Donaldson (1961). The theory is totally different with the static order theory. The pecking order theory suggests to prior retained earning for budgeting. If retained earning is not enough anymore to budget the company, then the company is allowed to make debt. Company could raise the new equity if retained earning and debt are not enough anymore to budget the operational activities.
before raising new equities if the undervalued condition is occurred. Capital Structure’s Indicators
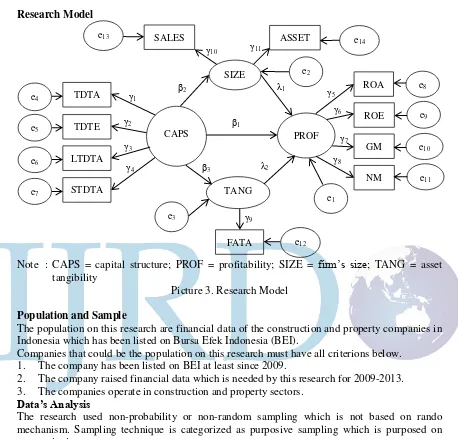
The indicator of capital structure is debt ratio that could be indicated of many variables. There are four indicators used for this research which is formulated below,
TDTA = total debts / total assets TDTE = total debts / total equities LTDTA = long term debts / total assets STDTA = short term debts / total assets
3. Profitability
Profitability is the most important purpose in business thing. There are a lot of alternatives to increase the profitability, one of them is optimizing the capital structure. Those theories about capital structure is purposed on gaining maximal profit. Based on pecking order theory, Myers (1984) suggested to review the condition of the company. If the company is in undervalued condition, it should make debt than to raise new equity. If the company is in overpriced condition, it should raise new equity than to make debt. The purpose of this suggestion is gaining profit.
Static order theory is purposed gaining the profitability by decreasing the tax cost. According to Kraus and Litzenberger (1973), the company should find the optimal debt ratio to gain maximal profit. The profit by decreasing the taxt cost should be compared with the increasing of debt’s cost.
This research used four indicators to indicate profitability such as below, ROA = total sales / total assets
ROE = total sales / total equities GM = gross margin / total sales NM = net margin / total sales 4. Firm’s size
The indicators of firm’s size on this research are ASSET = ln (total assets)
SALES = ln (total sales) 5. Asset tangibility
Asset tangibility could be indicated by fixed assets to total assets (FATA), which formulated below,
FATA = total fixed assets / total assets Hypotheses
There are five hypotheses on this research, such as below,
H1 : There is significant effect of capital structure on profitability of construction and property companies in Indonesia
H2 : There is significant effect of capital structure on firm’s size of construction and property companies in Indonesia
H3 : There is significant effect of capital structure on tangibility asset of construction and property companies in Indonesia
H4 : There is significant effect of firm’s size on profitability of construction and property companies in Indonesia
RESEARCH METHODOLOGY
The population on this research are financial data of the construction and property companies in Indonesia which has been listed on Bursa Efek Indonesia (BEI).
Companies that could be the population on this research must have all criterions below. 1. The company has been listed on BEI at least since 2009.
2. The company raised financial data which is needed by this research for 2009-2013. 3. The companies operate in construction and property sectors.
Data’s Analysis
The research used non-probability or non-random sampling which is not based on rando mechanism. Sampling technique is categorized as purposive sampling which is purposed on some criterions.
RESULT AND DISCUSSION
The research model is started by outer modal testing. Based on the test, it was acknowledged that some indicators are not reflective to the latent variable. Table 1 below shows outer loadings of the research model at the Picture 3.
SALES 0 0 0,9893 0
STDTA 0,9348 0 0 0
TDTA 0,9252 0 0 0
TDTE 0,9173 0 0 0
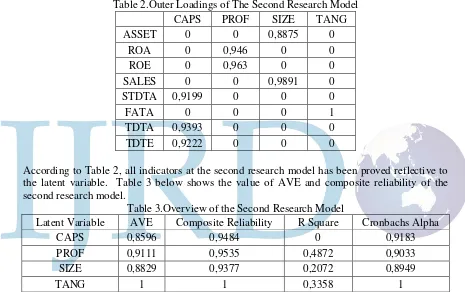
The outer loadings of some indicators has value lower than 0,7 which meant the indicator is not reflective to the latent variable. Those indicators that proved not reflective are LTDTA, GM, and NM. The result shows that elimination of some indicators that proved not reflective is needed. Table 2 below shows the outer loadings of the second research model which eliminated those three indicators.
Table 2.Outer Loadingsof The Second Research Model
CAPS PROF SIZE TANG
ASSET 0 0 0,8875 0
ROA 0 0,946 0 0
ROE 0 0,963 0 0
SALES 0 0 0,9891 0
STDTA 0,9199 0 0 0
FATA 0 0 0 1
TDTA 0,9393 0 0 0
TDTE 0,9222 0 0 0
According to Table 2, all indicators at the second research model has been proved reflective to the latent variable. Table 3 below shows the value of AVE and composite reliability of the second research model.
Table 3.Overview of the Second Research Model
Latent Variable AVE Composite Reliability R Square Cronbachs Alpha
CAPS 0,8596 0,9484 0 0,9183
PROF 0,9111 0,9535 0,4872 0,9033
SIZE 0,8829 0,9377 0,2072 0,8949
TANG 1 1 0,3358 1
The lowest value of AVE is 0,8596 which is bigger than 0,4 as the minimum value of AVE. The lowest value of composite reliability is 0,9377 which is bigger than 0,7 as the minimum value of composite reliability. Two results above shows that all indicators are reliable. The calculation of Q2 which is based on R Square value results 0,73. The value is high enough, which concluded that the model is already been good. Table 4 below shows the analysis towards the inner model. T Statistics is calculated to get the value of significances. If the value of significances is lower than 0,05 than the hypothesis is significant.
Table 4.Path Coefficients of Second Research Model
Hypotheses Original
Sample
T
Statistics Significances The effect of capital structure on profitability 0,4766 10,90 0,000
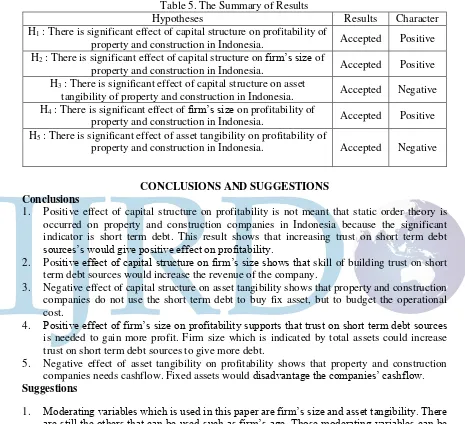
Those five hypotheses have the value of significances of 0,000 which is lower than 0,05. The results show that all hypotheses that tested are significant. The character of each hypothesis is also known by the value of original sample in Table 4 above. It’s looked that all hypotheses are positive except the effect of capital structure on asset tangibility and the effect of asset tangibility on profitability. The summary of results is shown at Table 5 below.
Table 5. The Summary of Results
Hypotheses Results Character
H1 : There is significant effect of capital structure on profitability of
property and construction in Indonesia. Accepted Positive H2 : There is significant effect of capital structure on firm’s size of
property and construction in Indonesia. Accepted Positive H3 : There is significant effect of capital structure on asset
tangibility of property and construction in Indonesia. Accepted Negative H4 : There is significant effect of firm’s size on profitability of
property and construction in Indonesia. Accepted Positive H5 : There is significant effect of asset tangibility on profitability of
property and construction in Indonesia. Accepted Negative
CONCLUSIONS AND SUGGESTIONS Conclusions
1. Positive effect of capital structure on profitability is not meant that static order theory is occurred on property and construction companies in Indonesia because the significant indicator is short term debt. This result shows that increasing trust on short term debt sources’s would give positive effect on profitability.
2. Positive effect of capital structure on firm’s size shows that skill of building trust on short term debt sources would increase the revenue of the company.
3. Negative effect of capital structure on asset tangibility shows that property and construction companies do not use the short term debt to buy fix asset, but to budget the operational cost.
4. Positive effect of firm’s size on profitability supports that trust on short term debt sources is needed to gain more profit. Firm size which is indicated by total assets could increase trust on short term debt sources to give more debt.
5. Negative effect of asset tangibility on profitability shows that property and construction companies needs cashflow. Fixed assets would disadvantage the companies’ cashflow. Suggestions
1. Moderating variables which is used in this paper are firm’s size and asset tangibility. There are still the others that can be used such as firm’s age. Those moderating variables can be tested how it would affect profitability or it would be affected by capital structure.
2. The paper tests only the effect of capital structure on profitability of property and construction companies. The same research should be tested on the other economic’s sectors.
REFERENCES
Ajanthan, A. (2013). Determinants of Capital Structure: Evidence from Hotel and Restaurant Companies in Sri Lanka. International Journal of Scientific and Research Publications, 3 (6), pp. 1 – 8.
Buferna, F., Bangassa, K., dan Hodgkinson, L. (2005). Determinants of Capital Structure: Evidence from Libya. Unpublished Manuscript, No 2005/08, Management School, University of Liverpool.
Chien, Y. C. (2013). The Effects of Capital Structure on the Corporate Performance of Taiwan-listed Photovoltaic Companies: A Moderator of Corporate Innovation Activities. The Journal of Global Business Management, Vol. 9 (1), pp. 92 – 105.
Cortez, M. A. dan Susanto, S. (2012). The Determinants of Corporate Capital Structure: Evidence from Japanese Manufacturing Companies. Journal of International Business Research, Vol. 11 (3), pp. 121 – 134.
Damodaran, A. (2001). Corporate Finance: Theory and Practice, 2nd ed. New York: Wiley. Donaldson, C. (1961). Corporate Debt Capacity. Unpublished Manuscript, Harvard University. Ebaid, I. E. (2009). The Impact of Capital Structure Choice on Firm Performance: An Empirical
Evidence from Egypt. Journal of Risk Finance, Vol. 10 (5), pp. 477 – 487.
Kayhan, A. dan Titman, S. (2004). Firm’s Histories and Their Capital Structures. NBER Working Paper 10526.
Khan, W. (2012). Impact of Capital Structure and Financial Performance on Stock Returns: A Case of Pakistan Textile Industry. Retrieved on February 4, 2014. from http://ssrn.com/abstract=2082306.
Kraus, A. dan Litzenberger, R. H. (1973). A State Preference Model of Optimal Financial Leverage. Journal of Finance. September 1973. pp. 911 – 922.
Miller, M. H. (1977). Debt and Taxes. Journal of Finance, 32, pp. 261 – 275.
Modigliani, F. dan Miller, M. H. (1958). The Cost of Capital, Corporation, Finance, and The Theory of Investment. The American Economic Review Vol XLVIII. (3).
Mohamad, N. E. A. B., & Abdullah, F. N. B. A. (2012). Reviewing relationship between capital structure and firm’s performance in Malaysia. International Journal of Advances in Management and Economics, 1(4), 151–156.
Muritala, T. A. (2012). An Empirical Analysis of Capital Structure on Firm’s Performance in Nigeria. International Journal of Advances in Management and Economics. 1 (5), pp. 116 – 124.
Myers, S. C. (1984). Capital Structure Puzzle.Journal of Finance, 39 (3), pp. 575 – 592.
Negash, M. (2001). Debt, Tax Shield, and Bankruptcy Costs: Some Evidence from JSE.
Investment Analysts Journal Vol. 54, pp. 33 – 44.
Nirajini, A. dan Priya, K. B. (2013). Impact of Capital Structure on Financial Performance of the Listed Trading Companies in Sri Lanka. International Journal of Scientific and Research Publications, Vol. 3.
San, O. T. dan Heng, T. B. (2012). Capital Structure and Corporate Performance of Malaysian Construction Sector. International Journal of Humanities and Social Science, Vol. 1 (2), pp. 28 – 36.
Tian, G. G. dan Zeitun, R. (2007). Capital Structure and Corporate Performance: Evidence from Jordan. Australasian Accounting, Business, and Finance Journal, 1 (4).
Titman, S. dan Wessels, R. (1988). The Determinants of Capital Structure Choice. The Journal of Finance, 43 (1), pp. 1 – 19.
Treynor, J. L. (1962). Toward A Theory of Market Value of Risky Assets. Unpublished Manuscript.