The 8th Asian Academy of Management International Conference
Penang Malaysia, 18 - 20 December 2009
ANALYSIS ON THE APPLICATION OF BALANCE SCORECARD METHOD TO
MEASURE PERFORMANCE OF PROPERTY COMPANY
Rudy Aryanto Haryadi Sarjono
Bina Nusantara University [email protected]
ABSTRACT
This paper examines company’s performance of a property company and also a developer by using Balance Scorecard Method viewed from four (4) perspectives namely financial, customer, internal business process and learning and growth. The aim of the research is to discover the performance measurements applied by the company’s performance measurements based on Balance Scorecard Method. The results of the measurements show that the performance of research subject sample PT. Kharisma Persada Tbk is in a good category viewed from the Balance Scorecard Method. The amount of the whole load obtained from the four perspectives is 127, being between the interval 119-146 with the category of Good. Average for each perspective is 2.75 for financial perspective, 4.00 for customers perspective, 5.00 for internal business process perspective and 3.84 for learning and growth perspective, so that the average from four perspectives is 3.89. The conclusion is that the financial perspective has a dissatisfactory performance as the financial ratio produced is low, customer perspective shows that the customers are satisfied with what the company has done, internal business process perspective shows that the company has run its activities effectively, learning and growth perspective shows that the staff are also satisfied with what the company has provided. The comments for this property company is to keep up the current good work and self-mend as well as improve the performance that is still viewed a lack.
Keywords : Performance Measurements, Balance Scorecard, Four Perspectives, Traditional
INTRODUCTION
Competition in the globalized world demands all companies to have the utmost performance. A company’s performance must reflect improvement from one period to the next. However, nowadays financially viewed performance is insufficient to measure the real company’s performance so a tool to measure a company’s performance from various comprehensive perspectives is needed.
To complete financial performance measurement and as one alternative for the company to reflect a new idea in competitiveness and organizational effectiveness, the concept “Balance Scorecard” by Robert S. Kaplan and David P. Norton in 1990 was developed. Balanced Scorecard concept introduced a system to measure a company performance using certain criteria. Those criteria are actually the elaboration of the vision, mission and strategy of a company in a long term measured and monitored continuously through four perspectives namely financial, customers, internal business process and learning and growth. Aside from that, the method could also encourage to evaluate performance objectively.
Based on the above, the writer identifies and discusses several issues as follows: 1. How has the measurement of the performance of property company been?
THEORITICAL REVIEW
The performance evaluation is essential for the company. To win the ever rapid global competitiveness, the performance of the company has to reflect an improvement from one period to the next. However, nowadays financially viewed performance is insufficient to measure the real company’s performance so a tool to measure a company’s performance from various comprehensive perspectives is needed.
In 1990, Nolan Norton Institute, a KPMG research agency in USA, led by David P. Norton as the CEO, Nolan Norton (President of Renaissance Solution, Inc.) together with Robert Kaplan as academic consultant (Accounting Professor Arthur Lowes Dickinson at Harvard Business School), sponsored a study on ”Measurement on Performance of Future Organizations”. This study was motivated by the consciousness that at that time, financial performance measurement used by all companies to measure the executives’ performances was no longer sufficient. The result of the study was published in an article titled “Balanced Scorecard – Measures That Drive Performance” in Harvard Business Review (January-February 1992). The results of the study concluded that to measure the executive performance in the future, a comprehensive measurement is needed using financial, customer, internal business process and learning and growth perspectives.
Where the measurement is called Balance Scorecard that are comprehensive enough to motivate executives in creating performance in four perspectives so that financial successes of the company is sustainable in a long term (Mulyadi, 2001, p2-3). According to Mulyadi (2007, p3) Balanced Scorecard is a contemporary management designed to improve the company’s abilities in multiplying sustainable outstanding financial performance. Gaspersz (2006, p2-3) defined Balanced Scorecard as a management system for a company to have long term investment, customers, learning and growth and internal business process (system), in order to obtain financial successes which enable business organizations to develop rather than just run bottom line to spur short terms successes. According to Yuwono (2004, p8) Balanced Scorecard is a management system, measurements, comprehensive, quick and precise control that can provide understanding to the manager on business performance. The afore-mentioned performance measurements view business units from four perspectives financial, customer, internal business process and learning and growth. Through cause and effect mechanism, financial perspective becomes the lead indicator which is explained by operation indicator upon three other perspectives as drivers.
Source : (http//www.balancedscorecard.org/basics/bsc.html)
Picture 1. The Four Perspectives of Balanced Scorecard
1. Financial Perspective
This measurement aims to discover the company’s ability in producing profit for stakeholders. Measurement is conducted by using financial ratio i.e. liquidity ratio, solvability ratio, profitability ratio and activity ratio.
2. Customer Perspective
MARKET SEGMENT
Picture 2. Customer Perspective : Primary Measurement
According to Yuwono (2004, p32-33) this perspective is a leading indicator. So if there is a dissatisfied customer, he will find other producer that matches his needs. A bad performance from this perspective will decrease the number of customers in the future even though at this stage financial performance looks fine.
3. Internal Business Process Perspective
In this perspective Gaspersz (2006, p59) states that a company should identify the most critical processes to reach an increase in value for customers (Customer Perspective) and an increase in value for stakeholders (Financial
Picture 3. Internal Business Process Perspective : Genetic Value Chain Model
4. Learning and Growth Perspective
Referring to Yuwono’s opinion (2004, p 39), it is said that this learning and growth process came from human resource, system and organization procedures including staff training and corporate cultural attitudes related to both individual and corporate self-improvement. In a knowledge worker organization, people are the main resource. In many cases, learning and growth perspective is a foundation for success to knowledge worker organization by still considering system and organization factors.
Source : Yuwono (2004, p40)
Picture 4. Learning and Growth Perspective : Frame Work
ANALYSIS AND ELABORATION
1. Profit – loss data
During the year 2004, the company booked the company’s revenue Rp. Rp. 52,34 billion, a 26,86% decrease if compared with 2003; a revenue of Rp. 71,56 billion. This decrease is primarily caused by the running out of the sale of stock of apartments and condominiums. Net profit in 2004 was Rp. 3,383 billion, it decreased to 65,89% if compared with 2003 which was Rp. 9,92 billion. The decrease was paralled with the decrease of the company’s revenue.
During the year 2005, the company’s revenue was Rp. 57,113 billion, a 9,12% increase compared with 2004. This increase was primarily contributed by the sale in real estate sector and the income of rent and maintainance of apartments with an increase of 183,39% and 16,21%, respectively. Net profit in 2005 was Rp. 3,325 billion, a 1,69% decrease if compared with 2004 which was Rp. 3,383 billion. The decrease was paralleled with the increase in raw materials, services etcetera as impacts of the increase of fuel price.
In 2006, the company stated that the company’s revenue was Rp. 43,7 billion. It decreased to 23,47% (Rp. 13,4 billion) compared with 2005. The decrease of the income was primarily influenced by the decrease of the sale of residence and real estate which was 16% (Rp. 3,3 billion), and the decrease of apartment rent and maintainance which was 16,82% (Rp. 2,8 billion). Net profit gained by the company in 2006 was Rp. 288,1 million, a 91,34% (Rp. 3 billion) decrease compared with 2005.
Gross Profit and Nett Income Per December 31, 2003-2006
(in million Rupiah)
34,713 40,926 33,754
30,332
9.916 3.383
3.326 288
0 10,000 20,000 30,000 40,000 50,000
2006 2005 2004 2003
Gross Profit
Net Income
Source : PT. Kharisma Persada, Tbk (2008) Financial Report
Picture 5. Gross Profit and Net Income
2. Balance Sheet
In 2004, the company wrote a Rp. 334,22 billion worth of assets or a decrease of 1,97% compared with 2003. The decrease was caused by the decrease of liabilities following the bank installment according to installment schedule. The amount of obligation in 2004 was Rp. 141,636 billion, a decrease compared with 2003 which was Rp. 147,325 billion. The company’s equity was Rp 192,176 billion, a decrease from 2003 which was Rp. 192,713 billion.
In 2005, the company booked a Rp 324,243 billion worth of assets. It decreased to 2,99% compared with 2004 which was Rp. 334,220 billion. The decrease was caused by a decrease in cash and equal to cash 23,71% and investment of 34,81%. The amount of obligation of the company in 2005 was Rp. 129,722 billion. It decreased to Rp. 11,913 billion or 8,41% from 2004. The decrease of obligation amount was caused by the paying of most of bank loan and its special relations with other parties in 2005. The company’s equity in 2005 had an increase of 2,98% compared to 2004 which was from Rp. 334,221 billion to Rp. 324,243 billion.
Property, Plant & Equipment and Total Asset Per December 31, 2003-2006
(in million Rupiah)
91,119 93,819 91,814 93,445
257.412
324.243 334,221 340,946
0 100,000 200,000 300,000 400,000
2006 2005 2004 2003
Fixed Asset
Total Asset
Source : PT. Kharisma Persada, Tbk (2008) Financial Report
Picture 6. Property, Plant & Equipment and Total Asset
Revenue and Equity Per December 31, 2003-2006
(in million Rupiah)
52,341 71,588 57,113
43,710
192,713 192,176
194.102 196.741
0 50,000 100,000 150,000 200,000 250,000
2006 2005 2004 2003
Income
Total Equity
Source : PT. Kharisma Persada, Tbk (2008) Financial Report
Picture 7. Revenue and Equity
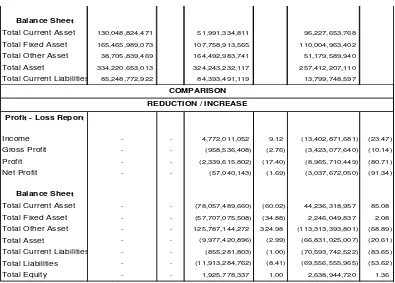
Table 1
PT. Kharisma Persada, Tbk Financial Data (in rupiah) 2004 – 2006 Period
2004 % 2005 % 2006 %
Profit - Loss Report
Revenue 52,341,047,315 57,113,058,367 43,710,186,686
Gross Profit 34,713,399,140 33,754,862,732 30,331,785,092
Operational Profit 13,448,360,460 11,108,744,658 2,143,034,209
Net Profit 3,382,818,480 3,325,778,337 288,106,287
Balance Sheet
Total Current Asset 130,048,824,471 51,991,334,811 96,227,653,768
Total Fixed Asset 165,465,989,073 107,758,913,565 110,004,963,402
Total Other Asset 38,705,839,469 164,492,983,741 51,179,589,940
Total Asset 334,220,653,013 324,243,232,117 257,412,207,110
Total Current Liabilities 85,248,772,922 84,393,491,119 13,799,748,597
Profit - Loss Report
Income - - 4,772,011,052 9.12 (13,402,871,681) (23.47)
Gross Profit - - (958,536,408) (2.76) (3,423,077,640) (10.14)
Profit - - (2,339,615,802) (17.40) (8,965,710,449) (80.71)
Net Profit - - (57,040,143) (1.69) (3,037,672,050) (91.34)
Balance Sheet
Total Current Asset - - (78,057,489,660) (60.02) 44,236,318,957 85.08
Total Fixed Asset - - (57,707,075,508) (34.88) 2,246,049,837 2.08
Total Other Asset - - 125,787,144,272 324.98 (113,313,393,801) (68.89)
Total Asset - - (9,977,420,896) (2.99) (66,831,025,007) (20.61)
Total Current Liabilities - - (855,281,803) (1.00) (70,593,742,522) (83.65)
Total Liabilities - - (11,913,284,762) (8.41) (69,556,555,965) (53.62)
Total Equity - - 1,925,778,337 1.00 2,638,944,720 1.36
COMPARISON
REDUCTION / INCREASE
Source : PT. Kharisma Persada, Tbk (2008) Financial Report
Performance Measurement on PT. Kharisma Persada, Tbk using Balanced Scorecard Method
• Financial Perspective
This perspective uses financial analysis ratio which consists of liquidity ratio, solvability ratio, profitability ration and activity ratio where the results of the calculation are obtained as follows:
Table 2
PT. Kharisma Persada, Tbk. Financial Ratio Analysis 2004 – 2006 Period
Liquidity Ratio
Current Ratio 1,53 times 0,62 times 6,97 times
Quick Ratio 0,54 times 0,40 times 5,67 times
Liability Ratio on Capital 0,74 times 0,67 times 0,31 times
Liability Ratio on Assets 0,42 times 0,40 times 0,23 times
Net Profit Margin 6.46% 5.82% 0.66%
Gross Profit Margin 66.32% 59.10% 69.39%
Operation Profit Margin 25.69% 19.45% 4.90%
Return on Equity 1.76% 1.71% 0.15%
Return on Asset 1.01% 1.03% 0.11%
Account Receivable Turn Over 20,70times 12,76times 7,66 times
Fixed Asset Turn Over 0,32times 0,53 times 0,40 times
Total Asset Turn Over 0,16 times 0,18 times 0,17 times
Activity Ratio Solvability Ratio
Profitaibily Ratio
Based on the above data calculations, we can conclude that the financial ratio of PT. Kharisma Persada, Tbk is low enough especially the profitability ratio which was still suffering from a decrease year by year; the ROE in 2004 was 1,76% and it became 1,71% in 2005 and a pretty significant decrease in 2006 to 0,15%. This shows that the ability of the company to produce profit for stakeholders is still low.
• Customer Perspective
In Customer Perspective, data was obtained from a questionnaire which was distributed to 150 randomly selected customers as respondents. The results of the average calculation obtained is as follows:
3,70 + 3,43 + 3,83 + 3,58 + 3,33 + 3,49 = 3,56
6
Percentage level of customers’ satisfaction on the whole is:
73, 94% + 68,53% + 76,53% + 71,47% + 66,67% + 69,87% = 71,34% 6
The above results show that the customers’ satisfaction is 71,34% which means that the customers are in the satisfied category toward what PT. Kharisma Persada, Tbk has done all these years.
• Internal Business Process Perspective
The measurement in this perspective covers three operation processes among others: a. Check-in Process
MCE = 60 minutes
10 minutes + 5 minutes + 1 minutes + 5 minutes + 1 minutes + 5 minutes + 5 minutes + 10 minutes + 1 minutes + 10 minutes + 5 minutes + 3 minutes + 3 minutes + 3 minutes
= 60 minutes = 0,8955 67 minutes
b. Check-out Process
MCE = 60 minutes
5 minutes + 5 minutes + 10 minutes + 10 minutes + 5 minutes + 5 minutes + 15 minutes = 60 minutes = 1,0909
55 minutes
c. Complaint Handling Process MCE = 30 minutes
2 minutes + 3 minutes + 3 minutes + 10 minutes + 5 minutes = 30 minutes = 1,3043
23 minutes
Based on the above calculations, we can conclude that PT. Kharisma Persada, Tbk in conducting its operation process has reached the predetermined target.
• Learning and Growth Perspective
The measurement in this perspective covers the measurement of employee profitability ratio and employee satisfaction level by distributing questionnaire to 70 employees of PT. Kharisma Persada, Tbk which were randomly selected as respondents.
The average by the employees on the whole is ;
3,26 + 3,76 + 3,93 + 4,06 + 2,70 + 3,47 + 3,47 + 3,24 + 2,99 + 3,80 + 3,44 + 3,66
= 3,48 12
Percentage of the employees’ satisfaction on the whole is:
65,14% + 75,14% + 78,57% + 81,14% + 54% + 69,43% + 69,43% + 64,86% + 59,71% + 76% + 68,86% + 73,71%
12 = 69,67%
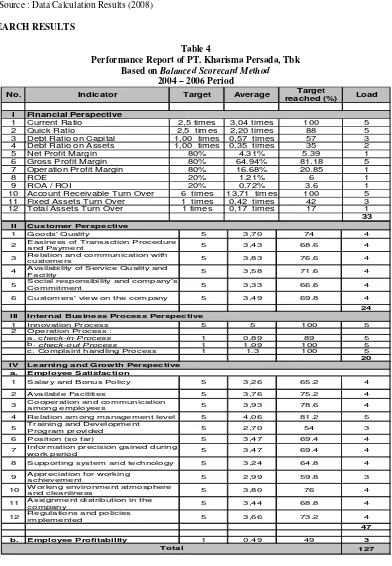
Table 3
PT. Kharisma Persada, Tbk Employee Profitability 2004 – 2006 Period
Performance Report of PT. Kharisma Persada, Tbk Based on Balanced Scorecard Method
2004 – 2006 Period
I
1 Current Ratio 2,5 times 3,04 times 100 5
2 Quick Ratio 2,5 times 2,20 times 88 5
3 Debt Ratio on Capital 1,00 times 0,57 times 57 3
4 Debt Ratio on Assets 1,00 times 0,35 times 35 2
5 Net Profit Margin 80% 4.31% 5.39 1
6 Gross Profit Margin 80% 64.94% 81.18 5
7 Operation Profit Margin 80% 16.68% 20.85 1
8 ROE 20% 1.21% 6 1
9 ROA / ROI 20% 0.72% 3.6 1
10 Account Receivable Turn Over 6 times 13,71 times 100 5
11 Fixed Assets Turn Over 1 times 0,42 times 42 3
12 Total Assets Turn Over 1 times 0,17 times 17 1
33
1 Innovation Process 5 5 100 5
2 Operation Process :
a. check-in Process 1 0.89 89 5
b. check-out Process 1 1.09 100 5
c. Complaint handling Process 1 1.3 100 5
20
a.
2 Available Facilities 5 3,76 75.2 4
4 Relation among management level 5 4,06 81.2 5
6 Position (so far) 5 3,47 69.4 4
b. Employee Profitability 1 0.49 49 3
Based on the above results, we can conclude that the load of the whole perspective of PT. Kharisma Persada, Tbk Balanced Scorecard is as follows; Financial perspective is 33, Customer perspective is 24, Internal Business Process perspective is 20, and Learning and Growth perspective is 50, then the whole load obtained is 127 and if it is categorized into 5 class interval, it is in the category 4 which is good.
CONCLUSION
Based on the conducted analysis and research results, the writer concludes as follows:
a. Financial Performance
PT. Kharisma Persada, Tbk Financial Performance measured by the whole financial ratio calculation is still lacking as the ratio produced was still very low and it has not reached the predetermined target that the average was 2,75 which means that the company must improve its financial performance to gain its purpose.
b. Customer Performance
This perspective measures how far customer satisfaction level toward what the company has done all these years is. The results of the measurement gained by distributing questionnaire to the customers of PT. Kharisma Persada, Tbk showed a good result with the average of 4,00 which means the customers are satisfied by what the company has provided.
c. Internal Business Process Performance
This perspective measures how effective the innovation and operation processes conducted by the company are in fulfilling the needs of its customers. The results of the measurements showed that the innovation and operation processes have been well conducted with the average of 5,00 which means the company was able to run its operations well.
d. Learning and Growth Performance
This perspective measures how satisfied the employees with what the company has given all these years are and measures the profitability level from each employee for the company. The results of the measurements were obtained by distributing questionnaire to the employees of PT. Kharisma Persada, Tbk and they showed good result where the average obtained was 3,84 which means that employees are satisfied enough toward what the company has provided all these years.
BOOK REFERENCES
Gaspersz, Vincent, 2006. Sistem Manajemen Kinerja Terintegrasi Balanced ScoreCard dengan Six Sigma Untuk Organisasi Bisnis dan Pemerintah, PT. Gramedia Pustaka Utama, Jakarta.
Kaplan, R., Norton, D.P, 2000. Balanced ScoreCard : Menerapakan Strategi menjadi Aksi, Erlangga, Jakarta. Mulyadi, 2001. Balanced ScoreCard : Alat Manajemen Kontemporer untuk Pelipatgandaan Kinerja Keuangan
Perusahaan, Penerbit Salemba Empat, Jakarta.
Munawir, 2004. Analisa Laporan Keuangan, Penerbit Liberty, Yogyakarta.
Niven, Paul R. 2002. Balanced ScoreCard Step-by-Step : Maximizing Performance and Maintaining Results, Penerbit John Wiley & Sons, Inc., New York,
PT. Kharisma Persada, Tbk. 2007. Financial Report 2004 – 2006 Period, Jakarta
Sundjaja, Ridwan S. 2003. Manajemen Keuangan Jilid 2 Edisi 4, Penerbit Literata Lintas Media, Jakarta. Supranto J. 2003. Metode Penelitian Hukum dan Statistik, Penerbit Rineka Cipta, Jakarta.
Umar, Husein. 2002. Metode Riset Komunikasi Organisasi, Penerbit PT. Gramedia Pustaka Utama, Jakarta Umar, Husein. 2005. Evaluasi Kinerja Perusahaan, Penerbit PT. Gramedia Pustaka Utama, Jakarta
Yuwono et al. 2003. Petunjuk Praktis Penyusunan Balanced ScoreCard Menuju Organisasi Yang Berfokus pada Strategi Cetakan kedua, Penerbit PT. Gramedia Pustaka Utama, Jakarta.