Phylogenetic Tree of Kuantan Cattle by DNA Barcoding
Hidayati1,2, Misrianti R1,2, Ali A2
1Breeding and Genetic Laboratory, Agricultural and Animal Science Faculty 2Agricultural and Animal Science Faculty
State Islamic University of Sultan Syarif Kasim - Riau
Kampus II Raja Ali Haji Jl. HR.Soebrantas Nomor 15 Simpang Baru Panam Pekanbaru 28293 E-mail: [email protected]
(received 05-01-2016; revised 15-03-2016; 21-03-2016)
ABSTRAK
Hidayati, Misrianti R, Ali A. 2016. Pohon filogenetik sapi Kuantan menggunakan DNA barcode. JITV 21(1): 41-48. DOI: http://dx.doi.org/10.14334/jitv.v21i1.1351
Sapi kuantan merupakan breed sapi potong lokal Riau yang belum diketahui asal usulnya. Sapi kuantan banyak ditemukan di daerah Kabupaten Indargiri Hulu dan Kabupaten Kuantan Singingi. Berdasarkan tampilan fenotipe, sapi kuantan mirip dengan sapi pesisir (bangsa sapi potong lokal Sumatera Barat). Menurut beberapa peternak, asal-usul sapi kuantan merupakan sapi pesisir yang dibawa oleh perantau minang ke daerah ini. Tujuan penelitian ini untuk membuktikan apakah asal usul sapi kuantan merupakan sapi pesisir melalui analisis keragaman genetik menggunakan DNA barcode. DNA barcode yang digunakan adalah gene Cytochrome oxidase sub unit I, merupakan salah satu gene yang ditemukan pada DNA mitochondria. Isolasi DNA berhasil dilakukan pada 25 sampel darah sapi kuantan betina dewasa dan 18 sampel darah sapi pesisir betina dewasa. Amplifikasi ruas gene COI menggunakan metode Polymerase Chain Reaction. Primer forward yang digunakan dalam penelitian ini adalah F’5 TTCTCAACCAACCATAAAGATATTGG-3’ dan primer reverse 5’-TAGACTTCGGGGTGTCCAAAGAATCA-3’, mengapit ruas gene COI sapi kuantan dan sapi pesisir dari basa 5711 – 6420 (Genebank nomor akses NC_005971) sepanjang 710 bp. Hasil analisis sekuens menggunakan Program MEGA 5.2 menunjukkan bahwa ditemukan 6 titik polimorpik yang membentuk 7 haplotype pada sapi kuantan dan 9 titik polimorfik yang membentuk 12 haplotype pada sapi pesisir. Hasil analisis jarak genetik dan phon filogenetik menunjukkan bahwa sapi kuantan dan sapi pesisir berada pada kelompok yang sama dengan Bos indicus. Mutasi pada ruas gene COI sangat kecil dan belum dapat menjelaskan perbedaan diantara breed. Hasil penelitian ini juga menegaskan bahwa berdasarkan garis keturunan induk asal usul sapi kuatnan adalah dari Bos indicus sama seperti sapi pesisir.
Kata Kunci: Gene COI, Polimorfik, Sapi Kuantan, Jarak Genetik, Pohon Filogenetik
ABSTRACT
Hidayati, Misrianti R, Ali A. 2016. Phylogenetic tree of Kuantan cattle by DNA barcoding. JITV 21(1): 41-48. DOI: http://dx.doi.org/10.14334/jitv.v21i1.1351
Kuantan cattle is one of local beef cattle breed of Riau Province which its origin was unknown. Kuantan cattle are commonly found in Indragiri Hulu and Kuantan Singingi Regency. Based on phenotype characterizations, kuantan cattles are similar with pesisir cattle (West Sumatera beef cattle). Historically, kuantan cattle were pesisir cattle brought by “minang” immigrants (Immigrant from West Sumatera) to this region. The purpose of this study was to analyze the origin of the kuantan cattle through genetic diversity analysis using DNA barcode. DNA barcode used was Cytochrome oxidase subunit I gene which was found in the mtDNA. DNAisolation was done on 25 kuantan’s blood samples and 18 pesisir blood samples. Amplification of COI gene segment used Polymerase Chain Reaction technique. The forward primer sequence used in this study was F’5 TTCTCAACCAACCATAAAGATATTGG-3’ and the reverse primer sequence used was reverse 5’ -TAGACTTCGGGGTGTCCAAAGAATCA-3. It squeezed kuantan and pesisir sequence 5711 - 6420 base (GeneBank accession number NC_005971) with length by 710 bp. Analysis result of sequence using MEGA 5.2 Program showed that there were 6 polymorphic sites establishing 7 haplotypes on kuantan cattle and 9 polymorphic sites establishing 12 haplotypes on pesisir cattle. Based on genetic distance and phylogeney tree, kuantan and pesisir cattle were in same group with Bos indicus. Mutation in the COI gene segment in this study was too small and was not able to distinguish the difference of those breeds. The result of neighbor joining analyze indicated that kuantan cattle origin was from Bos indicus just like pesisir cattle.
Key Words: COI Gene, Polymorphic, Kuantan Cattle, Genetic Distance, Phylogenetic Tree
INTRODUCTION
Kuantan cattle, one of local beef cattle breed of Riau
Province which was registered as
No.1052/Kpts/S.R.120/10/2014 by Ministry of
extensive and semi intensive system for a long term. According to Misrianti (2014), dominant color of kuantan cattle was white-brown with upward-curved horns and white legs. Phenotypically, kuantan cattle are similar with pesisir cattle and historically, kuantan cattle were pesisir cattle brought by “minang”
immigrants (from West Sumatera) to this region. The development of every species under its particular natural ecosystem, environmental, and socio-economic conditions has led to each having its own specific genetic characteristics (Yang et al. 2013). Domestication of livestock species and a long history of migrations, selection and adaptation have created an enormous variety of breeds (Hailu & Getu 2015). The most domestic cattle in Indonesia belong to Bos taurus or Bos indicus while Indonesian Bali cattle was domesticated form banteng (Bos javanicus) (Kusdiantoro et al. 2009)
One of conventional methods applied in animal genetic resources assessment is morphological markers. Morphological markers, normally refer to external
animal characteristics (animal’s phenotype), which can
be obtained by direct visual observation and
measurement. Animal’s phenotype is determined by its
genetic, environment and interaction of both. Evolution of farm animal genetic resources through morphological markers based on subjective judgments and descriptions and the conclusions reached were often not completely accurate. Information on genetic diversity and origin of kuantan cattle has not been reported.
Determination of breed or line of livestock by Indonesian government was aimed to guarantee the utilization and conservation of animal genetic resources in a sustainable manner, as well as legal protection providing for breed or lines of the existing livestock. Management of animal genetic resources is essential for the achievement of global food security emphasizing global food production, improvement of productivity and food availability. People may use genetic resources to develop animal production to meet food requirement. However, sufficient genetic markers for evaluating population structure and other aspect of animal genetic resources require genetic diversity assessment. One method for population characterization was DNA barcoding (Yang et al. 2013; Hailu & Getu 2015). A DNA barcode was a short DNA sequence from a standardized region of the mitochondrial DNA gene,
advantages of COI gene as a DNA barcode were (1) a relatively short length of the gene which was about 648 bp, (2) relatively stable and not prone to mutation, (3) variability was very low 1-2%, (4) much amount of copies was easily to be amplified than genes –gene nuclear DNA (Sutrisno et al. 2013).
Some research reports using DNA barcode on birds (Herbert et al. 2004), Indonesian local cattle (Febriana 2011), chicken (Gao et al. 2011), cetartiodactyla (Zein & Fitri 2012), bali cattle (Syed-Shabthar et al. 2013) and Indonesian local buffalo (Saputra et al. 2013) has been reported.
This study was aimed to obtain phylogenetic tree of kuantan cattle and to study whether pesisir cattle was the origin of the kuantan cattle based on DNA barcoding.
MATERIALS AND METHODS
Materials
Blood samples of more than two years old kuantan cow (n=25) from Kuantan Singingi (Riau Province) (Figure 1) and more than two years old pesisir cow (n=18) from central of superior cattle-forage breeding of Padang Mengatas, West Sumatera (Figure 2) were collected from jugular vein using 3 mL syringe. Those blood samples were preserved in EDTA and kept in room temperature from October to November 2015 for laboratory analysis.
DNA isolation
DNA isolation was done in Animal Molecular Genetic Laboratory, Bogor Agricultural University on November 2015. Genomic DNA was extracted using Phenol-chloroform Technique (Sambrook et al. 1989) and modified by buffer lysis cell use (250 µL 1 X STE, 40 µL SDS and 10 µL Proteinase-K). The DNA was
Figure 1. Kuantan cattle in Kuantan Singingi Regency, Riau Province
Figure 2. Pesisir cattle in central of superior cattle-forage breeding of Padang Mengatas, Lima Puluh Kota, West Sumatra
5581 tctgaatttg caattcaacg tgtaaattca ccacagagct tggtaaaaag aggagtcaaa 5641 cctctatctt tagatttaca gtctaatgct ttgctcagcc attttaccca tgttcattaa
5701 ccgctgacta ttctcaacca accataaaga tattggtacc ctttacctac tatttggtgc
5761 ttgggccggt atagtaggaa cagctttaag ccttctaatt cgcgctgaat taggccaacc 5821 cggaactctg ctcggagacg accaaatcta caacgtagtt gtaaccgcac acgcatttgt 5881 aataatcttc tttatagtaa taccaatcat aattggaggg ttcggtaact gacttgttcc 5941 cctaataatt ggtgctcccg atatagcatt tccccgaata aataatataa gcttctgact 6001 tctccctccc tcattcctac tactcctcgc atcctctata gttgaagctg gggcaggaac 6061 aggctgaacc gtgtaccctc ccttagcagg caacctagcc catgcaggag cttcagttga 6121 tctaaccatt ttctctttac acttagcagg agtttcctca attttaggag ccatcaactt 6181 cattacaaca attatcaaca taaagccccc cgcaatgtca caataccaaa cccctctatt 6241 cgtatgatcc gtaataatta ccgccgtact actactactc tcgctccctg tattagcagc 6301 cggcatcaca atgctattaa cagaccggaa cctaaataca actttcttcg acccggcagg
6361 aggaggagat cctattctat accaacactt attctgattc tttggacacc ccgaagtcta
6421 tattttaatc ttacctggat ttggaataat ctctcatatc gtaacctact actcaggaaa
Figure 3. BICOI amplicon sequence, Genebank NC_005971. The primers sites were underlined and bold
Qualitative and quantitative test of DNA isolation
Qualitative test of DNA isolated was used on 1% agarose gel electrophoresis in 1XTAE solution. Electrophoresis was run at 100 volts for 35-40 minutes. Determination of concentration and purity level of the isolated DNA used spectrophotometry on 5 samples of the isolated DNA randomly.
DNA amplification and direct sequencing method
DNA was amplified using Polymerase Chain Reaction (PCR) technique carried out in Genetic and Breeding Laboratory, Faculty of Agricultural and Animal Science, Islamic State University of Sultan Syarif Kasim Riau on November 2015 - January 2016. Each PCR reaction was made with cocktail 50 ng (2-3
μL) DNA templates, 0.25 μM forward and reverse
primer, 12.5 μL Dream Tag Green Master Mix from Thermo Scientific #K1081 and dH2O up to 25 μL. The forward primer sequence was F’5
TTCTCAACCAACCATAAAGATATTGG-3’ and
reverse primer sequence was reverse 5’
-TAGACTTCGGGGTGTCCAAAGAATCA-3’, in
accordance with Febriani (2013). Position of forward and reverse primer in PCR product of COI gene was shown in Figure 3. Samples were initially denaturized at 93°C for 3 minutes and followed by 35-36 cycles of denaturation at 93°C for 30 second, annealing at 60°C for 30 second and extension at 72°C for 30 second. Final extension was at 72°C for 5 minutes. Master Cycler Personal 22331 Eppendorf was used for PCR amplification. PCR products were then separated on
1.5% agarose/1 x TAE, stained with 2.5 μL of
Results of sequences fragment of COI gene were analyzed with BioEdit (Hall 2011), MEGA version 5.2 software (Tamura et al. 2011). BLAST sequence was obtained from Gene Bank with accession number of KF 952276, KF 771228, KF 952284, KF 952285, HQ860420.1, HM 102290.1, KF771228.1, FJ 958333 and JX 218056.1. Method of neighboor-joining with
Qualitative method for identification, separation and purification of DNA fragments was by agarose gel electrophoresis (Fachtiyah, et al. 2011). DNA which might migrate on agarose gel or polyacrylamide gel was placed in a buffer solution which electrified in chamber. Negatively DNA will be moving positive direction. The success of DNA isolation characterized by a single band, bright and cleared in each well (Figure 4).
M X1 X2 X3 X4 X5 X6 X7 X8 X9 X10 X11 X12 13 14
Figure 4. Qualitative test of DNA isolated
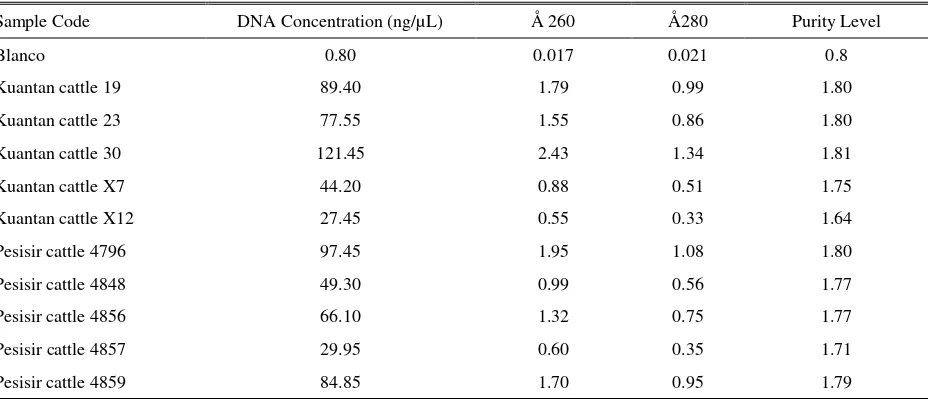
Table 1. Concentration and Purity Level of Isolated DNA
Sample Code DNA Concentration (ng/µL) Å 260 Å280 Purity Level
Blanco 0.80 0.017 0.021 0.8
Kuantan cattle 19 89.40 1.79 0.99 1.80
Kuantan cattle 23 77.55 1.55 0.86 1.80
Kuantan cattle 30 121.45 2.43 1.34 1.81
Kuantan cattle X7 44.20 0.88 0.51 1.75
Kuantan cattle X12 27.45 0.55 0.33 1.64
Pesisir cattle 4796 97.45 1.95 1.08 1.80
Pesisir cattle 4848 49.30 0.99 0.56 1.77
Pesisir cattle 4856 66.10 1.32 0.75 1.77
Pesisir cattle 4857 29.95 0.60 0.35 1.71
Pesisir cattle 4859 84.85 1.70 0.95 1.79
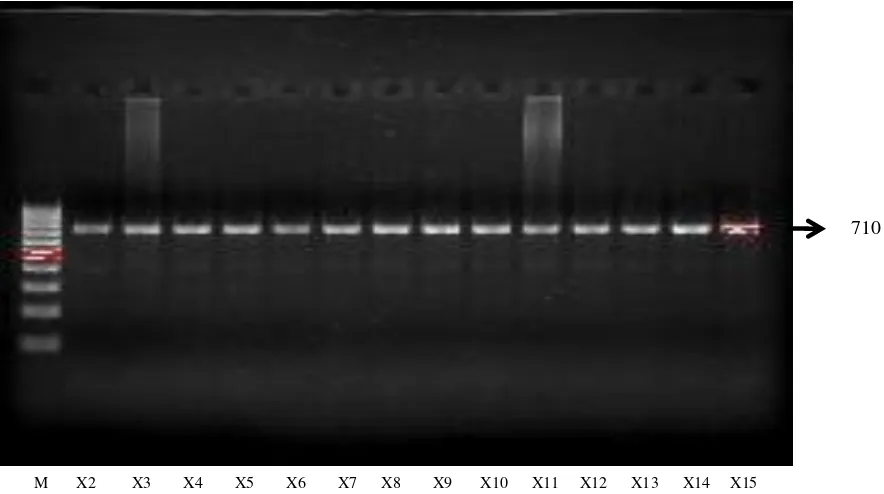
Figure 5. PCR amplification product of COI Gene (710 bp); M = DNA ladder 100 bp, X2, X3..Xn = samples codes
Concentration of isolated kuantan’s DNA was 27.45-121.45 ng/µL with a purity level of 1.64 to 1.81 (Table 1). DNA concentration of pesisir cattle was 29.9597.45 ng/µL with purity level of 1.71 to 1.80. Good purity levels of DNA isolated were 1.8 to 2.0. If the value exceeds of 2.0, the solution tested was still contaminated by membrane protein or other compounds so that the levels of plasmid DNA obtained was not pure. If it was less than 1.8, it means that too much ddH2O was taken while DNA taken was too slightly. The success of PCR process was determined by accurately and level of concentration of DNA used as a template. The range of concentrations of DNA used in the PCR process was 25-50 ng/mL.
Primer has amplified COI gene of kuantan cattle and pesisir cattle successfully. It was indicated by the appearance of a single band at 710 bp (Figure 5). Annealing temperature was 600C for 45 seconds.
Diversity of COI gene on Kuantan and Pesisir cattle
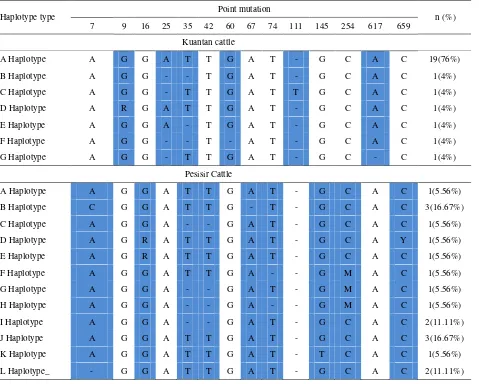
Alignment of 25 kuantan cattle sequences showed six point mutations (c.9, c.25, c.35, c.60, c.111, c.617) forming seven haplotypes (A, B, C, D, E, F and G) (Table 2). The A haplotype was dominant (76%, n=19) on Kuantan cattle. The B (n=X2), C (X5); D (15); E (19); F (X7) and G haplotype (X) of kuantan cattle were detected 4% separately. On pesisir cattle it showed nine point mutations (c.7, c.16, c.35, c.42, c.67, c.74, c.145, c.254 and c.659) forming twelve haplotypes (A, B, C, D, E, F, G, H, I, J, K and L) (Table 2). The A haplotype on kuantan cattle and pesisir cattle was
exactly similar. The A haplotype on kuantan cattle was the highest proportion (76%) on population than the B and J haplotypes on pesisir cattle (16.67%).
Genetic distance and phylogeny tree of COI gene on Kuantan and Pesisir cattle
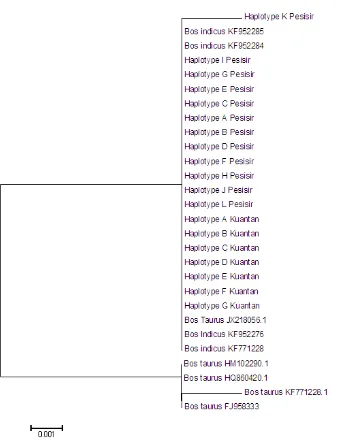
Results of the analysis of genetic distance showed that kuantan and pesisir cattle might be grouped into Bos indicus because it had a genetic distance of 0.000 in all haplotypes, except on K Haplotype on pesisir cattle (0.002). Genetic distance of kuantan cattle and Bos taurus was in the range of 0.10 to 0.12. This result explains that based on the DNA barcode, kuantan cattle is in the same cluster with Bos indicus as well as pesisir cattle, aceh cattle and PO cattle. Cattle breeds have been developed in different ways depending on regional climates, nutritional conditions and selection for different purposes. Genetic drift also contributed in the process of breed differentiation. In very closely related breeds, the number of mutations cannot explain the observed genetic variation even when highly mutable DNA sequences are used.
The result was in accordance with Mitchell et al. (2010) who said that the genetic diversity of COI gene in the Bovidae was between 0.0 -1.92% (average 0.245) and 9.77% in average between the species. Genetic distance in the Bos, Capra, and Ovis genus was 3.5%, 0.0%, 0.003% respectively. Genetic distance between javanicus - indicus and javanicus - taurus species was 0.066% and 0.014%, respectively (Zein and Fitri, 2012). In this study, genetic distance between kuantan M X2 X3 X4 X5 X6 X7 X8 X9 X10 X11 X12 X13 X14 X15
value) and mutations might be neglected during 200
generations (Laval et al. 2002). showed that based on the maternal line, the ancestor of kuantan cattle was Bos indicus as well as pesisir cattle.
Table 2. Type of haplotype of Kuantan and Pesisir cattle
Haplotype type Point mutation n (%)
7 9 16 25 35 42 60 67 74 111 145 254 617 659
Kuantan cattle
A Haplotype A G G A T T G A T - G C A C 19(76%)
B Haplotype A G G - - T G A T - G C A C 1(4%)
C Haplotype A G G - T T G A T T G C A C 1(4%)
D Haplotype A R G A T T G A T - G C A C 1(4%)
E Haplotype A G G A - T G A T - G C A C 1(4%)
F Haplotype A G G - - T - A T - G C A C 1(4%)
G Haplotype A G G - T T G A T - G C - C 1(4%)
Pesisir Cattle
A Haplotype A G G A T T G A T - G C A C 1(5.56%)
B Haplotype C G G A T T G - T - G C A C 3(16.67%)
C Haplotype A G G A - - G A T - G C A C 1(5.56%)
D Haplotype A G R A T T G A T - G C A Y 1(5.56%)
E Haplotype A G R A T T G A T - G C A C 1(5.56%)
F Haplotype A G G A T T G A - - G M A C 1(5.56%)
G Haplotype A G G A - - G A T - G M A C 1(5.56%)
H Haplotype A G G A - - G A - - G M A C 1(5.56%)
I Haplotype A G G A - - G A T - G C A C 2(11.11%)
J Haplotype A G G A T T G A T - G C A C 3(16.67%)
K Haplotype A G G A T T G A T - T C A C 1(5.56%)
Figure 6. Phylogeny tree of Kuantan cattle by Neighboor-Joining Method
CONCLUSION
Results of sequence analysis using the program MEGA 5.2 showed six point mutations which established 7 haplotypes on kuantan cattle. Nine point mutations on pesisir cattle established 12 haplotypes. Based on genetic distance, kuantan and pesisir cattle were in same group with Bos indicus. Mutations in the COI gene segment of kuantan and pesisir cattle in this study were too small and the difference cannot be clearly explained. The results of neighbor joining analysis indicated that the origin of the kuantan cattle was Bos indicus based on maternal lineage.
ACKNOWLEDGEMENT
Thanks to the Director of Islamic Higher Education, for providing a financial support through The Collective Competitive Research Ministry of Religious Affairs in 2015 with contract number Reg. PST/86/2015.
REFERENCES
10.3923/javaa.2011.1711.1713.
Hailu A, Getu A. 2015. Breed characterization tools and their applications. Int J Genet. 5:7-14. doi: 10.5829/idosi.ijg. 2015.5.1.92187
Hall T. 2011. BioEdit: An important software for molecular biology. GERF Bull Biosci. 2:60-61.
Hartl DL, Clark Ag. 1997. Principles of population genetic. Massachusetts (USA): Sinauer Associates Inc.
Hebert PDN, Cywinska A, Ball SL, de Waard JL. 2003. Biological identification through DNA barcodes. Philos Trans Ser B. 270:313-321. doi: 10.1098/rspb.2002. 2218.321.
Kusdiantoro M, Olsson M, van Tol HTA, Mikko S, Vlamings BH, Andersson G, Rodriguez-Martinez H, Purwantara B, Paling RW, Colenbrander B, Lenstra JA. 2009. On the origin of Indonesian cattle. PLos One. 4:1-6.
Laval G, San Cristobal M, Chevalet C. 2002. Measuring genetic distance between breeds: Use of same distances in various short term evolution models. Genet Sel Evo. 34:481-507. doi: 10.1051/gse:2002019.
Li W, de Graur D. 1991. Fundamental of molecular evolution. Sunderland (UK): Sinauer Associates, Inc.
Lunt DH, Zhang DS, Zhimura DM, Dewit GM. 1996. The insect cytochrome oxidase I gene: evolutionary pattern and conserve primer for phylogenetics studies. Insect Mol Biol. 5:153-165. doi: 10.1111/j.1365-2583.1996.tb00049.x.
Mitchell JE, Greta LM, Sergion OK, Mathew SL, Andrew PM, George A. 2010. Barcoding busmeat: Molecular identification of Central African and South American Harvested Vertebrates. Conserv Genet. 11:1389-1404.
swamp buffaloes in Indonesia. Media Peternakan. 36:165-170. doi: 10.5398/medpet.2013.36. 3.165. Sutrisno H, Zein MSA, Sulandari S. 2013. DNA barcode. In:
Zein MSA, Prawiradilaga DM, editors. DNA barcode fauna Indonesia. Jakarta (Indones): Kencana.
Syed-Shabthar SM, Rosli MK, Mohd-Zin NA, Romaino SM, Fazly-Ann ZA, Mahani MC, Abas-Mazni O, Zainuddin R, Yaakop S, Md-Zain BM. 2013. The moleculer phylogenetic signature of Bali cattle revealed by maternal and paternal markers. Mol Biol Rep. doi: 10.1007/s11033-013-2619-y.
Taberlet P. 1996. The use of mitochondrial DNA control region sequencing in conservation genetics. In: Smith TB, Wayne RK, editors. Molecular genetic approaches in conservation. New York (USA): Oxford University Press. p. 125-142.
Tamura K, Dudley J, Nei M, Kumar S. 2011. MEGA software (version 5): Molecular evolutionary genetics analysis. Center of Evolutionary Functional Geneomics Biodesign Institute. Arizona State University.
Wilson JJ. 2010. Assessing the value of DNA barcodes and other priority gene regions for molecular phylogenetics of Lepidoptera. PLos One. 5:e10525. doi: 10.1371/journal.pone.0010525.
Yang W, Kang X, Yang Q, Lin Y, Fang M. 2013. Review on the development of genotyping methods for assessing farm animal diversity. J Anim Sci Biotech. 4:1-6. Yuwono T. 2006. Teori dan aplikasi polymerase chain
reaction. Yogyakarta (Indones): Andi.