REGULAR ARTICLE
Woody plant encroachment impacts on soil carbon
and microbial processes: results from a hierarchical
Bayesian analysis of soil incubation data
Jessica M. Cable&Kiona Ogle&Anna P. Tyler& Mitchell A. Pavao-Zuckerman&Travis E. Huxman
Received: 23 September 2008 / Accepted: 18 December 2008 / Published online: 15 January 2009 #Springer Science + Business Media B.V. 2009
Abstract Belowground processes and associated plant–microbial interactions play a critical role in how ecosystems respond to environmental change. However, the mechanisms and factors controlling processes such as soil carbon turnover can be difficult to quantify due to methodological or logistical con-straints. Soil incubation experiments have the potential to greatly improve our understanding of belowground carbon dynamics, but relating results from laboratory-based incubations to processes measured in the field is challenging. This study has two goals: (1) development of a hierarchical Bayesian (HB) model for analyzing
soil incubation data and complementary field data to gain a more mechanistic understanding of soil carbon turnover; (2) application of the approach to soil incubation data collected from a semi-arid riparian grassland experiencing encroachment by nitrogen-fixing shrubs (mesquite). Soil was collected from several depths beneath large-sized shrubs, medium-sized shrubs, grass, and bare ground—the four primary microsite-types found in this ecosystem. We measured respiration rates from substrate-induced incubations, which were accompanied by measurements of soil microbial biomass, soil carbon, and soil nitrogen. Soils under large shrubs had higher respiration rates and support 2.0, 1.9, and 2.6 times greater soil carbon, microbial biomass, and microbial carbon-use efficien-cy, respectively, compared to soils in grass microsites. The effect of large shrubs on these components is most pronounced near the soil surface where microbial carbon-use efficiency is high because of enhanced litter quality. Grass microsites were very similar to bare ground in many aspects (carbon content, microbial biomass, etc.). Encroachment of mesquite shrubs into this semi-arid grassland may enhance carbon and nutrient cycling and increase the spatial heterogeneity of soil resource pools and fluxes. The HB approach allowed us to synthesize diverse data sources to identify the potential mechanisms of soil carbon and microbial change associated with shrub encroachment.
Keywords Decomposition . Respiration . Soil nitrogen . Sonoran desert .Prosopis velutina DOI 10.1007/s11104-008-9880-1
Responsible Editor: Klaus Butterbach-Bahl.
J. M. Cable (*)
:
K. OgleDepartment of Botany, University of Wyoming, Laramie, WY 82071, USA
e-mail: [email protected] e-mail: [email protected]
K. Ogle
Department of Statistics, University of Wyoming, Laramie, WY 82071, USA
A. P. Tyler
:
M. A. Pavao-Zuckerman:
T. E. Huxman Department of Ecology and Evolutionary Biology, University of Arizona,Tucson, AZ 85721, USA
T. E. Huxman
Introduction
Belowground processes are critical drivers of ecosys-tem dynamics (Ritz et al. 1994; Wardle 2002), and thus, they are important for understanding and predicting whole-ecosystem dynamics. For example, plant roots and soil microorganisms are key players in soil and ecosystem carbon cycling (e.g., Schimel et al. 1994; Williams et al.1998; Wullschleger et al.1994). Moreover, microbial decomposition of soil carbon is a major conduit for the loss of CO2from the soil to the atmosphere (Raich and Potter 1995), potentially contributing to climate change (Houghton et al.1998; Raich and Schlesinger 1992). In-turn, microbial-mediated soil carbon fluxes are being altered by climate change, either directly via the impacts of elevated temperatures and an altered hydrological cycle (Austin et al. 2004; Kirschbaum 1995; Raich
and Schlesinger 1992; Saleska et al. 1999), or
indirectly through changes in vegetation structure (Huxman et al. 2004; Raich and Schlesinger 1992; Waldrop and Firestone 2006). Although important, belowground processes can be difficult to directly measure, but unraveling such mechanisms is neces-sary for building a predictive framework of how belowground carbon cycling will respond to and
feedback to global change (Hunt and Wall 2002;
Saetre and Stark 2005).
Soil incubations are commonly used to unravel the mechanisms underlying soil carbon dynamics with respect to soil respiration or CO2efflux (e.g., Dutta et al.2006; Saetre and Stark2005; Schuur and Trumbore 2006; Zak and Kling2006). Generally, soil is collected in the field and is brought to the lab, treatments are applied to the soil samples, samples are“incubated”in controlled conditions, and CO2 efflux is measured. Incubation treatments may include labile carbon (e.g., sugar) substrate additions to determine active microbial biomass (Fliessbach et al. 1994), microbial diversity (Lin and Brookes 1999; Schipper et al. 2001), or variation in microbial substrate use (Hamer and Marschner2005). Such incubation experiments have been implemented to explore microbial responses to stress or perturbations such as wet–dry cycles (Fierer et al.2003), altered nutrients (Thirukkumaran and Parkinson2000), and plant species shifts (Saetre
and Stark 2005). Hence, incubation studies are
valuable for elucidating key factors affecting soil carbon dynamics.
Integrating information from incubation experi-ments with complimentary field data to learn about mechanisms operating in a natural setting is challeng-ing. For example, synthesis of incubation data is often limited to relatively simple analyses (e.g., Hook and
Burke 2000; Robertson et al. 1997) that do not
simultaneously consider all data sources and may not accurately reveal mechanisms necessary for understanding carbon dynamics in the field. On the other hand, the work by Saetre and Stark (2005) is unique in that they analyze substrate-induced incuba-tion data within the context of a relatively detailed mass-balance model that couples carbon and nitrogen transformations. Another class of incubation experi-ments, which generally do not involve substrate additions, periodically measure CO2 efflux over several weeks or months. Generally, the goals of such experiments are to estimate the size of the initial carbon pool and the decay coefficients, but not necessarily microbial biomass or physiological activity. Functions describing carbon mineralization kinetics (such as a first-order decay model) are often fit to incubation data via non-linear regression routines (Alvarez and Alvarez 2000; Dalias et al. 2001; Grandy and Robertson2007; Paul et al.1999). Although these fitting approaches incorporate a semi-mechanistic model, the methods are somewhat unsatisfactory because they do not consider multiple sources of uncertainty (e.g., random and fixed effects) or multiple types of data (subsets of data are often analyzed independent of others).
Thus, the goals of this study are two-fold: (1) present a HB approach for analyzing soil incubation data and (2) apply the HB approach to an incubation experiment that explores the effects of woody-plant encroachment on soil carbon dynamics. Woody plant expansion into native grasslands is a near-global
phenomenon (Archer et al. 1995; Chapin et al.
1995; Polley et al. 2003), and the resulting shifts in vegetation structure and composition can alter carbon inputs and chemical composition, affecting the decomposability, turnover, and amount of soil carbon (Hibbard et al.2001; Jackson et al.2000). The semi-arid riparian system that we are studying in southeastern Arizona is undergoing encroachment by a deeply rooted nitrogen fixing shrub (mesquite,
Prosopis velutina) that is causing the accumulation
of highly decomposable leaf litter at the soil surface and woody root material at depth. In grasslands, however, relatively decomposable root material may be deposited more uniformly to depth or concentrated near the surface (e.g., Jackson et al.1996; Titlyanova et al. 1999). The presence of large woody plants (or shrubs) may modify other factors that affect decomposition, including microclimate (via canopy effects on soil temperature and moisture), substrate availability (via litter inputs), microbial biomass and community structure, and the efficiency of microbial carbon consumption (Saetre and Stark2005). In semi-arid ecosystems, both carbon and water availability limit microbial activity, so vegetation characteristics that modify these resources are expected to strongly control soil carbon decomposition (Austin et al.2004;
Hibbard et al. 2001). Thus, this study aims to
understand how encroachment by mesquite may affect soil carbon processes in semi-arid ecosystems.
In order to address the two goals of this study, we combine experimental data and the HB modeling approach to evaluate the following three hypotheses. We hypothesize that increased dominance of nitrogen fixing shrubs in a semi-arid riparian ecosystem will: (1) elevate soil carbon stocks throughout the soil profile due to higher productivity compared to co-occurring grasses, (2) increase microbial biomass near the soil surface due to inputs of high-quality leaf litter compared to deep soil that receives low-quality woody root litter, and (3) enhance microbial substrate-use efficiency due to inputs of more decomposable litter (high nitrogen content) compared to grasses (low nitrogen content) and open/bare spaces (low litter
inputs). Evaluating these hypotheses will lend insight into the impacts of woody-plant expansion on soil carbon dynamics in this semi-arid system.
Materials and methods
Site description
This study was conducted at a medium-dense mesquite shrubland (e.g., intermediate between a grassland and closed-canopy woodland in terms of shrub density) located along the San Pedro River, southeast of Tucson, Arizona. The site is character-ized by sandy-loam soils that are fairly homogenous to 50 cm (R.L. Scott, personal communication). Mean annual precipitation is 39 cm, of which approximately 60% falls in the summer (July–September) and about 22% in the winter (December–March) (average from 1971 to 2000 National Climate Data Center; NCDC 2008). Mean annual air temperature is 17°C, and the maximum occurs in June (33°C) and the minimum in
January (0.6°C) (NCDC 2008). The two dominant
plant species are velvet mesquite (Prosopis velutina) and giant sacaton bunchgrass (Sporobolis wrightii). Prior to the summer monsoon, the vegetation cover is about 50% mesquite, 20% sacaton, 20% other shrub species, and 10% open space (Scott et al.2000). The field portion of this study was conducted in the dry pre-monsoon season, prior to the growth of ephemeral herbaceous plants that fill-in bare space. Seasonal activity and productivity differ between shrubs and grasses primarily because large mesquite access deep soil water and sacaton access near-surface soil water derived from recent rains (Potts et al. 2006; Scott et al. 2000).
Soil sampling and incubation experiment
and grass. Bare spaces were devoid of surface litter and pits were excavated at least 1 m away from the nearest plant. Soil (∼200 g) was collected from each pit in the following increments (or depths): 0–2, 2–5, 5–10, 10–15, 15–20, 20–30, 30–40, and 40–50 cm, resulting in 96 soil samples (8 depths×4 microsites×3 replicates). Caliche was present at 50 cm, preventing deeper pits. Soils were transported from the field in ice-filled coolers and stored at 4°C until analysis (within 48 h). Each soil sample was sieved (2 mm) to remove roots and rocks. Gravimetric water content (mean ± 1 SD = 1.53 ± 1.01%) and water-holding capacity (WHC, 28±2.96%) were measured on a subset of samples.
Each soil sample was divided into a pair of 50 g sub-samples that were placed in 0.5 pint glass jars. The soil in paired jars was brought to 50% WHC (±2%): one with pure deionized (DI) water and the second with a dextrose–DI water solution (4.2 mg dextrose/g soil, 30 mg dextrose/mL water) to deter-mine substrate-induced respiration (SIR) (West and Sparling 1986). The sealed jars were incubated at a constant temperature of 25°C in the dark. Respiration (CO2 efflux, μmol CO2 g−
1
soil s−1) was measured with a closed-loop gas-exchange system that pumped air from the jars through a Li-820 (LiCor Inc., Lincoln, NE) and a flow meter (0.5 L/min). Respira-tion was measured prior to substrate addiRespira-tion (dry soil) and at 24 and 48 h after water and substrate addition. Jar lids were removed for 120 s to vent the high CO2 concentrations, and respiration was subse-quently measured for 60 to 120 s.
Soil not used for incubations was processed for microbial biomass carbon (n=25) and organic carbon, inorganic carbon, and nitrogen content (n= 91). Microbial biomass was determined on subsamples selected to give a representative coverage of the soil system; subsamples were distributed among the microsites and depths as follows: bare (0–2, 2–5, 5–
10, 15–20, 40–50 cm), grass (0–2, 2–5, 5–10, 20–30, 30–40 cm), medium mesquite (0–2, 2–5, 10–15, 40–
50 cm), and big mesquite (0–2, 5–10, 15–20, 20–30, 30–40 cm). Field moist soil samples (5 g) were treated via chloroform fumigation–extraction using K2SO4in a soil:extractant ratio of 1:4 (Vance et al. 1987). Microbial carbon in the extracts was deter-mined with a total carbon analyzer (Shimadzu-5000 Kyoto, Japan) and calculated using an extraction efficiency of 0.38 (Vance et al.1987). Additional soil
samples were ground to a fine powder and inorganic carbon was measured with a modified pressure-calcimeter method (Sherrod et al.2002); total carbon and nitrogen were measured by dry combustion (NC2100 soil analyzer, CE Elantech, Lakewood, NJ). Organic carbon was calculated as the difference between total and inorganic carbon.
Hierarchical Bayesian analysis of incubation data
Here we describe a hierarchical Bayesian (HB) modeling approach (e.g., Berliner 1996; Clark 2005; Ogle and Barber2008; Wikle2003) for analyzing the different types of incubation data that we obtained in this study. The HB method provides a fully consistent statistical framework for analyzing the diverse data within the context of a Michaelis–Menten type process model for microbial respiration. One of the two goals of this study is to describe the general HB approach and apply it to data to address the second goal of this study, which is to elucidate the effects of different microsites on microbial activity and soil respiration. The HB model has three components: (1) the data model that defines the likelihood of the observed data, (2) the probabilistic process model of microbial respiration, and (3) the parameter model that defines the prior distributions for the process model parameters and variance terms. See Table1for descriptions of all the symbols used in the following sections.
The data model
The data model combines the data likelihoods for observed respiration rates, organic carbon contents, and microbial biomass. First, we work with measured respiration rates (r) that have units of μmol CO2g−1 soil s−1
. Note that r is positive-valued, its variance tended to increase with its mean, and Lr=log(r), the natural logarithm of r, is approximately normally distributed. Thus, for microsite m (four types), soil depthd(eight layers), soil pitq(three reps), substrate-addition type s(water or dextrose), and time periodt
(24 or 48 h), we assume:
Lrfm;d;q;s;tgNormal mLrfm;d;q;sg;tLr
; ð1Þ
error. Within each substrate-addition type, there were no systematic differences between the 24 and 48 h time periods, so time period is treated as a replicate and used to estimateτLr.
Respiration is the response variable of interest, and organic carbon and microbial biomass are covariates in the Michaelis–Menten model (see Eq. 6). Let
CLayerfm;d;qg and BLayerfm;d;qg denote the observed amounts of organic carbon (g C·m−2
per layer) and microbial biomass (g dw·m−2 per layer) from the fumigation–extractions, respectively; we assume:
CLayerfm;d;qgNormal mCLayerfm;dg;tC
; ð2aÞ
BLayerfm;d;qgNormal mBLayerfm;dg;tB
; ð2bÞ
mCLayerfm;dg and mBLayerfm;dg are the mean or latent amounts of organic carbon and microbial biomass,
respectively, and the precision parameters τC and τB describe variability introduced by soil pit random effects. We further definemCLayerfm;dgandmBLayerfm;dg as follows:
mCLayerfm;dg¼cfm;dgCf gm; ð3aÞ
mBLayerfm;dg¼bfm;dgBf gm; ð3bÞ
c{m,d} and b{m,d} (both are unitless) are the relative amounts of carbon or biomass in a given microsite and layer such thatP
d cfm;dg¼
P
d
bfm;dg¼1, andC
m
f gandBf gm
are the total amounts of carbon (g C/m2) and biomass (g dw/m2) in an entire 0–50 cm column of soil. The depth-dependent distribution of carbon and microbes (c, b) and their total amounts (C*, B*) are quantities that we wish to estimate.
Table 1 Description of symbols used in the HB model, including units and the type of data or node denoted by each symbol
Symbol Type Unitsa Description
t,m,d,q, s
NA NA Indices for time (t), microsite (m), depth (d), soil pit (q), and treatment addition type (s)
Lr SD Log(μmol m−2
s−1
layer−1
)
Log respiration rates
μLr SP Log(μmol m−2
s−1
layer−1
)
Mean or predicted log-respiration value
τLr,τμLr SP Precision terms for Lr andμLr
τC,τB SP Precision terms forCLayerandBLayer CLayer SD g C m−2layer−1 Observed carbon content
BLayer SD g M m−2layer−1 Observed microbial biomass carbon
μCLayer LN g C m−2layer−1 Mean or latent amount of carbon
μBLayer LN g M m−2layer−1 Mean or latent amount of carbon
C SP Unitless Relative amount of carbon in each soil layer (depth) and microsite C* SP G C m−2
Total amount of carbon in a column of soil in each microsite B SP unitless Relative amount of microbial biomass in each soil layer and microsite B* SP G M m−2
Total amount of microbial biomass in a column of soil in each microsite
μ×μLr SP log(μmol m−2s−1) Latent or mean log respiration rate
AC LN μmol CO2g C−1s−1 Substrate-use efficiency of microbes AB SP μmol CO2g M−1s−1 Base-line microbial metabolic activity
Bcm SP % cm−1 Relative amount of microbial biomass per cm of soil
Ccm SP % cm−1
Relative amount of carbon per cm of soil
λ LN unitless Limitation index: relative importance of microbial activity vs. substrate availability to respiration
Ac LN μmol CO2g soil−1s−1 Reduced model: respiration rate when substrate is limiting (microbial biomass
unlimiting)
Am LN μmol CO2g soil−1s−1 Reduced model: respiration rate when microbes are limiting (amount of substrate
unlimiting)
SDstochastic data,SPstochastic parameter or quantity,LNlogical node or described by deterministic function
The process model
Latent respiration, microbial biomass, and organic carbon are unobservable quantities that are informed by the data. Latent respiration is described by a process model that includes process uncertainty, whereas we implemented an errors-in-variables-type model (Dellaportas and Stephens 1995) for biomass and carbon (Eqs. 3a and 3b). We define the process model for latent respirationmLrfm;d;r;sgas:
mLrfm;d;r;sgNormal mmLrfm;d;sg;tmLr
; ð4Þ
the meanmmLrfm;d;sg is described by a Michaelis– Menten (MM)-type equation, and τμLr is the preci-sion, which describes process error due to, for example, soil pit random effects that cannot be captured by the relatively simple MM model (i.e., Eq. 5). Such random effects could reflect differences in microbial community structure, soil texture, or other soil or microbial properties that were not measured.
We chose a MM-type model partly because this fairly simple model lends insight into key parameters that describe microbial substrate use efficiency and
“inherent”microbial activity. When coupled with the incubation data within the HB framework, estimates of these parameters facility inferences about microbial activity. The general form of the MM model for respiration (R) as a function of the amount of carbon substrate (C) and microbial biomass (B) is:
R¼ACABCB
ACCþABB
ð5Þ
AC(μmol CO2·g organic C−1·s−1) describes micro-bial carbon substrate-use efficiency, and AB (μmol CO2·g microbial C−1·s−1) is an index of the inherent microbial activity or metabolism in the absence of competition for carbon substrate. Note that when the substrate is saturating (C→ ∞), Eq. 5 reduces to
R=AB·B such that respiration is limited by and proportional to microbial biomass. We assume that sugar addition results in substrate saturation, and applying Eq.5 gives:
mmLrfm;d;sg¼ Eq.3, and that Eq.6explicitly links the different data sources via their associated latent processes.
One might expect AB to be affected by the
composition of the microbial community, but because these data were unavailable and since all samples were collected in close proximity, we assume that AB is independent of microsite or soil depth. We tested this assumption with the model and found no differ-ences inABacross microsite and depth. On the other hand, we expect that AC will depend on the quality and chemical composition of the available substrate, and we assume that AC is related to the nitrogen content (%N) of the organic matter such that:
AC m;df g¼aþb Nfm;dgaveN
; ð7Þ
where α is the value ofAC when nitrogen content is equal to aveN (the average %N measured in this study; aveN =0.053%), andβdescribes the sensitivity of ACto changes in %N.
The parameter model
Ultimately, we want to estimate the unobserved quantities c, b, C*, B*, AB, and AC (i.e., α and β) and the precision terms τLr,τC, τB, andτμLr, and we specify prior distributions for these quantities. (The
HB model will also estimate missing data—for
example, we were unable to measure microbial biomass for all depth by microsite combinations, and the associated missing data model is given by Eq. 2b.) We assign independent, non-informative (diffuse) normal priors to log(AB), α, β, logCf gm , and logBf gm. We assume Dirichlet priors for the depth-dependent distributions of carbon substrate,
c{m,.}, and microbial biomass, b{m,.}, where the {m,.} refers to all depths such that c{m,.} and b{m,.} are vectors that vary by microsite. The Dirichlet prior constrains the proportions (i.e., c{m,d} and b{m,d}) to be between 0 and 1 and, within a microsite, the proportions sum to one across all depths. We assume a non-informative Dirichlet prior that is equivalent to a uniform prior in the one-dimensional case. Finally, we assume independent, diffuse gamma priors for the precision parameters (i.e., τLr,τC,τB, andτμLr).
(dL, cm) to obtain the relative amounts of soil carbon (ccm, %/cm) and microbial biomass (bcm, %/cm), allowing for direct comparisons of ccm and bcm between layers and microsites. We also computed the average microbial carbon-use efficiency associate with each microsite as a weighted average ofAC{m,d} with weights given byc{m,d}:
AveAC mf g¼
XNd
d¼1
cfm;dgAC m;df g: ð8Þ
To explore the relative importance of microbial activity and carbon substrate availability to heterotro-phic soil respiration, we calculated a “limitation”
index (λ):
lf gm ¼
ABBf gm
AveAC mf gCf gm !
ð9Þ
If λ= 1, microbial activity and carbon substrate availability are equally limiting (or controlling) respiration; if λ>1, substrate is most limiting and if
λ<1, microbial activity is most limiting.
Combining the data model (Eqs.1,2a, and2b), the process model (Eqs.4,5,6, and7), and the parameter model (or priors) results in joint and marginal posterior distributions for the unknown or latent quantities of interest (e.g., Berliner 1996; Ogle and Barber2008). The HB model that is specified by the above equations was programmed in WinBUGs
(Lunn et al. 2000). We ran two parallel MCMC
(Markov chain Monte Carlo) chains, and we used the BGR diagnostic tool to evaluate convergence of the chains to the posterior distribution (Brooks and Gelman1998; Gelman et al. 2004). Chains converge once the values for parameters“settled”on (or varied around) the “best estimates” (e.g., the posterior means). The simulations yielded an independent sample of 3,000 values for each parameter from the joint posterior distribution.
Re-parameterizing the model to accommodate less data
To determine the sensitivity of this modeling approach to available data, we compared the results given by full model (as described above) with a reduced version that only uses respiration data (i.e., no soil carbon or microbial biomass data). Note that if
one were to fit Eq. 5, as modified in Eq. 6, to incubation data that only included respiration rates, thenB*,C*,AC, andABare nonidentifiable (i.e., there is no unique solution for these parameters). Without additional carbon content and microbial biomass data, we can only estimate the relative amount of microbes (b), the relative amount of carbon (c), and indices of microbial activity. The following re-parameterized model can be used in such cases, and we re-write Eq.5 as:
R¼acabcb
accþabb ð10Þ
where ac=AC×C* and ab=AB×B* (both have units of μmol·m−2·s−1), and recall that C=C* ×c and B=B*×b. SinceAC,C*, andM* are expected to vary between microsites, ac and ab also vary between microsites. Note that Eq. 10 describes the water addition data and R=ab×b corresponds to the sugar addition data (substrate saturated). We can estimate ac, ab,b, andcby specifying the complete HB model that includes Eq. 1 (data model), Eq. 4 (process model), Eq.6(with process mean modified according to Eq. 10), and the prior models previously defined for c, b, τLr, and τμLr. Additional prior distributions are needed for ac and bc, and we assumed non-informative normal priors for log(ac) and log(bc). Note that the ratio ac/ab is equal to the limitation index (λ, Eq.9), and thusλcan still be estimated.
Results
under big mesquite (mean±1 SE=0.088±0.030%; 0–55 cm), followed by medium mesquite, grass, and bare microsites (0.040 ± 0.004, 0.046 ± 0.004, and 0.033±0.001%, respectively). Soil nitrogen was high-est in the surface layer (0.275 ±0.041%; across all microsites) compared to deeper layers.
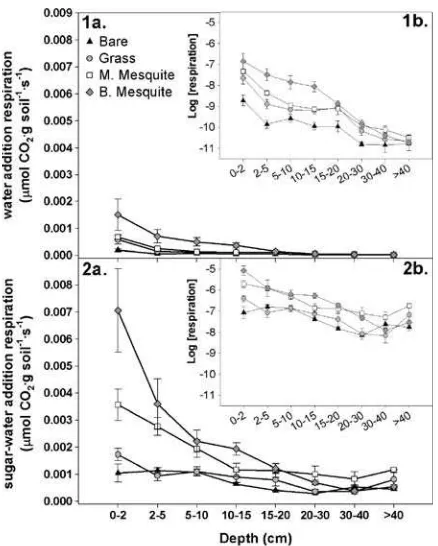
The HB model successfully captured the observed patterns in soil respiration, soil organic carbon, and microbial biomass. For example, regressions of observed vs. predicted log respiration (i.e., Lr vs.
μ×μLr, Eq. 6), organic carbon (i.e., CLayer vs.
μCLayer, Eq. 2a), and microbial biomass (i.e., BLayer vs. μBLayer, Eq. 2b) indicate that the full model successfully fit the observed data (Fig. 2). The full HB model accounted for 94%, 96%, and 61% of the
variation in observed (log) soil respiration, microbial biomass, and organic carbon (Fig.2).
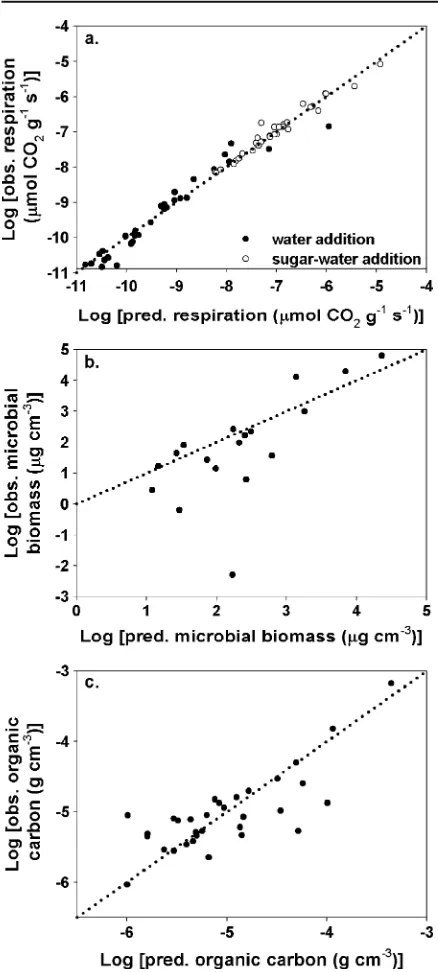
To evaluate the full versus reduced model, we compare parameters shared by both models (c,b and
λ). We consider two quantities significantly different if the 95% credible interval (CI)—the interval defined by the 2.5th and 97.5th percentiles—for each quantity does not contain the other quantity’s posterior mean. For example, the full model and reduced model yielded similar estimates for λ, c, and b as the 95% CIs obtained from the full model contained the associated parameter’s posterior mean for the reduced model (Fig.3a–c). The full model resulted in slightly more precise estimates for these parameters, which is reflected in the narrower CIs; the mean widths of the 95%CIs for the full vs. reduced models were: 0.14 vs. 0.14 (c), 0.11 vs. 0.15 (b), and 6.1 vs. 6.9 (λ).
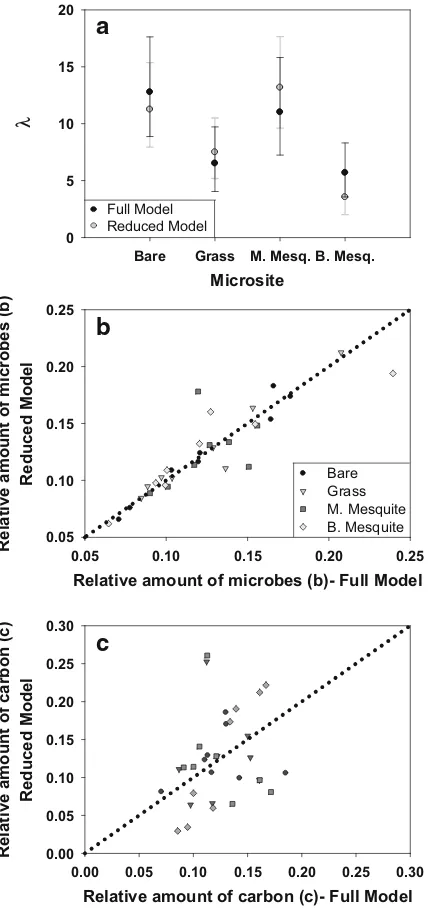
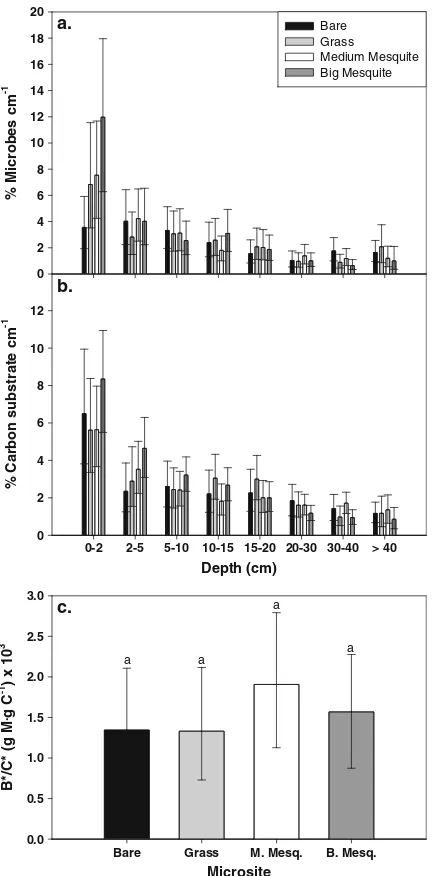
Now we focus on parameters unique to the full model, and posterior results for a subset of parameters are given in Table 2. The posterior distributions of ccm (% C/cm) and bcm (% dw/cm) show that both organic carbon content and microbial biomass were most concentrated near the surface and declined with depth (Fig. 4a,b). The strongest depth-dependent decline occurred under big mesquite; conversely, microbes and carbon were more uniformly distributed with depth in bare soil. Differences in the posterior estimates of total carbon content and total microbial biomass were greatest between non-mesquite micro-sites (grass, bare; low C* and B*) and mesquite microsites (big and medium shrubs; highC* andB*) (Table 2). In general, soils in bare areas have the lowestC* andB* while soils under big mesquite had the highest C* and B* (Table 2). Despite strong microsite differences inC* andB*, microbial biomass per unit of carbon (i.e., B*/C*) was similar across microsites (Fig.4c).
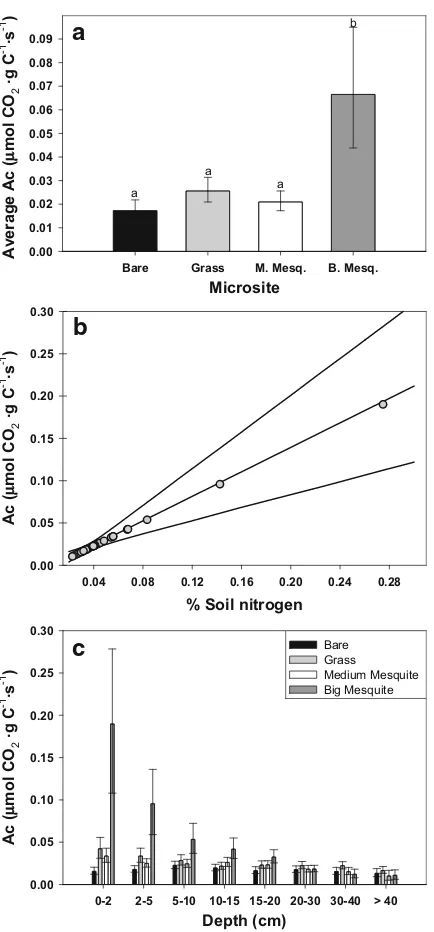
Depth averaged microbial carbon substrate-use efficiency (AveAC) was lowest for bare soil, interme-diate for grass and medium mesquite microsites, and highest for big mesquite microsites (Fig.5a, Table2). Depth-varying microbial carbon-use efficiency (AC) was positively correlated with soil N content (β>0, Table 2, Fig. 5b). Over the range of N contents measured in this study, the posterior mean for
ACincreased from ca. 0.01 (N=0.02%) to 0.19μmol·g C−1
·s−1
(N= 0.28%) (Fig. 5b). Pronounced depth-dependent variation in soil N under big mesquite led to a strong depth-dependent decline inAC(Fig.5c). In
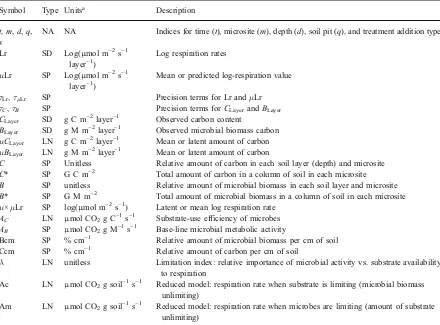
Fig. 1 Summary (sample means and standard errors) of
observed respiration rates following substrate additions. For both the pure water or sugar water additions, respiration rates were similar when measured at 24 and 48 h, so we show the data pooled across time periods. Respiration rates following (1a) pure water addition (measures potential carbon minerali-zation) and (2a) sugar water addition (substrate induced respiration). Theinsets(1band2b) display values on the log-transformed scale. Respiration rates are shown for each micro-site (bare triangles, grass circles, medium mesquitesquares, and big mesquitediamonds) and for eight depths (0–2, 2–5, 5–
this system, carbon substrate availability rather than microbial activity appears to be the dominant control-ler of respiration (λ>1) (Fig.6). Substrate availability is most limiting in medium mesquite and bare microsites ðlffi10:6Þ and least limiting under big mesquite ðlffi3:5Þ(Fig.6).
Discussion
Woody plant encroachment and soil carbon turnover
We used a hierarchical Bayesian (HB) modeling approach to bridge lab and field studies within a unified statistical framework, with the goal of gaining mechanistic insight into soil carbon–microbial inter-actions. This framework was used with soil incubation data to explore how encroachment of a nitrogen-fixing shrub (mesquite, Prosopis velutina) into a semi-arid riparian grassland may be affecting soil carbon cycling, and we evaluated three hypotheses related to this question. In support of Hypothesis #1, total organic carbon under mesquite (big and medium shrubs) was 1.8 and 1.5 times greater than total carbon under bare and grass microsites, respectively (C*, Table 2). Big mesquite shrubs also resulted in 2.2 times greater accumulation of organic carbon in surface layers (0–2 cm) compared to bare, grass, and medium mesquite (Fig.4b). In support of Hypothesis #2, microbial biomass was 1.9 and 2.3 times greater under mesquite (big and medium shrubs) compared to grass and bare microsites, respectively (B*, Table2). Similar to the soil carbon patterns, big mesquite appear to enhance the relative amount of microbes by nearly threefold in surface layers compared to grass and bare microsites (Fig. 4a). In support of Hypoth-esis #3, microbes associated with big mesquite had approximately threefold greater carbon substrate-use efficiency than the other three microsites (Fig.5a).
Woody plant encroachment into other arid and semi-arid grasslands has led to changes in soil carbon stocks (Jackson et al. 2002) that are consistent with our observations. While Jackson, Banner, Jobbagy et al. (2002) did not observe a significant or consistent effect of shrub encroachment on the depth distribution of carbon in the top 100 cm, we found that big mesquite facilitate accumulation of carbon and microbial biomass in the near-surface layers (Fig.4a,b). The large shrubs in this ecosystem access
Fig. 2 Evaluation of model goodness-of-fit by comparing log
of observed (measured) and model-predicted (a) respiration rates, (b) microbial biomass, and (c) organic carbon. For a, solid circles are respiration rates associated with pure water addition andopen circlesare rates associated with sugar–water addition. Thedotted linesare the 1:1 lines, andsolid linesare the least squares regression fits with the following coefficients:
a water addition: Logð Þ ¼ y 0:09þ0:99Logð Þx;R
2¼ 0:94, s u g a r–w a t e r a d d i t i o n : Logð Þ ¼ y 0:37þ0:84
Logð Þx;R
2¼0
:96, b Logð Þ ¼ y 1:2þ1:3Logð Þx; R
2¼ 0:48,cLogð Þ ¼ y 1:6þ0:68Logð Þx;R
2¼0
deep water (Scott et al.2000), resulting in potentially more aboveground production and carbon accumula-tion in the soil surface compared to the shrubs studied by Jackson et al. (2002). Despite the proliferation of
microbes beneath big mesquite, the amount of microbial biomass relative to carbon content (B*/C*) was similar across microsites (Fig.4c). This suggests that the amount of carbon, regardless of the quality of this carbon, constrains the amount of microbial biomass across microsites; however, the carbon-use efficiency of these microbes does depend on carbon (or substrate) quality.
In our system, microbial respiration was controlled by carbon availability to a lesser extent under big mesquite compared to the other microsites (Fig. 6). This was expected because big mesquite microsites have an extensive litter layer (>7.6 cm deep, data not shown), high surface soil carbon content, and nitrogen-rich litter compared to bare soil, grass microsites, and the lesser-developed medium mes-quite microsites. Because Prosopis velutina is a nitrogen-fixer, soil beneath the big shrubs supported
Relative amount of microbes (b)- Full Model 0.05 0.10 0.15 0.20 0.25
Relative amount of microbes (b)
Reduced Model
0.05 0.10 0.15 0.20 0.25
Bare Grass M. Mesquite B. Mesquite
Relative amount of carbon (c)- Full Model 0.00 0.05 0.10 0.15 0.20 0.25 0.30
Relative amount of carbon (c)
Reduced Model
0.00 0.05 0.10 0.15 0.20 0.25 0.30
a
b
c
Microsite
Bare Grass M. Mesq. B. Mesq.
λ
0 5 10 15 20
Full Model Reduced Model
Fig. 3 For bare, grass, medium mesquite, and big mesquite
microsites, full and reduced model comparisons ofaposterior means and 95% credible intervals forλ(grey error barsfor the reduced model), and posterior means for the relative amounts of
bmicrobial biomass (b) andcorganic carbon (c) in each soil layer or depth (each point is a depth for each microsite). The dotted lineinbandcis the 1:1 line
Table 2 Posterior means and 95% credible intervals (2.5th and
97.5th percentiles) and units for a subset of the HB model parameters. Mesq. refers to mesquite
Parameter Units Mean (95%CI)
τLr 9.52 (7.66, 11.5)
τμLr 4.33 (3.09, 5.91)
τC×105 2.73 (1.81, 38.9)
τB 6.18 (1.87, 16.0)
AB μmol CO2g soil−1s−1 150 (103, 238)
α μmol CO2g C−1s−1 0.032 (0.025, 0.040)
β μmol CO2g C−1s−1
%N−1
0.712 (0.371, 1.08)
AveAC μmol CO2g C−1s−1
Bare 0.017 (0.014, 0.022)a
Grass 0.026 (0.021, 0.031)b Med. Mesq. 0.021 (0.017, 0.026)ab Big. Mesq. 0.067 (0.044, 0.095)c B* g M m−2
Bare 2.81 (1.64, 4.07)a
Grass 3.37 (1.88, 5.11)a
Med. Mesq. 6.19 (3.76, 8.70)b Big. Mesq. 6.51 (3.72, 9.12)b C* g C m−2
Bare 2,122 (1,596, 2,650)a
Grass 2,561 (2,043, 3,112)a Med. Mesq. 3,272 (2,720, 3,850)b Big. Mesq. 4,176 (3,552, 4,803)c
microbes with high carbon substrate-use efficiency (Fig. 5a), particularly near the surface (Fig.5c). This suggests that soil carbon was of higher quality (e.g., higher N) compared to bare, grass, and medium mesquite microsites (low N=low decomposability,
Ball 1997; Fierer et al. 2006). In fact, carbon substrate-use efficiency was positively correlated with substrate quality as described by the nitrogen content of the bulk soil (Fig.5b). Thus, high respiration rates in the soil surface beneath big mesquite are attributed to large, labile carbon stocks and high nitrogen contents that facilitate the relatively rapid decompo-sition of high quality litter.
Conversely, bare and grass microsites are devoid of surface litter, thereby limiting carbon inputs to surface layers. Low decomposability of soil carbon (low N) in these microsites resulted in low microbial abundance and reduced carbon substrate-use efficiency. Although grass and bare microsites are functionally similar in terms of litter inputs and microbial activity, at the ecosystem level grasses may not be equivalent to bare ground because they support a root system and dense canopies with high production rates (Potts et al. 2006). Medium mesquite were functionally similar to big mesquite in that they had similar amounts of soil microbial biomass and soil carbon (Table2), but they were functionally similar to grass and bare soil in terms of their microbial carbon-use efficiencies (Fig. 5a). The latter was somewhat surprising since the chemical composition of soil organic matter formed from the litter from both medium and large shrubs was expected to differ from that of grass litter. As shrubs grow larger, however, the soil beneath their canopies changes whereby all of the following tend to increase: soil carbon stocks, microbial biomass, substrate-use efficiency, and soil respiration. However, it appears that microbial biomass responds most rapidly to shrub encroachment, followed by soil carbon, then microbial substrate-use efficiency. Thus, our results suggest that there appears to be a lag in soil carbon processes associated with the conversion of grassland to mesquite shrubland.
The hierarchical Bayesian modeling approach
The HB modeling approach that we employed allowed us to synthesize experimental and observa-tional data related to soil carbon–microbe interactions. Although we applied this approach to short-term, substrate-induced incubation data, it could be applied to long-term incubation studies for understanding mineralization kinetics (Alvarez and Alvarez 2000; Dalias et al. 2001; Grandy and Robertson2007; Paul et al. 1999); more generally, it can be used to b.
Depth (cm)
0-2 2-5 5-10 10-15 15-20 20-30 30-40 > 40
%
Carbon substrate cm
-1
Bare Grass M. Mesq. B. Mesq.
B*/C* (g M
Fig. 4 Posterior means and 95% credible intervals (CIs) for the
synthesize data from microcosm studies. Although we worked with a specific dataset and particular process model, the HB approach is highly flexible and can accommodate different types of data, experimental designs, sampling protocols, and process models
(Ogle 2008). Traditional methods for analyzing
incubation data generally do not use the data to their fullest potential and tend to misrepresent uncertainty, which will impact subsequent inferences. Further, multiple datasets are often analyzed in a piece-wise fashion rather than in a single analysis that explicitly accounts for multiple sources of uncertainty. The HB approach presented here overcomes these issues by employing a probabilistic framework that links semi-mechanistic process models with diverse sources of data that inform processes of interest (e.g., in this study, microbial decomposition of soil carbon).
Although our study produced a fairly rich dataset, other studies may be limited in the types of data available. For example, measurements of microbial biomass can be time consuming and expensive, prohibiting the collection of such data. We note, however, that the reduced model (e.g., Eq. 10 and associated text) is appropriate for incubation experi-ments that only measure respiration rates. Compared to the full model, the reduced model produced similar estimates of the relative amounts of microbial biomass and organic carbon (bandc), soil respiration, and the importance of microbial activity vs. substrate availability to soil respiration (λ). This suggests that
Fig. 6 Posterior means and 95% credible intervals for the
limitation index (λ, see Eq. 9), which describes the primary controller of respiration (microbes or carbon). Statistical differ-ences in the means are denoted bydifferent letters
c
Depth (cm)
0-2 2-5 5-10 10-15 15-20 20-30 30-40 > 40
Ac (
0.04 0.08 0.12 0.16 0.20 0.24 0.28
Ac (
Bare Grass M. Mesq. B. Mesq.
Average Ac (
Fig. 5 Posterior estimates of microbial carbon-use efficiency
(AC), where a shows posterior means and 95% credible
intervals for substrate-use efficiency averaged across depth for each microsite (i.e., AveAC) (statistical differences denoted by
different letters);bshows the predicted relationship betweenAC
and bulk soil nitrogen content (%), plotted for soil N values that span the N contents measured in this study, where the middle line is the posterior mean, the upper and lower curves define the 95%CI, and the symbols (circles) indicate the predicted AC
carbon and microbial biomass are not critical to measure when the goal is to estimate b, c, and λ. However, if the goal is to estimate microbial metabolic parameters (AC and AB) and/or the total amount of carbon or microbes (C* and B*), then organic carbon and microbial biomass data must be collected and used with the full model described herein.
The full model was very successful at predicting respiration, but it was comparatively less successful at predicting microbial biomass and organic carbon (Fig. 2b,c). There are at least two potential explan-ations for this result. First, latent respiration rates were mostly informed by two data sources (water and sugar–water incubation flux data), but estimated total carbon and total biomass were primarily informed by one source each (measured organic carbon and microbial biomass carbon, respectively). Further, the biomass dataset was small compared to the carbon and respiration data, and data for some depths were missing across all microsites. Second, the respiration
data and Michaelis–Menten model inform us
about relatively fast processes related to highly mineralizable soil carbon and metabolically active micro-organisms. Conversely, the soil carbon data integrate over disparate temporal and spatial scales associated with, for example, labile and recalcitrant carbon pools, and the biomass data may not accu-rately describe micro-organisms that are active at the time of incubation. However, the data-sensitivity analysis that compares the reduced and full models suggests that including soil carbon data improves parameter estimates and reduces uncertainty in pre-dicted soil carbon. In summary, the HB approach can easily accommodate different types and amounts of data that can be analyzed within the context of a process model, facilitating inferences about key parameters and processes related to, for example, soil carbon cycling.
Acknowledgements We thank Dr. David Williams and Dr.
Russell Scott for the access to field sites and intellectual contributions; Greg Barron-Gafford, Ben Collins, Kevin “the Red”Gilliam, and Amelia Hazard for the field assistance; and Mary Kay Amistadi and Jon Chorover, School of Natural Resources, University of Arizona for the TOC analysis of microbial biomass samples. We acknowledge funding from SAHRA (Sustainability of Semi-Arid Hydrology and Riparian Areas) under the STC program of NSF, and NSF awards to TEH, Jake F. Weltzin, and David G. Williams. The
experi-ments herein comply with the current laws of the USA. The statistical analysis was partly supported by a DOE NICCR grant (K.O., T.H.).
References
Alvarez R, Alvarez CR (2000) Soil organic matter pools and their associations with carbon mineralization kinetics. Soil Sci Soc Am J 64:184–189
Archer S, Schimel DS, Holland EA (1995) Mechanisms of shrubland expansion—land-use, climate or CO2. Clim
Change 29:91–99 doi:10.1007/BF01091640
Austin AT, Yahdjian L, Stark JM et al (2004) Water pulses and biogeochemical cycles in arid and semiarid ecosystems. Oecologia 141:221–235 doi:10.1007/s00442-004-1519-1
Ball AS (1997) Microbial decomposition at elevated CO2
levels: effect of litter quality. Glob Chang Biol 3:379–386
doi:10.1046/j.1365-2486.1997.t01-1-00089.x
Berliner M (1996) Hierarchical Bayesian time series models. In: Hanson K, Silver R (eds) Maximum entropy and Bayesian methods. Kluwer, Norwell, MA, pp 15–22 Brooks SP, Gelman A (1998) General methods for monitoring
convergence of iterative simulations. J Comput Graph Stat 7:434–455 doi:10.2307/1390675
Chapin FS, Shaver GR, Giblin AE et al (1995) Responses of arctic tundra to experimental and observed changes in climate. Ecology 76:694–711 doi:10.2307/1939337
Clark JS (2005) Why environmental scientists are becoming Bayesians. Ecol Lett 8:2–14 doi: 10.1111/j.1461-0248.2004.00702.x
Dalias P, Anderson JM, Bottner P et al (2001) Long-term effects of temperature on carbon mineralisation processes. Soil Biol Biochem 33:1049–1057 doi: 10.1016/S0038-0717(01)00009-8
Dellaportas P, Stephens A (1995) Bayesian analysis of errors-in-variables regression models. Biometrics 51:1085–1095
doi:10.2307/2533007
Dutta K, Schuur EAG, Neff JC et al (2006) Potential carbon release from permafrost soils of Northeastern Siberia. Glob Chang Biol 12:2336–2351 doi: 10.1111/j.1365-2486.2006.01259.x
Fierer N, Schimel JP, Holden PA (2003) Influence of drying-rewetting frequency on soil bacterial community structure. Microb Ecol 45:63–71 doi:10.1007/s00248-002-1007-2
Fierer N, Colman BP, Schimel JP et al (2006) Predicting the temperature dependence of microbial respiration in soil: a continental-scale analysis. Glob Biogeochem Cycles 20:10 Fliessbach A, Sarig S, Steinberger Y (1994) Effects of water pulses and climatic conditions on microbial biomass kinetics and microbial activity in a yermosol of the central Negev. Arid Soil Res Rehabil 8:353–362
Gelman A, Carlin JB, Stern HS et al (2004) Bayesian data analysis. CRC, Boca Raton, p 668
Grandy AS, Robertson GP (2007) Land-use intensity effects on soil organic carbon accumulation rates and mechanisms. Ecosystems (N Y, Print) 10:58–73 doi: 10.1007/s10021-006-9010-y
Hibbard KA, Archer S, Schimel DS et al (2001) Biogeochem-ical changes accompanying woody plant encroachment in a subtropical savanna. Ecology 82:1999–2011
Hook PB, Burke IC (2000) Biogeochemistry in a shortgrass landscape: control by topography, soil texture, and microclimate. Ecology 81:2686–2703
Houghton RA, Davidson EA, Woodwell GM (1998) Missing sinks, feedbacks, and understanding the role of terrestrial ecosystems in the global carbon balance. Glob Biogeo-chem Cycles 12:25–34 doi:10.1029/97GB02729
Hunt HW, Wall DH (2002) Modelling the effects of loss of soil biodiversity on ecosystem function. Glob Chang Biol 8:33–50 doi:10.1046/j.1365-2486.2002.00425.x
Huxman TE, Cable JM, Ignace DD et al (2004) Response of net ecosystem gas exchange to a simulated precipitation pulse in a semi-arid grassland: the role of native versus non-native grasses and soil texture. Oecologia 141:295–
305
Jackson RB, Canadell J, Ehleringer JR et al (1996) A global analysis of root distributions for terrestrial biomes. Oecologia 108:389–411 doi:10.1007/BF00333714
Jackson RB, Schenk HJ, Jobbagy EG et al (2000) Belowground consequences of vegetation change and their treatment in models. Ecol Appl 10:470–483 doi:10.1890/1051-0761 (2000)010[0470:BCOVCA]2.0.CO;2
Jackson RB, Banner JL, Jobbagy EG et al (2002) Ecosystem carbon loss with woody plant invasion of grasslands. Nature 418:623–626 doi:10.1038/nature00910
Kirschbaum MUF (1995) The temperature-dependence of soil organic-matter decomposition, and the effect of global warming on soil organic-C storage. Soil Biol Biochem 27:753–760 doi:10.1016/0038-0717(94)00242-S
Lin Q, Brookes PC (1999) Comparison of substrate induced respiration, selective inhibition and biovolume measure-ments of microbial biomass and its community structure in unamended, ryegrass-amended, fumigated and pesticide-treated soils. Soil Biol Biochem 31:1999–2014
doi:10.1016/S0038-0717(99)00122-4
Lunn DJ, Thomas A, Best N et al (2000) WinBUGS-A Bayesian modelling framework: concepts, structure, and extensibility. Stat Comput 10:325–337 doi:10.1023/ A:1008929526011
NCDC (2008) Available athttp://www.ncdc.noaa.gov/oa/ncdc. html. National Oceanic and Atmospheric Association, Asheville, NC
Ogle K (2008) Hierarchical Bayesian statistics: merging experimental and modeling approaches in ecology. Ecol Appl (in press)
Ogle K, Barber JJ (2008) Bayesian data-model integration in plant physiological and ecosystem ecology. Prog Bot 69:281–311 doi:10.1007/978-3-540-72954-9_12
Paul EA, Harris D, Collins HP et al (1999) Evolution of CO2
and soil carbon dynamics in biologically managed, row-crop agroecosystems. Appl Soil Ecol 11:53–65
doi:10.1016/S0929-1393(98)00130-9
Polley HW, Johnson HB, Tischler CR (2003) Woody invasion of grasslands: evidence that CO2 enrichment indirectly
promotes establishment of Prosopis glandulosa. Plant Ecol 164:85–94 doi:10.1023/A:1021271226866
Potts DL, Huxman TE, Scott RL et al (2006) The sensitivity of ecosystem carbon exchange to seasonal precipitation and woody plant encroachment. Oecologia 150:453–463
doi:10.1007/s00442-006-0532-y
Raich JW, Potter CS (1995) Global patterns of carbon-dioxide emissions from soils. Glob Biogeochem Cycles 9:23–36
doi:10.1029/94GB02723
Raich JW, Schlesinger WH (1992) The global carbon-dioxide flux in soil respiration and its relationship to vegetation and climate. Tellus Ser B Chem Phys Meteorol 44:81–99
doi:10.1034/j.1600-0889.1992.t01-1-00001.x
Ritz K, Dighton J, Giller KE et al (1994) Beyond the biomass. Wiley, Chichester, p 275
Robertson GP, Klingensmith KM, Klug MJ et al (1997) Soil resources, microbial activity, and primary production across an agricultural ecosystem. Ecol Appl 7:158–170
doi:10.1890/1051-0761(1997)007[0158:SRMAAP]2.0.
CO;2
Saetre P, Stark JM (2005) Microbial dynamics and carbon and nitrogen cycling following re-wetting of soils beneath two semi-arid plant species. Oecologia 142:247–260
doi:10.1007/s00442-004-1718-9
Saleska SR, Harte J, Torn MS (1999) The effect of experimen-tal ecosystem warming on CO2 fluxes in a montane
meadow. Glob Chang Biol 5:125–141 doi: 10.1046/j.1365-2486.1999.00216.x
Schimel DS, Braswell BH, Holland EA et al (1994) Climatic, edaphic, and biotic controls over storage and turnover of carbon in soils. Glob Biogeochem Cycles 8:279–293
doi:10.1029/94GB00993
Schipper LA, Degens BP, Sparling GP et al (2001) Changes in microbial heterotrophic diversity along five plant succes-sional sequences. Soil Biol Biochem 33:2093–2103
doi:10.1016/S0038-0717(01)00142-0
Schuur EAG, Trumbore SE (2006) Partitioning sources of soil respiration in boreal black spruce forest using radiocarbon. Glob Chang Biol 12:165–176 doi: 10.1111/j.1365-2486.2005.01066.x
Scott RL, Shuttleworth WJ, Goodrich DC et al (2000) The water use of two dominant vegetation communities in a semiarid riparian ecosystem. Agric For Meteorol 105:241–
256 doi:10.1016/S0168-1923(00)00181-7
Sherrod LA, Dunn G, Peterson GA et al (2002) Inorganic carbon analysis by modified pressure-calcimeter method. Soil Sci Soc Am J 66:299–305
Thirukkumaran CM, Parkinson D (2000) Microbial respiration, biomass, metabolic quotient and litter decomposition in a lodgepole pine forest floor amended with nitrogen and phosphorous fertilizers. Soil Biol Biochem 32:59–66
doi:10.1016/S0038-0717(99)00129-7
Titlyanova AA, Romanova IP, Kosykh NP et al (1999) Pattern and process in above-ground and below-ground compo-nents of grassland ecosystems. J Veg Sci 10:307–320
doi:10.2307/3237060
Vance ED, Brookes PC, Jenkinson DS (1987) An extraction method for measuring soil microbial biomass-C. Soil Biol Biochem 19:703–707 doi:10.1016/0038-0717(87)90052-6
change. Microb Ecol 52:716–724 doi: 10.1007/s00248-006-9103-3
Wardle DA (2002) Communities and ecosystems: linking the aboveground and belowground components. Princeton University Press, Princeton, p 404
West AW, Sparling GP (1986) Modifications to the substrate-induced respiration method to permit measurement of microbial biomass in soils of differing water contents. J Microbiol Methods 5:177–189 doi:10.1016/0167-7012 (86)90012-6
Wikle CK (2003) Hierarchical models in environmental science. Int Stat Rev 71:181–199
Williams MW, Brooks PD, Seastedt T (1998) Nitrogen and carbon soil dynamics in response to climate change in a high-elevation ecosystem in the Rocky Mountains, USA. Arct Alp Res 30:26–30 doi:10.2307/1551742
Wullschleger SD, Lynch JP, Berntson GM (1994) Modeling the belowground response of plants and soil biota to edaphic and climatic-change—what can we expect to gain. Plant Soil 165:149–160 doi:10.1007/BF00009971