1,2
Nopianti, R.,
1*Huda, N.,
1Fazilah, A.,
1Ismail, N., and
1Easa, A. M.
1Fish and Meat Processing Laboratory, Food Technology Programme School of Industrial Technology, Universiti Sains Malaysia, Minden, 11800,
Malaysia
2Department of Fish Product Technology, Sriwijaya University Inderalaya, Ogan Ilir, South Sumatera, 30662, Indonesia
Effect of different types of low sweetness sugar on physicochemical
properties of threadin bream surimi (Nemipterus
spp.) during frozen
storage
Abstract: The effects of different types of low-sweetness sugar (lactitol, maltodexrin, palatinit, polydextrose,
trehalose) on the physicochemical properties of threadin bream (Nemipterus spp.) surimi during six months
of frozen storage were investigated. The characteristics analyzed were moisture content, pH, water-holding
capacity, whiteness, folding test, gel strength, expressible moisture, and texture proile analyses. Generally, the cryoprotective effectiveness decreased as the storage time increased. Polydextrose was able to maintain a
water-holding capacity of 77.0%, 98.6% whiteness, a folding test value of 100%, and a gel strength of 53.6%
compared with its initial value during six months of frozen storage. Meanwhile, sucrose was able to maintain
a water-holding capacity of 80.3%, 98.6% whiteness, a folding test value of 75%, and a gel strength of 56.8%
compared with its initial value. Raw surimi was able to maintain water holding capacity of 62.2%, 98.7%
whiteness, a folding test value of 75%, and a gel strength of 36.0% compared with its initial value. It is suggested that, polydextrose as a potential alternative cryoprotectant to replace other low-sweetness sugars.
Keywords: Cryoprotectant, denaturation, frozen storage, low-sweetness sugar, myoibrillar protein
Introduction
Surimi is composed of stabilized myoibrillar proteins obtained from ish lesh that has been mechanically deboned, washed with water, mixed with
cryoprotectants, and then frozen (Park and Morrisey, 2000). It has some functional properties such as
gel-forming ability and water-holding capacity (Somjit
et al., 2005). These functional properties are affected
by the quality of myoibrillar protein. Currently,
frozen storage is the most important and effective
technique used to preserve surimi (Pan et al., 2010). However, the denaturation of protein, especially
myoibrillar protein, still occurs and causes surimi to
eventually lose its properties during frozen storage. To avoid this deleterious effect during frozen storage,
cryoprotectants are being added to surimi (Okada,
1992).
Generally, the most commonly cryoprotectant used is sucrose and sorbitol (1:1) with 0.3%
polyphosphate added as a synergist (Yoon and Lee, 1990; MacDonald and Lanier, 1991). Nevertheless, this cryoprotectant imparts a sweet taste and high
calorie value to surimi (Carvajal et al., 1999). Many
studies have been conducted to overcome this problem by using low-sweetness sugar as an alternative. Sych
et al. (1990) reported that lactitol, palatinit, and
polydextrose stabilize cod surimi equally well as does a sucrose/sorbitol mixture. Pan et al. (2010) reported that trehalose (6%)/polyphosphate (0.3%) shows the greatest protective effect on grass carp surimi over
sucrose (4%)/sorbitol (4%) during 25 weeks of frozen storage. Meanwhile, Carvajal et al. (1999) reported
that maltodextrin exerts good cryoprotection over ish
muscle at -200 during 3 months of frozen storage. Previously, only a few studies related with cryoprotective effects of different types of
low-sweetness sugars on marine tropical ish have been reported. Hence, the objectives of this work were to
investigate the effect of low-sweetness sugar on the
physicochemical properties of threadin bream surimi
and to investigate the potential of low-sweetness sugar as a cryoprotectant alternative to sucrose.
Materials and Methods
Sample preparation
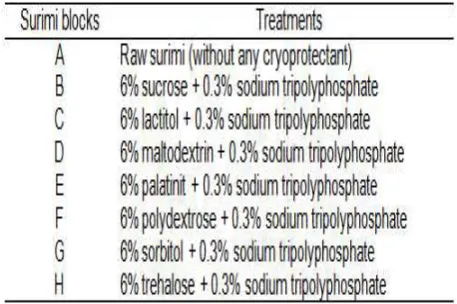
in this experiment are shown in Table 1. After mixing, surimi was packed in polyethylene bags; each package
weighed 10 kg and was frozen using a contact plate
freezer. Frozen surimi blocks were then immediately
transported to the School of Industrial Technology
Universiti Sains Malaysia by a refrigerated truck.
Frozen storage analysis
Every month for six months consecutively, the samples were removed from the freezer and thawed overnight in a chiller at 400C prior to analysis. The characteristics analyzed were moisture content, pH, water holding capacity, whiteness, folding test, gel
strength, expressible moisture, and texture proile.
Moisture content
Moisture content was determined according
to AOAC (2000) method. Surimi was weighed 5
gram (X) and put the sample in moisture disk which previously dried at 10500C. The sample was dried in the oven for 24 h at the temperature 10500C. After 24 h, the sample was cooled in desiccator and weighed soon after reaching room temperature (Y). The
moisture content was calculated by the following the formulation below:
pH
The pH of surimi was determined in triplicate according to Lanier (1992). The sample was weighed for 5 gram, added with distilled water 45 ml, and
then homogenized by using homogenizer at 7000 rpm (IKA®T25 digital ultra-turrax®, Germany). The
pH of homogenate was measured using a pH meter (microprocessor pH meter, HANNA Instruments, Mauritius).
Water holding capacity (WHC)
Water holding capacity was determined according
to Sultanbawa and Li-Chan (1998) in triplicate. 10
grams of surimi was homogenized with 40 ml distilled water using a homogenizer at 7000 rpm (IKA®T25
digital ultra-turrax®, Germany). The homogenate was weighed (X) and placed in 50 ml centrifuge tube and
centrifuged for 5 min at 3500 g. After centrifugation, the supernatant was decanted and pellet was weighed (Y). Water holding capacity was calculated according the following formula:
Whiteness intensity
Surimi was weighed into 400 g portions and mixed with 0.3% of salt using a silent cutter (Stephan,
Germany) for 2 min to produce a homogenous sol.
The sol was placed into a polyvinylidine casing with a diameter of 2.5 cm using a stuffer (Amrapali pure stainless steel size no. 7, India). The surimi sol
was subjected to heating at 3600C for 30 min in a water bath (WB-22 DAIHAN, Korea), followed by
heating at 9000C for 10 min in a water bath according to the procedure of Park et al. (1988). The surimi gels were then cooled directly on ice for 30 min and
equilibrated to room temperature for 1 h prior to
analysis (Nowsad et al., 2000a). Whiteness intensity of surimi gels was measured using a calorimeter (Minolta Spectrophotometer, Model CM-3500d,
Osaka, Japan). The measurement of L*, a* and b*
was performed in triplicate. Whiteness intensity
was calculated using the following equation (Park,
2005):
Folding test
The folding test was determined according to Lanier (1992). Surimi gel was slice uniformly with the thickness 2 mm. The slice was folded slowly to
observe the degree of elasticity before it cracks. The subjective scale to describe the degree of folding strength used was as: (1) breaks by inger pressure,
(2) cracks immediately when folded in half, (3) cracks gradually when folded in half, (4) no cracks showing after folding in half and (5) no cracks showing after folding twice.
Gel strength
Gel strength was measured using the standard
puncture test according to Lanier (1992) and Nielsen
and Pigott (1994). The polyvinylidine casing was removed and the gels were cut to 2.5 cm long sections. The gels were made in triplicate and two measurements were made for each gel, one each at
the top and at the bottom. The breaking force (g) and deformation distance (cm) were measured by using a texture analyzer (TA-TXplus Stable Micro Systems, United Kingdom) equipped with ¼’’ spherical plunger
(P/0.25s) with the distance 30 mm, force 5 g and 5 kg
load cell. Gel strength was obtained by multiplying
force (g) and distance (mm).
Expressible moisture
Expressible moisture was measured in triplicate according to the method established by Park and
Lin (2005). Surimi gel was slice with the thickness 5 mm and weight (Z). The sample was then placed
between two pieces of Whatman paper No.1 which
had previously weighed (X1, Y1). The slice sample was pressed using standard weight (5 kg) for 2 min. The paper was then removed and weight again (X2,
Y2). Expressible moisture was calculated using the following equation:
Texture proile analyzer (TPA)
Texture proile analysis (TPA) of surimi gel was
performed with a TA-Hdi Texture Analyser (Texture Analyzer Model TA, United Kingdom) and a 25 kg load cell. Surimi gels were cut using knife (0.25 mm diameter) in cylinders of 25 mm diameter and 25 mm length. Each cylinder was compressed using
probe 75 (P.75) compression platen with the distance
35 mm and trigger force 10 g for 2 s. From the TPA
curves, the following texture attributes were obtained:
hardness, cohesiveness, springiness, gumminess and
chewiness. Hardness attribute was deined by peak force during the irst compression cycle. Cohesiveness attribute was calculated as the ratio of the area under the second curve to the area under the irst curve. Springiness attribute was deined as a ratio of distance of the second area at second compression and the irst area at irst compression. Gumminess attribute was obtained by multiplying hardness and cohesiveness. Chewiness attribute was obtained by multiplying gumminess and springiness (Tabilo-Munizaga and Barbosa-Cánovas, 2004).
Statistical analysis
The experiments were conducted in two replications; each replication was performed in
triplicate. Data were subjected to analysis of variance (ANOVA) at a 5% signiicance level. A comparison of means was performed by Duncan’s test to determine the signiicant difference between the treatments at P
< (0.05).
Result and Discussion
Changes in moisture content
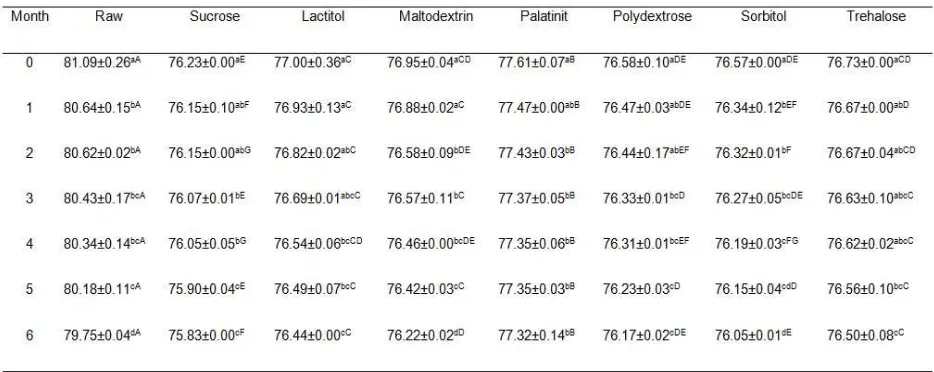
The average moisture content of each surimi
treatment is shown in Table 2. Raw surimi showed
the highest moisture content (81.0%). In the present study, moisture content of surimi prepared with different types of added low-sweetness sugar as a cryoprotectant is ranging from 76.05-77.61%. According to Lee (1985), moisture content of industrial surimi (without addition cryoprotectant)
should be less than 85% and less than 82% for high
Table 2. Changes in moisture (%) content of threadin bream surimi with different cryoprotectants during six months of frozen storage.
grade surimi (Lee, 1985). Park and Lin (2005) have suggested that the range of moisture content of
commercial surimi is 72-77%, while the majority falls between 73-76%. The moisture contents of surimi
prepared in this study were comparatively similar to what Park and Lin (2005) documented.
Generally, the moisture content of each treatment
decreased as the storage time increased, and were
signiicantly different (P<0.05). Raw surimi showed
the highest reduction in moisture content (1.65%). Meanwhile, the reductions in surimi treated with sucrose, lactitol, maltodextrin, palatinit, polydextrose,
sorbitol, and trehalose were 0.53%, 0.73%, 0.94%,
0.38%, 0.54%, 0.68%, and 0.30%, respectively. The decrease in the moisture content of surimi was due to dehydration process. Matsumoto (1980) and Matsumoto and Noguchi (1992) suggested that the
dehydration of protein molecules is caused by the
migration of water molecules to form ice crystals.
The denaturation of myoibrillar proteins through aggregation and unfolding is triggered by this
phenomenon. The use of a cryoprotectant increases
the hydration of protein molecules and decreases the aggregation of the proteins. As a result, a drastic
reduction in moisture content could be prevented.
Changes in pH
The myoibrillar proteins of various animal species are more stable at neutral pH. pH level affects
not only the denaturation rate at high temperature
but also the denaturation rate during frozen storage
(Matsumoto and Noguchi, 1992). The pH value for
each treatment is shown in Table 3. Before frozen storage, raw surimi had a pH level below 7.0.
Meanwhile the pH level of surimi samples that used a cryoprotectant started to decrease after 3 months of frozen storage.
pH is one of the most important factors in producing strong elastic surimi gels. The optimal pH for strong gelation is approximately 7.0-7.5 for
white meat ishes (Chung et al., 1994; Ni et al., 2001). Matsumoto and Noguchi (1992) suggested
that myoibrillar protein at a pH below 6.5 becomes unstable and rapidly loses its ATPase activity, which is an indicator of gel forming ability. In the present
study, raw surimi treated with maltodextrin showed the lowest value of gel strength after 6 months of storage.
Raw surimi showed the highest percentage of reduction in pH (6.16%). However, all treated-surimi recorded lower pH values than the raw one. The percentage reduction of pH of surimi treated with sucrose, lactitol, maltodextrin, palatinit, polydextrose,
sorbitol, and trehalose were 5.64%, 5.27%, 5.94%,
5.70%, 5.56%, 5.60%, and 5.37%, respectively.
The pH drops may possibly due to the build-up of
lactic acid from glycogen as a result of glycolysis. The ultimate pH is reached when glycolysis ceases and is usually around 5.5. Therefore, a pH of 5.5
is the lowest possible ultimate pH. If an animal is starved or stressed before slaughter, a higher ultimate pH will not be obtained and will affect the water holding capacity (Vaclavik and Christian, 2008). It is suggested that cryoprotectants were able to protect
excessive glycolysis that causes the reduction of pH in surimi.
Changes in water holding capacity (WHC)
The water holding capacity (WHC) usually
relects the extent of denaturation of proteins and
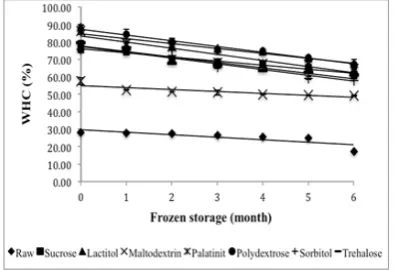
the water content (Shaviklo, 2006). The WHC of
each treatment is shown in Figure 1. The igure
shows that each cryoprotectant imparted a different cryoprotection effect on the WHC during the freezing process (P<0.05). Raw surimi and maltodextrin showed the lowest WHC. Lactitol and polydextrose
Table 3. Changes in pH of threadin bream surimi with different cryoprotectants during six months of frozen storage.
Different superscript small letters in the same column indicate a signiicant difference. Different superscript capitalized letters in the same row indicate a signiicant difference (P<0.05). Values shown are averages of triplicate analyses of duplicate surimi blocks.
Figure 1. Changes in water-holding capacity of threadin bream surimi
with different cryoprotectants during six months of frozen storage. Values shown are averages of triplicate analyses of duplicate surimi
exhibited the highest WHC during six months frozen
storage.
Generally, WHC of all treatments signiicantly
decreased as the storage time increased (P<0.05). The initial WHC of raw surimi and surimi treated with sucrose, lactitol, maltodextrin, palatinit,
polydextrose, sorbitol, and trehalose were 28.12%,
76.46%, 88.50%, 57.50%, 86.25%, 87.50%, 75.72%, and 79.75%, respectively. However, after 6 months of storage, the WHC values were reduced to 17.50%, 61.42%, 67.85%, 49.41%, 64.62%, 67.37%, 57.87%, and 61.20%, respectively for raw surimi and surimi treated with sucrose, lactitol, maltodextrin, palatinit,
polydextrose, sorbitol, and trehalose. A similar decreasing trend was also reported by Martinez
(1989) for surimi made from cod aged on ice for 14 days.
Ohkuma et al. (2008) reported that the functional
properties of myoibrillar proteins in surimi (such as gel forming ability and water-holding capacity) are lost because the proteins undergo unfolding
and aggregation during processing and storage. Meanwhile, Marianski (2009) suggested that the addition of phosphate increases the WHC of proteins and prevents water loss during cooking. Phosphates
are able to open the structure of proteins, which helps
them to hold even more water. Earlier, Julavittayanukul
et al. (2006) reported that ionic strength is enhanced
by phosphate anions, resulting in an increase in water-holding capacity by the direct binding of water to phosphate anions and by the repulsion of protein
groups due to the predominance of negative charges
on the protein groups. In other study, Vaclavik and Christian (2008) suggested that the WHC will be
excellent if a high ultimate pH is reached. Because many proteins are not close to their isoelectric points,
they are therefore able to bind to more water. Thus,
raw surimi and surimi treated with maltodextrin showed the lowest WHC among the tested samples
because their pH fell below the range of 7-7.5 after
zero months of frozen storage. In conclusion, surimi treated with cryoprotectants generally showed higher WHC than raw surimi. Among cryoprotectants used,
lactitol and polydextrose were able to maintain higher
WHC after six months of frozen storage.
Changes in gel whiteness
Color is one of the characteristics that are used
in grading surimi besides other characteristics, such
as gel strength, water content, pH, and impurities (Burden et al., 2004). Color in foods can be caused
by several factors including pigment, the inluence of heat on sugar (caramel), the reaction between
sugars and amino acids (Maillard), and the mixing of
other materials. Sahin and Sumnu (2006) suggested
that color is one of the important quality attributes of foods. Although it does not necessarily relect nutrition, lavor, or functional value, it determines the acceptability of a product by consumers.
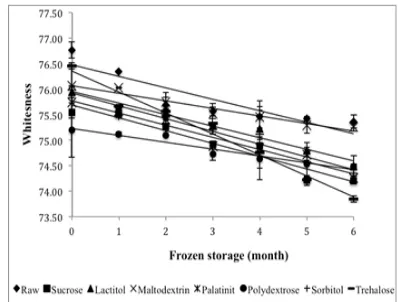
The whiteness of all surimi samples is shown in Figure 2. Results show the whiteness of all the samples was in the range from 73.85 to 76.77. In
comparison with the study by Benjakul et al. (2005),
the whiteness values of some tropical ish surimi in Thailand treated with sorbitol/sucrose (1:1) were
in the range of 70.35 to 82.01 during 24 weeks of frozen storage. After six months of frozen storage,
raw surimi exhibited the highest whiteness value, which was signiicantly different (P<0.05) among
the other samples. The addition of a cryoprotectant
affects the color of surimi. Generally, the whiteness of all the samples signiicantly decreased (P<0.05) as
the storage time increased. The decreasing trend in
this study is in agreement with the result reported by Benjakul et al. (2005) for surimi gels from croacker,
lizardish, threadin bream, and bigeye snapper mixed with 4% sucrose and 4% sorbitol. However, the trehalose-treated samples exhibited a higher
whiteness value that decreased faster during storage. The polydextrose-treated sample had the lowest value
in whiteness but could maintain its whiteness after
six of months of frozen storage as well as the sucrose, lactitol and maltodextrin treatments.
The lowest whiteness value in surimi gel
containing sugar was postulated to be due to the
Maillard reaction during the preparation of surimi
gel. Sugar has reducing carbonyl groups, which
participate in the Maillard reaction (Chung and Min,
2004). The mechanism of the reaction is the binding
Figure 2.
Changes in whiteness of surimi gel
with different cryoprotectants during six months
of frozen storage.Values shown are averages of
triplicate analyses of duplicate surimi blocks.
of free aldehyde or keton end-groups of carbohydrates
to the free amine group of lysine or arginine on proteins. Sugars that participate in this reaction are called reducing sugars (Best, 2006).
The decrease in whiteness intensity was probably
due to the adduction of pigment proteins, particularly
oxidized pigment to muscle proteins (Benjakul et al., 2005). Additionally, lipid oxidation in muscle during frozen storage might induce cross-linking of the pigment proteins and muscle proteins via the free radical process (Saeed et al., 1999). As a
consequence, those pigments may not have been removed effectively by the washing process and may have been retained in the surimi. This typically results in the decrease in whiteness of surimi (Benjakul et al., 2005).
Changes in folding test
Elasticity, an extremely important sensory
attribute of surimi, has been traditionally graded
using the folding test (Botta, 1995). The folding test
was used to measure the gel quality of the product
(Hsu, 1995). The folding test scores of surimi
samples are shown in Table 4. Surimi that featured
a cryoprotectant had a folding test score that was
higher than that of raw surimi. This inding indicates
that the cryoprotectant is effective in maintaining
the integrity of myoibrillar proteins during frozen
storage. Result shows, all samples had high folding
test scores (4), which means that they were able to
fold in half without any cracking. Nowsad et al.
(2000a) reported that the folding test could relect gel degradation very eficiently in kamaboko prepared from Alaska pollack surimi. Salt also contributes
to folding test scores. At a concentration of 1% to 3%, salt increases folding test scores (University of
Alaska Fairbanks, 1990).
The folding test scores of raw surimi decreased
after 3 months of storage. Meanwhile, the other
samples treated with sugar were able to maintain their
folding test scores. Surimi treated with maltodextrin showed the highest decrease in folding test score after
4 month of frozen storage, followed by surimi treated with sucrose, lactitol, and sorbitol after 6 month of
storage. Surimi mixed with palatinit, polydextrose and trehalose maintained its folding test score from four to six months of frozen storage. Nowsad et al.
(2000b) also reported that spent hen surimi treated with sucrose and sorbitol was able to maintain its folding test score between four and six months of
frozen storage. These results provide information
about the cryoprotection effect of sugar on folding
test score during frozen storage.
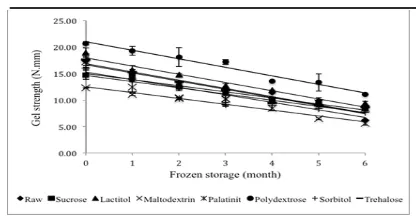
Changes in gel strength
The gel strengths of the samples are shown in
Figure 3. The measurement of gel quality relects the quality of the raw material, the effect of washing
cycles on the concentration of actin and myosin, and
any changes brought about by frozen storage (Hall and
Ahmad, 1997). The gel strengths all the samples were in the range 5.60 – 20.64 N.mm during six months
of frozen storage and were signiicantly different
(P<0.05) among all the samples. Mahawanich et al. (2010) reported that the gel strength of red tilapia
surimi treated with sucrose and sorbitol was in the
range 0.57-0.85 N.mm, lower than the results in this study. The cryoprotective effect each cryoprotectant exerted was different due to the freezing process. Polydextrose showed the highest gel strength among
the samples and was able to maintain higher gel
strength until six months of frozen storage compared with sucrose and the other treatments. Zhou et al. (2010) reported that polydextrose protects darce
surimi with its ability to prevent the decrease in gel
strength during 26 weeks of frozen storage. The
lowest gel strength was observed for maltodextrin. The same result was also reported by Medina and Garrote (2002) that suribí surimi gel treated with maltodextrin/sorbitol showed a lower resistance than
Table 4. Changes in folding test of threadin bream surimi with different cryoprotectants during six months of frozen storage.
Different superscript small letters in the same column indicate a signiicant difference. Different superscript capitalized letters in the same row indicate a signiicant difference (P<0.05). Values shown are averages of triplicate analyses of duplicate surimi blocks.
Figure 3. Changes in gel strength of surimi gel with different cryoprotectants during six months of frozen storage. Values shown are averages of triplicate analyses of duplicate surimi blocks. Data are
surimi treated with a sucrose/sorbitol mixture from 4
to 180 days of storage.
The decreasing gel strength was signiicantly
different (P<0.05) among the treatments until six months of frozen storage. The initial gel strength values for raw surimi, sucrose, lactitol, maltodextrin,
palatinit, polydextrose, sorbitol, and trehalose were
17.36, 14.69, 18.90, 12.26, 17.18, 20.64, 16.05, and
17.62 N.mm, respectively, and the inal gel strength
values were 6.25, 8.34, 9.41, 5.59, 8.45, 11.05, 7.70, and 8.62 N.mm, respectively. The decreasing trend
in gel strength has also been observed in grass carp
surimi during 25 weeks of frozen storage (Pan et al., 2010).
Gel-forming ability is a direct indicator of the quality of ish proteins. Salt linkages, hydrogen bonds, disulide bonds and hydrophobic interactions are the main types of bonds that contribute to the building
of a network structure during gelation (Sen, 2005).
Myosin is responsible for the gel-forming ability
of surimi. The denaturation of myosin can lead to
a decrease in gel-forming ability (Pan et al., 2010).
Benjakul et al. (2002) suggested that a decrease in gel strength is related to a decrease in water-holding capacity. Thus, the gel strength of surimi treated with maltodextrin was the lowest compared to that of the other cryoprotectants.
pH is also used primarily as an indirect
measurement of gel-forming ability (Lanier, 1992).
Thus, the decrease in gel strength was correlated to
decreasing pH surimi as shown in Table 3. In the
present study, polydextrose showed an excellent value after six months of frozen storage, which indicates that polydextrose could maintain protein integrity, especially that of myosin, during six months of frozen storage.
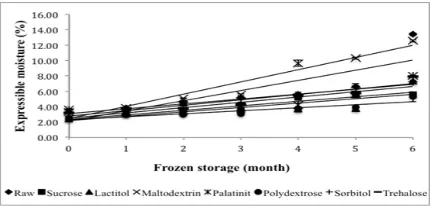
Changes in expressible moisture
Expressible moisture is correlated to water holding capacity. High expressible moisture indicates poor water-holding capacity (Chaijan et al., 2006).
The expressible moisture values of all the samples are shown in Figure 4. Generally, the expressible
moisture of all the samples increased as the storage
increased and was signiicantly different (P<0.05)
from month to month. The similar result was reported
by Mahawanich et al. (2010). They found that the
expressible moisture of tilapia surimi gel mixed with sucrose and sorbitol increases during 9 months of frozen storage. The range of expressible moisture
for all the samples was 2.38-13.42% and was
signiicantly different (P<0.05) among the samples
during six months of frozen storage. Mawanich et al. (2010) reported that the expressible moisture of
surimi gel prepared from tilapia surimi mixed with
sucrose and sorbitol was in the range 9.59-12.92% during 9 months of frozen storage and began with a higher expressible moisture than the samples used in
this study.
The initial expressible moisture values of raw
surimi and surimi treated with sucrose, lactitol,
maltodextrin, palatinit, polydextrose, sorbitol, and
trehalose were3.32%, 2.44%, 2.38%, 3.60%, 3.29%, 2.56%, 3.59%, and 3.22%, respectively, while the
inal values were 13.42%, 5.62%, 7.30%, 12.57%,
8.05%, 5.27%, 7.24%, and 7.90%, respectively.
Sorbitol and polydextrose were able to maintain the lowest expressible moisture after six months
of frozen storage with an increase of 50.36% and 51.41%, respectively, from their initial values. Raw surimi had the highest percentage increase of 75.26%. Among the other cryoprotectants, maltodextrin had the highest percentage increase of 71.34%. Sucrose
exhibited an increase in expressible moisture of 56.67%, which was higher than that of sorbitol and
polydextrose.
The highest percentage increase in expressible moisture was observed for raw surimi and maltodextrin, which was caused by the autolytic degradation of ish
protein during storage. As a result, surimi gel formed a poor gel matrix with lower water holding capacity,
resulting in higher expressible moisture (Benjakul et al., 1997). This inding agrees with the result reported
by Mahawanich et al. (2010), who stated that the
expressible moisture of gel produced from red tilapia
surimi up to 9 months of frozen storage increased as the storage time increased. According to the results
of this study, sorbitol and polydextrose were able to maintain the sharp decrease in expressible moisture
during six months of frozen storage.
Changes in texture proile
The hardness of surimi is shown in Figure 5. The hardness values of all the samples were in the range
29.52 – 93.72 N and were signiicantly different among
the samples (P<0.05). Dey and Dora (2010) reported
Figure 4. Changes in expressible moisture of surimi gel with different cryoprotectants during six months of frozen storage. Values shown are averages of triplicate analyses of duplicate surimi blocks. Data are
that the hardness of surimi gel prepared from croaker
ish mixed with sucrose and sorbitol was in the range
5.88-17.65 N during 180 days frozen storage, which
is lower than the results in this study. Generally, the
hardness of all the samples decreased (P<0.05) as the storage time increased. Palatinit showed the highest
value at zero months, followed by polydextrose.
During frozen storage, polydextrose was seen to
be able to maintain the highest hardness among the samples. The lowest hardness value was observed for
surimi treated with maltodextrin. Meanwhile, surimi
with added sucrose showed a hardness value below
that treated with polydextrose.
Ha et al. (2001) reported that moisture affects the
hardness of ish paste containing Agaricus bisporus. Kang et al. (2010) also reported that lower moisture
in surimi-like beef results in stronger gel hardness.
Martinez (1989) suggested that the protein content of
surimi samples is known to have a great inluence
on the hardness of the gels made from surimi, while
the protein quality inluences their elasticity. It was
presumed that the polydextrose-treated sample was
able to retain its hardness after six months of frozen
storage.
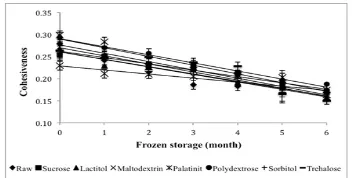
Cohesiveness is deined as the work done to break down the internal bonds in surimi (Luo et al., 2010). The cohesiveness value affects the hardness value of surimi gel; the sample that has the highest cohesiveness will have the highest hardness. The cohesiveness values of the surimi samples are presented in Figure 6. The cohesiveness values all the samples were in
the range 0.15 – 0.30 and were generally signiicantly
different (P<0.05) from each other. Dey and Dora (2010) reported that the cohesiveness value of surimi
gel prepared from croaker ish treated with sucrose and sorbitol was in the range 0.5-0.9 during 180 days
frozen storage, which is lower than the results in this study. The decreasing value of cohesiveness was
shown to be signiicantly different (P<0.05) between
samples during six months of frozen storage.
Before frozen storage, palatinit showed the
highest value for cohesiveness, followed by
polydextrose. Maltodextrin had the lowest value for
cohesiveness. Polydextrose was seen to be able to
maintain the highest value for cohesiveness until the
end of frozen storage. Tabilo-Munizaga and Barbosa-Cánovas (2004) reported that a cohesiveness value close to 1 indicates sample recovery after the irst
compression. The cohesiveness value was far from 1 for all treatments in this study, indicating that the
sample was recovered after the irst compression.
In the present study, polydextrose demonstrated its potential as a cryoprotectant in maintaining the cohesiveness of surimi gel.
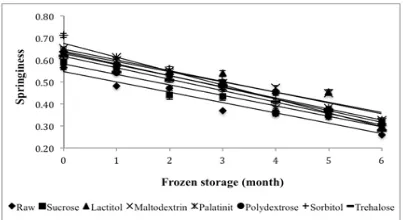
Springiness is deined as the rate at which a
deformed surimi recovers its initial condition (Luo
et al., 2010). The springiness of surimi samples is shown in Figure 7. The springiness values were in
the range 0.26 – 0.71 and were signiicantly different
(P<0.05) among the samples. Dey and Dora (2010) reported that the springiness value of surimi gel
prepared from croaker ish treated with sucrose and sorbitol was in the range 0.8-1.3 during 180 days
frozen storage, which is higher than the results in this
study. The decrease in springiness was signiicantly
different (P<0.05) among the samples during six months of frozen storage.
Sorbitol exhibited the highest springiness value but also had the highest percentage decrease
(56.68%). Sucrose and palatinit showed the lowest percentage decrease among the other samples: 46.16% and 47.40%, respectively. The highest percentage
decrease was exhibited by sorbitol. Raw surimi had
the lowest value starting from zero months of frozen
storage until six months of frozen storage. Tabilo-Munizaga and Barbosa-Cánovas (2004) reported that
springiness is a typical characteristic of viscoelastic materials. Chung et al. (2010) suggested that the raw
material of ish meat, the condition of the preparation
of the surimi gel and the formation of the net structure affect the springiness. The integrity of myosin is of great importance for gelation (An et al., 1996). The degradation of myosin results in inferior gel network formation, producing a poor water-holding capacity
in a gel matrix with a lower elasticity (Benjakul et al.,
Figure 5. Changes in hardness of surimi gel with different cryoprotectants during six months of frozen storage. Values shown are averages of triplicate analyses of duplicate surimi
blocks. Data are shown as the mean ± SD.
Figure 6. Changes in cohesiveness of surimi gel with different cryoprotectants during six months of frozen storage. Values shown are averages of triplicate analyses of duplicate surimi blocks. Data are
2003). The result shows palatinit-treated sample was
able to maintain its springiness value after six months
of frozen storage in comparison with sucrose.
The gumminess of all the samples is shown in Figure 8. The gumminess values were in the range
4.81 – 27.96 N and were signiicantly different
(P<0.05) among the samples. Dey and Dora (2010) reported that the gumminess value of surimi gel
prepared from croaker ish mixed with sucrose and sorbitol was in the range 2.94-16.67 N during 180
days frozen storage, which is lower than the results in this study. The decreasing values of gumminess were
also signiicantly different after six months of frozen storage. Palatinit exhibited the highest gumminess value at 0 months of frozen storage, followed by
polydextrose. Maltodextrin showed the lowest value
in gumminess. Gumminess is a complementary parameter of hardness (Tabilo-Munizaga and Barbosa-Cánovas, 2004). It is suggested that polydextrose can be a potential cryoprotectant that can maintain
the highest gumminess over six months of frozen storage.
Chewiness is deined as the energy required to
chew surimi until it is ready to swallow (Luo et al., 2010). The chewiness values of all the samples are shown in Figure 9. The chewiness values of all the samples were in the range 1.45 – 17.40 N during six months of frozen storage and were generally
signiicantly different (P<0.05) from each other. Dey
and Dora (2010) reported that the chewiness value
surimi gel prepared from croaker ish mixed with sucrose and sorbitol was in the range 1.96-22.56 N
during 180 days frozen storage, slightly higher than the results in this study. The decreasing value of
chewiness was also signiicantly different (P<0.05)
after six months of frozen storage.
Palatinit exhibited the highest chewiness at zero months of frozen storage, followed by polydextrose.
Maltodextrin showed the lowest value in chewiness. Cardoso et al. (2009) reported that chewiness is
a parameter that provides a global assessment of textural quality. Chewiness is also a complementary
parameter of hardness. According to this study, polydextrose can retain excellent chewiness after six months of frozen storage.
Conclusion
Generally, surimi treated with a cryoprotectant exhibits better physicochemical properties compared with raw surimi. Polydextrose was able to maintain better physicochemical properties than the other
low-sweetness sugars and sucrose during six months of frozen storage.
Acknowledgements
The authors acknowledge with gratitude the
support given by Universiti Sains Malaysia (USM) for
our research in this area and USM Fellowship and also
the aid of research grant from MALAYAN SUGAR MANUFACTURING COMPANY BERHAD.
References
An, H., Peters, M. Y. and Seymour, T. A. 1996. Roles of endogenous enzymes in surimi gelation. Trends in Food Science and Technology 7 (10): 321-327.
AOAC. 2000. Oficial methods of analysis (17th ed.).
Gaithersburg, Maryland, USA: Association of Oficial
Analytical Chemist
Figure 7. Changes in springiness of surimi gel with different cryoprotectants during six months of frozen storage. Values shown are averages of triplicate analyses of duplicate surimi blocks. Data are
shown as the mean ± SD
Figure 8. Changes in gumminess of surimi gel with different cryoprotectants during six months of frozen storage. Values shown are averages of triplicate analyses of duplicate surimi blocks. Data are
shown as the mean ± SD
Benjakul, S., Seymour, T. A. and Morrissey, M. T. 1997. Physicochemical changes in paciic whiting muscle
proteins during ice storage. Journal of Food Science 62 (4): 729–733.
Benjakul, S., Visessanguan, W., Riebroy, S., Ishizaki, S. and Tanaka, M. 2002. Gel-forming properties of
surimi produced from bigeye snapper, Priacanthus
tayenus and P. macracanthus, stored in ice. Journal of the Science of Food and Agriculture 82 (13): 1442– 1451.
Benjakul, S., Vissessanguan, W. and Tueksuban, J. 2003.
Changes in physic-chemical properties and
gel-forming ability of lizardish (Saurida tumbil) during
post-mortem storage in ice. Food Chemistry 80 (4): 535-544.
Benjakul, S., Visessanguan, W., Thongkaew, C. and
Tanaka, M. 2005. Effect of frozen storage on chemical
and gel-forming properties of ish commonly used for
surimi production in Thailand. Food Hydrocolloid 19 (2): 197-207.
Best, B. 2006. Vitriication in cryonics. Available from:
http://www.benbest.com/cryonics/vitrify.html on 3/ 25/2011.
Botta, J.R. 1995. Evaluation of seafood freshness quality. New York: VCH Publisher, Inc.
Burden, M., Sylvia, G. and Kolbe, E. 2004. Optimal
storage temperature design frozen seafood inventories:
application to Paciic Whiting surimi. In: Proceedings
of the Twelfth Biennial Conference of the International Institute of Fisheries Economics and Trade, July 21-30, 2004, Tokyo, Japan, pp. 1-13. ISBN: 0-97632-0-7
Cardoso, C., Mendes, R., Vaz-Pires, P. and Nunes, M. L. 2009. Effect of dietary ibre and MTGase on the quality of mackerel surimi gels. Journal of Science of
Food and Agriculture 89 (10): 1648-1658.
Carvajal, P. A., MacDonald, G. A. and Lanier, T. C. 1999. Cryostabilization mechanism of ish muscle proteins by maltodextrins. Journal of Cryobiology 38 (1):
16-26.
Chaijan, M., Benjakul, S., Visessanguan, W. and Fautsman,
C. 2006. Physichochemical properties, gel-forming
ability and myoglobin content of sardine (Sardinella
gibbosa) and mackerel (Rastrelliger kanagurta)
surimi produced by conventional method and alkaline solubilisation process. European Food Research
Technology 222 (1-2): 58-63. whiting surimi. Journal Aquatic Food Product
Technology 2 (3): 19–35.
Chung, S. I., Kim, S. Y., Nam, Y. J. and Kang, M. Y. 2010. Development of surimi gel from king oyster
mushroom and cuttleish meat paste. Food Science
and Biotechnology 19 (1): 51-56.
Dey, S. S. and Dora, K. C. 2010. Suitability of chitosan
as cryoprotectant on croaker ish (Johnius gangeticus)
surimi during frozen storage. Journal of Food Science
and Technology. DOI: 10.1007/s13197-010-0197-8. Ha, J. U., Koo, S. G, Lee, H. J, Hwang, Y. M. and Lee, S.
C. 2001. Physical properties of ish paste containing
Agaricus bisporus. Korean Journal of Food Science Journal of Food Engineering 24 (1): 101-111.
Julavittayanukul, O., Benjakul, S. and Visessanguan. 2006. Effect of phosphate compounds on gel-forming ability
of surimi from bigeye snapper (Priacanthus tayenus).
Food Hydrocolloid 20 (8): 1153-1163.
Kang, G. H., Park, G. B., Joo, S. T., Lee, M. and Lee, S. K. 2010. Effects of muscle iber types on gel property of surimi-like materials from chicken, pork and beef.
Journal of Muscle Food 21 (3): 570-584.
Lanier, T. C. 1992. Measurement of surimi composition and functional properties. In Lanier, T.C. and C.M. Lee (Eds). Surimi Technology, p. 123-163. New York: Marcel Dekker.
Lee, C. 1985. Surimi processing: surimi manufacturing and
fabrication of surimi-based products. Presented at the
45th Annual Meeting of Inst. of Food Technologists,
Atlanta, GA, 9-12 June 1985.
Luo, Y., Shen, H., Pan, D. and Bu, G. 2008. Gel properties
of surimi from silver carp (Hypophthalmichthys molitrix) as affected by heat treatment and soy protein
isolate. Food Hydrocolloid 22 (8): 1513–1519. Luo, X., Yang, R., Zhao, W., Cheng, Z. and Jiang,
X. 2010. Gelling properties of Spanish mackerel
(Scomberomorus niphonius) surimi as affected by
washing process and high pressure. International Journal of Food Engineering 6 (4): 1-17.
MacDonald, G. A. and Lanier, T. C. 1991. Carbohydrates
as cryoprotectants for meats and surimi. Food Technology 45 (3): 152-154.
Mahawanich, T., Lekhavichitr, J. and Duangmal, K. 2010.
Gel properties of red tilapia: effects of setting condition, ish freshness and frozen storage. International Journal
of Food Science and Technology 45 (9): 1777-1786. Marianski, S. and Marianski, A. 2009. The art of making
fermented sausages. USA: Bookmagic, LLC.
Martinez, I. 1989. Water retention properties and solubility of the myoibrillar proteins: Interrelationships and possible values as indicators of the gel strength in cod surimi by a multivariate data analysis. Journal of the
Science of Food and Agriculture 46 (4): 469-479. Matsumoto, J. J. 1980. Chemical deterioration of muscle
proteins during frozen storage. ACS symposium series 123: 95-124.
Matsumoto, J. J. and Noguchi, S. F. 1992. Cryostabilization
of protein surimi. In Lanier, T.C. and C.M. Lee (Eds.). Surimi Technology. p. 357-388. New York: Marcel Dekker.
cryoprotectant mixtures on frozen suribí surimi.
Brazilian Journal of Chemical Engineering, 19:419-424.
Ni, S., Nozawa, H. and Seki, N. 2001. Effect of pH on the gelation of walleye pollack surimi and carp actomyosin pastes. Fisheries Science 67 (5): 920–927.
Nielsen, R. G. and G. M. Pigott. 1994. Gel strength increased in low-grade heat-set surimi with blended
phosphates. Journal of Food Science 59 (2): 246-250. Nowsad, A. A., Kanoh, S. and Niwa, E. 2000a.
Measurement of elastic properties of kamaboko and other food gels by a new simpliied rheometer. Asian
Fisheries Science 13 (1): 65-74.
Nowsad, A. A., Huang, W. F., Kanoh, S. and Niwat, E.
2000.b Washing and cryoprotectant effects on frozen
storage of spent hen surimi. Journal of Poultry Science 79 (6): 913-920.
Ohkuma, C., Kawai, K., Viriyarattanasak, C., Mahawanich, T., Tantratian, S., Takai, R. and Suzuki, T. 2008. Glass
transition properties of frozen and freeze-dried surimi products: Affect of sugar and moisture on the glass transition temperature. Food Hydrocolloid 22 (2): 255-262.
Okada, M. 1992. History of surimi technology in Japan. In
Lanier, T.C and Lee, C.M. (Eds). Surimi Technology, p. 3-21. New York: Marcel Dekker Inc.
Pan. J, Shen. H. and Luo. Y. 2010. Cryoprotective effects of trehalose on grass carp (Ctenopharyngodon idellus) surimi during frozen storage. Journal of Food Processing Preservation 34 (4): 715-727.
Park, J. W. and Lin, T. M. J. 2005. Surimi: Manufacturing and evaluation. In Park, J.W. (Ed). Surimi and Surimi Seafood. 2nd edition, p. 33-106, Boca Raton: Taylor
and Francis Group.
Park, J. W. and Morrisey, M. T. 2000. Manufacturing
of surimi from light muscle ish. In Park, J.W (Ed).
Surimi and Surimi Seafood, p. 23-58. New York: Marcel Dekker.
Park, J. W., Lanier, T. C. and Green, D. P. 1988.
Cryoprotective effects of sugar, polyols and/or phosphates on alaska pollack surimi. Journal of Food Science 53 (1): 1-3.
Saeed, S., Fawthrop, S. A. and Howell, N. K. 1999. Electron spin resonance (ESR) study on free-radical transfer in
ish lipid-protein interactions. Journal of the Science
of Food and Agriculture 79 (13): 1809-1816.
Sahin, S. and Sumnu, S. G. 2006. Physical properties of
foods. Springer. USA.
Sen, D.P. 2005. Advances in ish processing technology. New Delhi: Allied publishers PVT. LTD.
Shaviklo, G.Z. 2006. Quality assessment of ish protein
isolates using surimi standart methods. The United
Nations University, isheries training programme. Ice
land
Somjit, K., Ruttanapornwareesakul, Y., Hara, K. and
Nozaki, Y. 2005. The cryoprotective effect of shrimp chitin and shrimp chitin hydrolysate on denaturation
and unfrozen water of lizardish surimi during frozen
storage. Food Research International 38 (4): 345-355.
Sultanbawa, Y. and Li-Chan, C. Y. 1998. Cryoprotective
effects sugar and polyol blends in ling cod surimi
during frozen storage. Food Research International 31 (2): 87-98.
Sych. J, Lacroix. C, Adambounou. L. T. and Castaigne. F.
1990. Cryoprotective effects of lactitol, palatinit and polydextrose on cod surimi proteins during frozen storage. Journal of Food Science 55 (2) 356-360.
Tabilo-Munizaga, G. and Barbosa-Cánovas, G. V. 2004.
Color and textural parameters of pressurized and
heat-treated surimi gels as affected by potato starch and egg
white. Food Research International, 37, 767-775.
University of Alaska Fairbanks. 1990. Comparison of the
punch, torsion, constant rate deformation and dynamic force deformation tests to determine rheological properties of surimi gels. School of Fisheries and
Ocean Sciences, Fisheries Industrial Technology
Center. Alaska.
Yoon, K. S. and Lee, C. M. 1990. Cryoprotective effects in
surimi and surimi /minced-based extruded products.
Journal of Food Science 55 (5) 1210-1216.
Zhou, A., Gong, C.,Cao, H., Guo, W., Liu, X. and Chen,