The Performance of Indonesia’s
Manufacturing
Industry
Bernadette Robiani
Faculty of Economics, University of Sriwijaya, Palembang, South Sumatra, Indonesia, [email protected]
Abstract:
This paper discusses the performance of Indonesia’s Manufacturing Industry. This paper shows some classic problems in Industrial sector such as its contribution to national income, labour absorption, Input value, output value, value added, efficiency, imported raw material. The data used are 4 digits ISIC of Medium and Large Industry, for year 2004 -2011. The technical analysis used is descriptive analysis. It is concluded that manufacturing industry performance is still unstable. The implementation of government policies still need to consider many aspects such as the domestic market, the sustainability of raw material, the linkages between industrial sector and other sector and the government regulation.
Keywords: Efficiency, Input Value, Labour Absorption, Number Of Firms,
Performance, RCA, and Value Added
Bibliographical
notes:Bernadette Robiani is a lecturer and also head of doctorate program of Faculty of Economics, University of Sriwijaya
1 Introduction
The development of non-oil manufacturing industry during 2004-2012 shows a positive growth, except wood, paper, and other industries which have a negative growth. ( See Table 1) The contribution of non –oil manufacturing industry to manufacturing industry’s GDP was 90,45%, while 9,55% contributed by those three industries. There are some factors influence the development of non-oil manufacturing industry such as government policies, investment, market demand, competitiviness.
Table 1. Growth of Manufacturing Industry Non Oil
Industry 2004 2005 2006 2007 2008 2009 2010 2011 2012 Food 1,39 2,75 7,21 5,05 2,34 11,22 2,78 9,14 7,74 Textile 4,06 1,31 1,23 -3,88 -3,64 0,60 1,77 7,52 4,19 Wood -2,07 -0,92 -0,66 -1,74 3,45 -1,38 -3,47 0,35 -2,78 Paper 7,61 2,39 2,09 5,79 -1,48 6,34 1,67 1,4 -5,26 Fertilizier 9,01 8,77 4,48 5,69 4,96 1,64 4,7 3,95 10,25 Cement 9,53 3,81 0,53 3,4 -1,49 -0,51 2,18 7,19 7,85 Metal -2,61 -3,70 4,73 1,69 -2,05 -4,26 2,38 13,06 6,45 Machine 17,67 12,38 7,55 9,73 9,79 -2,87 10,38 6,81 6,94 Others 12,77 2,61 3,62 -2,82 -0,96 3,19 3,0 1,82 -1,0 Total 7,51 5,86 5,27 5,15 4,05 2,56 5,12 6,74 6,4 Source: Ministry of Industry, Report of Work Progress, 2013, page 13.
Refers to Labour for Survey data in 2011, industrial sector absorbed 14,54 million worker or 13,39% of total worker. Compare to number of workers in 2001 which was 12,1 million, means that there is an increasing in labour absorption as much as 2,5 million for ten years. This absorption is lower than it’s of agricultural which is 40% of total worker. The number of labour in non – oil manufacturing industries increased during 2005 – 2012 as much as 22,04%, from 11.841.908 worker in 2005 increased to 14.452.333 worker in 2012. (including micro and small scale industries and informal sector)
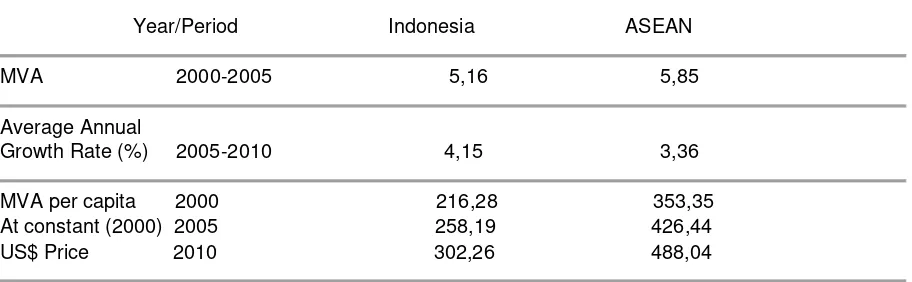
If we compare the performance of Indonesia’s manufacturing industry to other ASEAN countries, it indicates that Indonesia manufacturing industry still indicates a good prospect to invest (see Table 2). Value added Indonesia ‘s manufacturing industry was lower than its of ASEAN countries during 2000-2005. However the average annual growth rate shows good performance of Indonesia manufacturing industry since its higher than other ASEAN countries.
Table 2. Comparison Manufacturing Value Added (MVA) of Indonesia and ASEAN
Year/Period Indonesia ASEAN
MVA 2000-2005 5,16 5,85
Average Annual
Growth Rate (%) 2005-2010 4,15 3,36
MVA per capita 2000 216,28 353,35 At constant (2000) 2005 258,19 426,44 US$ Price 2010 302,26 488,04
The MVA per capita of Indonesia is lower than its of ASEAN for 2005 – 2010. It relates to two factors, the wage rate and the unemployment. The oversupply condition in labor market causes the wage rate tends to be stable (infact, there is an increasing in minimum regional wage rate with minimum percentage).
In general, there are some classics problems in the industrial development in Indonesia such as the weak of industry linkages, undercapacities production, high cost production, uncompetitive prices, government regulation and law enforcement. These problems influence the performance and competitiviness of industrial sector. As mentioned in Koch (1980, p.4-6) and Shepherd (1990, p.6)) performance of industry is determined by its structure and conduct. As explained by Hasibuan (1993, p 216-221) the intermediate input cost will determine value added of one industry. If the increase of intermediate input cost bigger than increase of value of output, it will decrease its value added. Martin (1984, p.16-22) explained that variable cost will influence the economies of scale of industry. The lower the average variable cost will increase the economies of scale and further will increase its competitiviness.
This paper aims to discuss the performance of Indonesia’s non –oil manufacturing industry during 2004 – 2011 using Medium and Large Scale Industry for 4 Digit and 5 Digit of International Standard Industrial Classification of All Economic Activities (ISIC) published by Statistic Indonesia. The Performance is measured by input value, value added, and efficiency. The technical analysis used is qualitative analysis using cross table analysis. Section 2 of this paper shows data and discussion of performance variables. Section 3 is the conclusion.
2
Indonesia’s Manufacturing Performances
2.1 Performances
2.1.1 Number of Firms and Labour Absorption
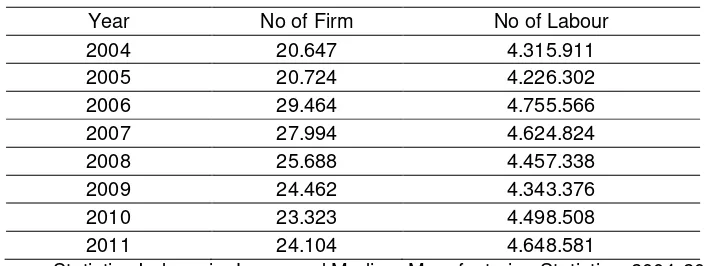
Number of firms describes quantity of firm in one industry. During year 2004-2011, the number of firms in medium and large scale industries increased. In 2004, there was 20.647 unit firms, increased as much 16, 75% to be 24.104 unit firms in 2011. (see Table 3). The increasing during this period is because of a high increased in 2004 – 2006 as much as 42,70%. After 2006, number of firms decreased as much as 20,84% in 2010. There was an increasing as much as 3,3% in 2011.
Table 3. Number of Firms and Number of Labour of Medium and Large Scale Industries, 2004-2011 Year No of Firm No of Labour
2004 20.647 4.315.911
2005 20.724 4.226.302
2006 29.464 4.755.566
2007 27.994 4.624.824
2008 25.688 4.457.338
2009 24.462 4.343.376
2010 23.323 4.498.508
2011 24.104 4.648.581
labour in manufacturing industry was 20.647 person, increased as much as 16,74% to be 24.104 worker in 2011. The increasing during this period is because of high increase in 2004 – 2006 as much as 42,70%. After 2006, number of labour decreased as much as 18,20 % in 2011. Data from Table 3 shows that there is the same pattern between number of firm and number of labour.
There are some factors that influenced the fluctuation of number of firms, such as barrier to entry factors. The higher the requirement of capital and technology , the higher barrier for new firm to entry. The higher the concentration of industry, the more difficult for new firm to entry. The more easier for firm to get access to raw material and market, the higher number of firms in industry. Theoritically, increasing in number of firm will increase supply and effect to usage of factors production such as labour.
Using 5 digit ISIC classification, there are five industries that have high number of firms among 354 industry in non-oil manufacturing industry; wearing apparel made of textile ( ISIC 18101); wood furniture ( ISIC 36101); all kinds of chip and similar to chips (ISIC 15496); bakery products (ISIC 15410); clay tiles (ISIC 26323). (see Table 4 below).
During 2004-2011, percentage of number of firms (to total firms ) of these five industries tend to be stable, except for ISIC 18101, eventhough there is an increased and decreased in number of firms. It shows the existency of industries and indicates low barrier to entry. These industries can be classified as non high technology industries and tend to be labour oriented industries.
Table 4. Five Highest Industry For Number of Firm (percentage of total) ISIC/Year 2004 2005 2006 2007 2008 2009 2010 2011
18101 9% 9% 12% 10% 10% 8% 8% 9%
36101 5% 5% 7% 5% 5% 5% 5% 5%
15496 3% 3% 4% 3% 4% 3% 4% 4%
15410 3% 3% 3% 3% 3% 3% 3% 3%
26323 3% 3% 3% 2% 3% 3% 3% 3%
Source: Statistics Indonesia, Large and Medium Manufacturing Industry Statistics, 2004-2011
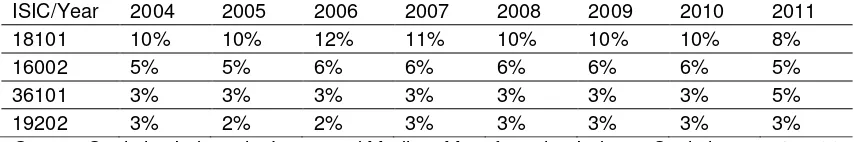
Using 5 digit ISIC classification, there are four industries that have high number of labour among 354 non-oil manufacturing industries during 2004 – 2011: wearing apparel made of textile ( ISIC 18101); wood furniture ( ISIC 36101); all kinds of chip and similar to chips (ISIC 15496); clove cigarettes (16002) (see Table 5 below)
Table 5. Four Highest Industry for Number of labour (percentage of total) ISIC/Year 2004 2005 2006 2007 2008 2009 2010 2011 18101 10% 10% 12% 11% 10% 10% 10% 8%
16002 5% 5% 6% 6% 6% 6% 6% 5%
36101 3% 3% 3% 3% 3% 3% 3% 5%
19202 3% 2% 2% 3% 3% 3% 3% 3%
Source: Statistics Indonesia, Large and Medium Manufacturing Industry Statistics, 2004-2011
2.1.2 Value of Input and Value of Output
The value of input describes cost of industries in production output especially for factors production cost. During 2004 – 2011, value of input of manufacturing industries increased as much as 105%, from 625.639.286.096 (million rupiah) in 2004 increase to 1.282.300.313.892 (million rupiah) in 2011. (see Table 6). Except in 2010-2011, there is an increasing value of input each year. It means that cost of production in manufacturing industries always goes up.
The value of output may become a proxy of firm revenue from their production or sales. During 2004-2011, value of output of manufacturing industry increased as much as 145%. (see Table 6) The growth of value of ouput is higher than its of input value. It means that industries gain profit from their production. It indicates that Indonesia’s manufacturing industry is prospectful and need to be considered.
Table 6. Value of Input and Output of
Medium and Large Scale Industries, 2004 – 2011 (million rupiah) Year Value of Input Value of output 2004 625.639.286.096 983.796.795.197 2005 692.214.336.220 1.088.633.841.093 2006 778.213.887.772 1.292.554.561.379 2007 848.598.262.612 1.546.993.062.967 2008 1.197.813.992.517 1.917.292.213.369 2009 1.200.397.110.963 2.000.717.719.565 2010 1.317.016.141.274 2.208.062.156.587 2011 1.282.300.313.892 2.407.456.919.239
Source: Statistics Indonesia, Large and Medium Manufacturing Industry Statistics, 2004-2011
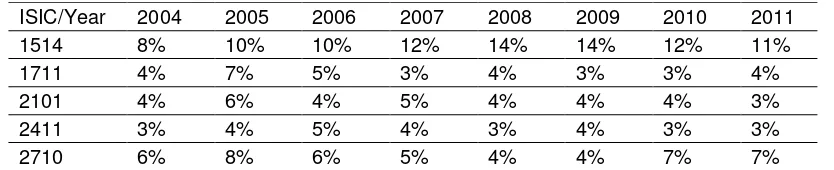
There are five industries that have high contribution to total value of input; cooking oil and fat from plants and animals industry (ISIC 1514); preparation of textile fiber (1711): pulp industry (2101); basic iron and steel industry (ISIC 2710) ;basic inorganic and organic chemical industry (ISIC 2411) shared 3,4% in 2004 decreased to be 2,9% in 2011. (see Table 7). These five industries have high number of input cost and tend to increase during 2004-2010.
Table 7. Five Industries for Value of Input (Percentage of Total)
ISIC/Year 2004 2005 2006 2007 2008 2009 2010 2011 1514 8% 10% 10% 12% 14% 14% 12% 11%
1711 4% 7% 5% 3% 4% 3% 3% 4%
2101 4% 6% 4% 5% 4% 4% 4% 3%
2411 3% 4% 5% 4% 3% 4% 3% 3%
2710 6% 8% 6% 5% 4% 4% 7% 7%
Source: Statistics Indonesia, Large and Medium Manufacturing Industry Statistics, 2004 - 2011
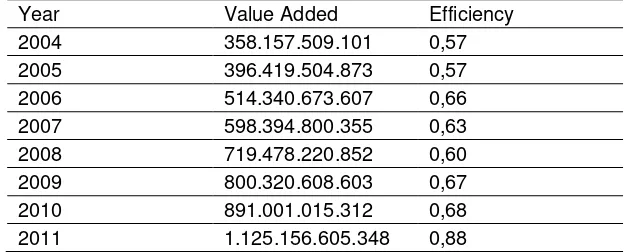
2.1.3 Value Added and Eficiency
There is an increasing value added growth during period 2004 - 2011 from 16 % in 2004-2005 to 26% in 2010-2011 (see table 8). There are three industries that have dominant level of efficiency. Calculating the ratio of value added to input value, we may know the level of efficiency. There is an increasing in efficiency during observation year. In 2004, efficiency was 0,57 and in 2011 increase to be 0,88. An industry is classified efficient if its coefficient of efficiency greater than or equal to one. It can be concluded that Indonesian manufacturing industry during this period has not been efficient yet. During the observation years, ISIC 2101 has the highest efficiency, on the average is 0.75, while ISIC 2411 is 0.52 , ISIC 1514 is 0,50 and ISIC 2710 is 0.26. It means that an efficient industry is an industry that is able to create high added value such as that of the ISIC 1514 and ISIC 2101. Basic chemical industry (ISIC 2411) and basic metal industries of iron and steel (ISIC 2710) which has high level of import of raw material has a relatively low efficiency.
Table 8. Value Added and Efficiency of Medium and Large Scale Industries Year Value Added Efficiency
Source: Statistics Indonesia, Large and Medium Manufacturing Industry Statistics, 2004-2011
2.2 Disscussion
Industries Program, clusters program and product competitive, that have not showed maximum performance. The large number of industries that are considered priorities make it difficult to measure the performance of the industry as a whole. Some of the industries that are considered priorities still have high dependency on imported raw materials. Cluster program that ideally should be able to create linkages between the main and supporting industries, create linkages between scale industries, create production and distribution efficiencies, has not been supported by the quantity and quality of human resources, infrastructure and commitment of all actors. Competitive product’s program is basically a bottom-up program, however its implementation faced many basic obstacles such as preparation of local government related to sustainability of raw materials, infrastructure, investment, linkages with other sectors, aspects of marketing, human resources (skill and managerial). These all influence the succeed of the program.
3 Conclusion
Performance of Indonesian Manufacturing Industry shows unstable condition . There is increasing number of firms especially in labour intensive industries such as ISIC 1810 and ISIC 3610. There is also increasing in value of input, however the value added of manufacturing industries getting higher and it affected to higher efficiency. Some industries still depend on imported raw materials, such as chemical industry, basic iron and steel industry. Competitiveness of the manufacturing industry is in the industries that based on natural resources, particularly agriculture. National industrial policies have not focussed yet to linkages between down and upstream industries.
4 References
Hasibuan, Nurimansjah. 1993 Ekonomi Industri. Persaingan , Monopoli dan Regulasi. LP3ES. Jakarta
Koch, James V. 1980, Industrial Organization and Prices. Second Edition, Prentice Hall, London
Martin, Stephen. (1994). Industrial Economics. Economic Analysis and Public Policy. Second Edition. Macmillan Publishing Company.
Shepherd, William G. 1990. The Economics of Industrial Organization. Third Edition, Prentice Hall, New York.
Statistics Indonesia. Large and Medium Industry Indicator 2004
Statistics Indonesia. Large and Medium Industry Indicator 2005
Statistics Indonesia. Large and Medium Industry Indicator 2006
Statistics Indonesia. Large and Medium Industry indicator 2007
Statistics Indonesia. Large and Medium Industry Indicator 2008
Statistics Indonesia. Large and Medium Industry Indicator 2009
Statistics Indonesia. Large and Medium Industry Indicator 2010
Statistics Indonesia. Large and Medium Industry Indicator 2011
Statistics Indonesia. Labour for Survey 2011.