SPATIO-TEMPORAL ESTIMATION OF INTEGRATED WATER VAPOUR OVER THE MALAYSIAN PENINSULA DURING MONSOON SEASON
Suhaila SALIHIN, Tajul A.MUSA, Zahira MOHD RADZI
Geomatic Innovation Research Group (GnG),
Geoinformation Department, Faculty of Geoinformation and Real Estate, Universiti Teknologi Malaysia, Johor Bahru, Malaysia.
KEY WORDS: Forest Cover, Deforestation, Distubance, CLASlite, Remote Sensing, Malaysia
ABSTRACT:
This paper provides the precise information on spatial-temporal distribution of water vapour that was retrieved from Zenith Path Delay (ZPD) which was estimated by Global Positioning System (GPS) processing over the Malaysian Peninsular. A time series analysis of these ZPD and Integrated Water Vapor (IWV) values was done to capture the characteristic on their seasonal variation during monsoon seasons. This study was found that the pattern and distribution of atmospheric water vapour over Malaysian Peninsular in whole four years periods were influenced by two inter-monsoon and two monsoon seasons which are First Inter-monsoon, Second Inter-Inter-monsoon, Southwest monsoon and Northeast monsoon.
1. INTRODUCTION hydrological cycle. The hydrological cycle describes the storage and the movement of water from the ocean and land to the atmosphere that leads to the formation of clouds by evaporation processes. From clouds, the evaporated water falls back to the Earth’s surface as precipitation such as rain and snow.
There are a few techniques that were deployed to measure water vapour have been discussed in many studies such as radiosonde, ground-based upward looking radiometry and satellite-based downward looking radiometry (Bevis et., 1992; Guerova, 2003; Agustan, 2004; Coster et al., 1996). Traditionally, observation of water vapour is made through radiosonde. However, it was only launched twice a day at limited location with high cost to operate. Radiosondes provide vertical profile of water vapour but have limited horizontal spatial density make it deficient for studying the variations of atmospheric water vapour at various temporal and spatial scale (Coster et al., 1996). Atmospheric water vapour recapture by satellite image provide global coverage but it is complicated over land compare to ocean are due to the variable surface temperature (Coster et al., 2014, Agustan, 2004). In the other hand, water vapour radiometer (WVRs) provides high temporal resolution but low spatial temporal resolution of water vapour. However, it was affected by rain and clouds (Guerova, 2003).
Since 1992, investigations on the use of Global Positioning System (GPS) in order to determine the amount of water vapour have been done (Bevis et al., 1992). The capability of this positioning technology, GPS provides 24 hours observation in all weathers conditions with high spatial and temporal resolution data make it as a promising technique in estimation of atmospheric water vapour content (Businger et al., 1996). Since atmospheric water vapour is highly variable in both time and space, GPS is sufficient for studying the variations of
atmospheric water vapour in various temporal and spatial scales with good accuracy and low cost system.
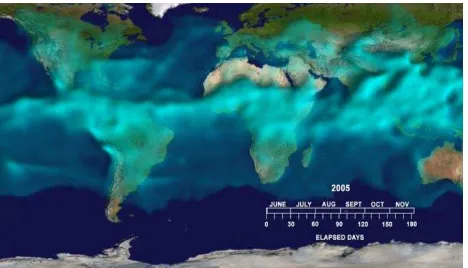
The distribution of atmospheric water vapour is highly concentrated at tropical latitude, particularly over South Asia during monsoon (see Figure 1). This is due to this region that gains more solar radiation which causes increasing of the temperature compared to the high latitude region (Amir, 2013). Malaysia is one of the countries that located in this tropical latitude region and has a large amount of water vapour in the atmosphere. This high amount of water vapour shows a close relationship with its monsoon seasons (Musa, 2007).
Figure 1. The visualization of global distribution of atmospheric water from NASA
(Source:http://www.nasa.gov/topics/earth/features/vapor_warmi ng.html)
Malaysian Peninsular experienced four seasons that can be described as two monsoon seasons and two inter-monsoon seasons (Suhaila et al., 2010). Southwest monsoon (SWM) season occurs from May to August while the Northeast monsoon (NEM) season occurs from November to February. The first inter-monsoon (FIM) occurs in March to April and Second inter-monsoon (SIM) occurs from September to October. Floods and flash flood related with massive rain events are major hydrological disaster in Malaysian region, particularly in east of Malaysian Peninsular during Northeast monsoon The International Archives of the Photogrammetry, Remote Sensing and Spatial Information Sciences, Volume XLII-4/W5, 2017
episodes. The hydrological events in Malaysia have been investigated among the researchers and meteorologist in recent years.
This present study aims to provide an analysis on the trend of atmospheric water vapour retrieved from GPS measurements and its relationship with monsoon seasons that were focused in Malaysian Peninsular region. The intensive spatiotemporal analysis on distribution of atmospheric water vapour during four monsoon seasons was conducted to observe the monsoons and water vapour distributions. Subsequently, the temporal analysis was carried out to understand seasonal and diurnal variations of atmospheric water vapour during monsoon events.
2. OBSERVATION AND METHODOLOGY
This section describes the observation and the methodology used to retrieve the GPS Integrated Water Vapour (IWV). 2.1 GPS
In 2003, Department of Survey and Mapping developed a real-time kinematic network from continuously operating reference stations (CORS) that is known as Malaysian Real-Time Kinematic GNSS Network (MyRTKnet) in order to support surveying and geodetic activities (Jamil et al., 2010). At present, MyRTKnet stations consists of 50 GPS CORS stations in Malaysian Peninsular and 28 stations in East Malaysia that were continuously operated.
In this study, 50 MyRTKnet stations over the whole Malaysian Peninsular were utilized. In addition, GPS observation data from International GNSS Service (IGS) CORS were included in this study to ensure the precision of the estimated Zenith Path Delay (ZPD). The GPS observation data from selected GPS stations were obtained at 30-seconds interval for 24-hours observation from year 2011 to 2014. Those GPS measurements have been precisely processed by using Bernese GPS software version 5.0 to retrieve ZPD in post-processed mode with application of processing parameter shown in Table 1. The ZPD for each station was estimated with temporal resolution of 1 hour within each 24 hours session.
For GPS IWV estimation, the Zenith Wet Delay (ZWD) which is the wet component of tropospheric delay should be obtained first by subtracting the Zenith Hydrostatic Delay (ZHD) from ZPD. ZHD is the dry component from tropospheric delay which is computed by utilizing the equation below (Elgered et al., regression was derived from the radiosonde data and the surface temperature data (Ts in Kelvin, K) by Bevis et al., (1992) and is commonly used in GPS-derived IWV calculations. It should also be noted that if the conversion constant is divided by the density of liquid water ( =1000 kg/m3), the result will be decreased by about 1/6. This is the typical ratio of the water-vapour path divided by the wet delay.
2.2 Surface Meteorological Parameters
A meteorological sensor needs to be installed adjacent to the GPS antenna for accurate ZHD estimation. However, in practice, many meteorological sensors are not located near to GPS station. The surface pressure and temperature data from the nearest weather station can be interpolated (Klien et al., 1999; Bai and Feng 2003). Because the vertical variability of pressure and temperature is sensitive to the altitude of the station, the pressure and temperature at all weather stations are converted to a common reference level that refers to the Mean Sea Level (MSL) (Bai and Feng 2003). The pressure and temperature at the MSL are interpolated to derive the pressure and temperature at the GPS stations. In this study, surface temperature and pressure from five selected meteorological stations operated by Malaysian Meteorological Department (MMD) were used to obtain the IWV.
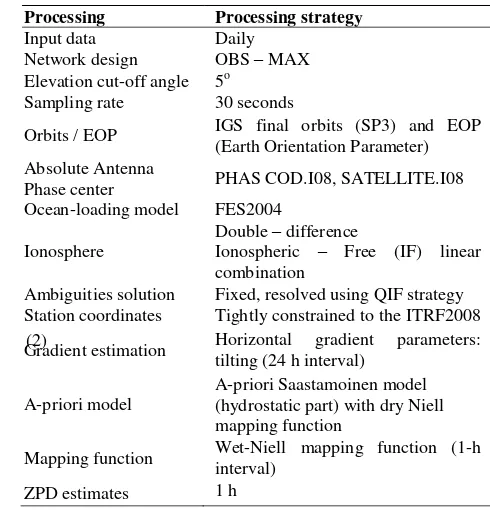
Table 1: Parameter-setting and model for data processing.
Processing Parameters
Processing strategy
Input data Daily
Network design OBS – MAX Elevation cut-off angle 5o
Sampling rate 30 seconds
Ambiguities solution Fixed, resolved using QIF strategy Station coordinates Tightly constrained to the ITRF2008
reference frame.
Gradient estimation Horizontal gradient parameters: tilting (24 h interval)
A-priori model
A-priori Saastamoinen model (hydrostatic part) with dry Niell mapping function
Mapping function Wet-Niell mapping function (1-h interval)
ZPD estimates 1 h
3. GPS ZPD AND IWV ESTIMATION FOR MALAYSIAN PENINSULAR.
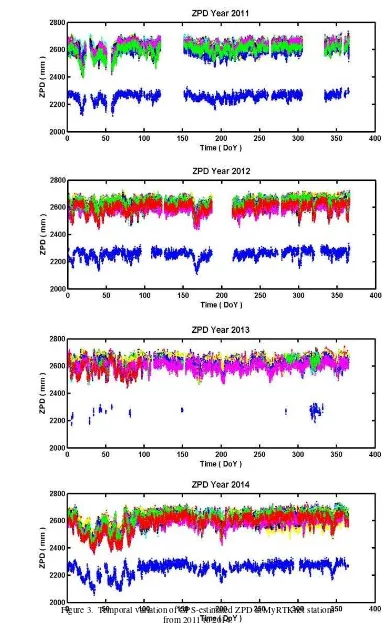
ZPD values at one hour interval have been estimated from GPS measurements of MyRTKnet and IGS stations for four years (2011 to 2014). Figure 3 presents the temporal variation of ZPD for 45 GPS stations over the Malaysian Peninsular. It is notable that all MyRTKnet stations produced high mean ZPD values (>2600 mm) with 2607.01 mm and this is proven by Musa et al, 2011. This is common for the regions that located in low-latitude due to the high amount of water vapour (Musa et al., 2011). The highest mean ZPD value was obtained for the BANT station with 2631.02 mm and the lowest mean ZPD value was obtained at CAME station with 2253.02 mm respectively.
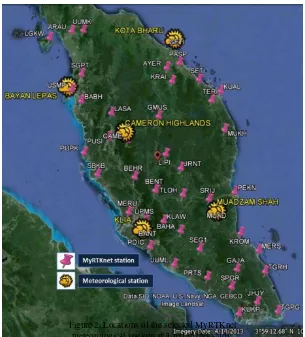
Figure 2. Locations of the selected MyRTKnet meteorological stations utilized in this study.
(a)
(b)
Figure 3. Temporal variation of GPS-estimated ZPD at MyRTKnet stations from 2011 to 2014.
3.1 GPS-retrieved IWV for MyRTKnet Stations
In 2003, Department of Survey and Mapping developed a real-time kinematic network from continuously operating reference stations (CORS) that is known as Malaysian Real-Time Kinematic GNSS
GPS-retrieved IWVs for MyRTKnet stations were calculated by using Equation (3) with performing the meteorological data. Figure 4 presented the temporal variation of the GPS IWV values. The four-year period temporal variations of IWV convey the information about the trend of water vapour over these years. As presented in Figure 4, the water vapour was decreased significantly in the beginning of the years. It is notable that all MyRTKnet stations produced high and short term variability of the IWV in average more than 50Kg/m2, respectively except for the CAME station which located at Cameron Highland with 1123.372m height. According to the findings, it shows that CAME station recorded the lowest average with 36.6 Kg/m2.
4. SPATIO- TEMPORAL VARIATION OF GPS-RETRIEVED IWV DURING MONSOON EVENTS Monsoon and inter-monsoon is the climatology event that occurs in Malaysian region through the year. This event brings the heavy rainfall spell especially during NEM seasons that leads to the flash flood in the East of Malaysian Peninsular. By considering the location of Malaysia that geographically located in low-latitude region and surrounded by South China Sea and Strait of Malacca, it is expected that the higher amount of water vapour and rainfall distribution occurred within this area especially during monsoon season. Hence, the capability of GPS Figure 4. Temporal variation of GPS-retrieved IWV at MyRTKnet stations
from 2011 to 2014.
itself has a possibility in contribution on improving the weather forecasting and climate monitoring due to extreme weather over this region.
This section study the seasonal variation of water vapour and its relationship during two monsoon seasons; (i.e., SWM and NEM) and two inter-monsoon seasons (i.e., FIM and SIM). The spatial and temporal variability of GPS-IWV was analyzed. To this end, the spatio-temporal variation of water vapour in this
Spatial pattern of mean seasonal values in Figure 5 depicts the spatial-temporal distribution of the average amounts of water vapour retrieved during FIM that occurs on March to April. Four cycles of FIM have been plotted to 2D IWV mapping presenting the distribution of water vapour. As presented in Figure 5, it shows that high amount of water vapour can be seen over the west coast of Malaysian Peninsular. According to Suhaila et. al., (2010), during inter-monsoon seasons, west coast region generally wetter during this season compared to east coast due to heavy rainfall that usually occurs in the form of convective rains. In addition, inland region is less influenced by inter-monsoon seasons (Mokhtar et. al., 2014). In Figure 5, high amount of water vapour can be seen at station USMP, BABH, PUPK, SBKB, MERU, BANT, PDIC and JUML that located near to the sea of the west coast of Malaysian Peninsular.
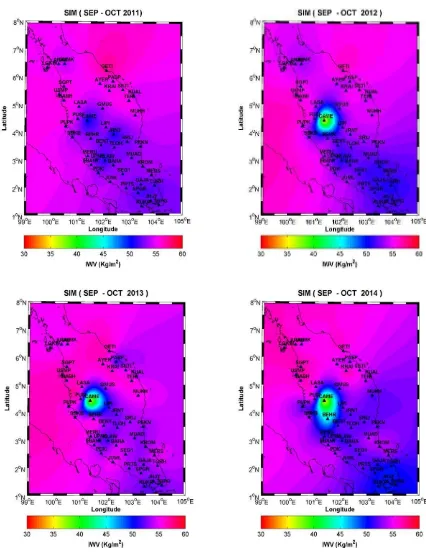
Second Inter-monsoon (SIM)
Meanwhile, the SIM that occurs in September to October shows the higher amount of water vapour over the Peninsular region compared to FIM. However, the Southern region of the Peninsular depicts the lower amount of water vapour during this season. Figure 6 presented the spatial-temporal distribution of the average amounts of water vapour retrieved during SIM. 4.2 Monsoon Season
Southwest Monsoon (SWM)
Spatial pattern of mean seasonal values in Figure 7 depicts the spatial-temporal distribution of the average amounts of water vapour retrieved during SWM that occurs on May to August. May is the beginning of the SWM that contribute most of annual rainfall distribution (Mokhtar et. al., 2014). The southwest monsoon has generally lower wind speed compared to the northeast monsoon that mostly comes from Sumatera region. As presented in Figure 7, southwest area of Peninsular depicts less amount of water vapour compared to the northern and eastern region. As shown in the figure, the Northwestern, North and Northeast of Peninsular experienced more water vapour during this season. Suhaila et al., 2010 stated that northwestern of Peninsular can be considered the wettest area during SWM which receive more rainfall distribution.
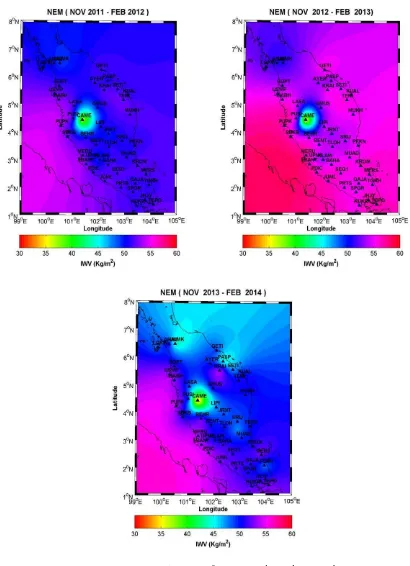
Northeast Monsoon (NEM)
Figure 8 depicts the spatial temporal distribution of the average amounts of water vapour retrieved during NEM season. NEM occurs started from the month of November to February. This season brings heavy rainfall all over the Peninsular Malaysia and causes floods event in the East coast of Peninsular. As shown in Figure 8, NEM brings less amount of water vapour to the northwest and east of Malaysian Peninsular. In contrast, the higher rainfall is recorded in the east region.
(a
)
(b
)
(c
)
(d
Figure 5. Spatio-temporal variation of GPS-retrieved IWV during Second Inter-Monsoon (SIM)
Figure 6. Spatio-temporal variation of GPS-retrieved IWV during Southwest Monsoon (SWM)
Figure 7. Spatio-temporal variation of GPS-retrieved IWV during Northeast Monsoon (NEM)
5. CONCLUDING REMARKS
Malaysia is located at low-latitude region that experience high amount of water vapour through the year. Since water vapour plays a crucial role in operational weather forecasting and climate monitoring, this study is capable to provide the opportunities to apply the measurement of water vapour by GPS especially during monsoon season and extreme weather. This study has been deal with the estimation and analysis of Integrated Water Vapour (IWV) in the atmosphere from GPS measurements of the MyRTKnet stations all over Peninsular Malaysia. conclude that the Malaysia contained the high amount of water vapour in its region with average 51.28 Kg/m2, respectively. Hence, the amount of water vapour in temporal variation was being studied. In addition, the spatio-temporal distribution of water vapour during monsoon and inter-monsoon seasons were analyzed in this study.
The results depicts that higher amount of water vapour were experienced during SIM season at Northeast and Northwest of the Malaysian Peninsular while the Southeast and Southwest areas show less amount of water vapour during this season. trend of the high amount of water vapour distribution is seen to be quite similar all over Peninsular. Therefore, from the analysis of the seasonal amount of water water vapour during monsoon seasons, it was possible to conclude that the trend and distribution of water vapour over this regions is followed the its seasonal monsoon.
ACKNOWLEDGEMENTS
The authors would like to acknowledge the Department of Survey and Mapping Malaysia (DSMM) and the Malaysia Meteorological Department (MMD) for their contribution to this project by providing the GPS and meteorological data.
REFERENCES
Agustan, 2004. Strategies for Estimating Atmospheric Water Vapor Using Ground Based GPS Receiver in Australia. M. Sc. Thesis, Curtin University of Technology, Australia.
Amir, S. A. L. 2013. Potential of Global Positioning System for Meteorology in Low-Latitude Region. Master Degree, Universiti Teknology Malaysia, Skudai.
Bai, Z. and Feng, Y. 2003. GPS Water Vapour Estimation Using Interpolated Surface Meteorological Data from Australian Automatic Weather Stations. Journal of Global Positioning System. Vol. 2:83-89.
Bevis, M., Businger, S., Herring, T., Rocken, C., Anthes, R and Ware, R. 1992. GPS Meteorology: Remote Sensing of
Atmospheric Water Vapour Using Global Positioning System. Journal of Geophysical Research. 97 (D14), 15787-15801. Businger, S., S.R. Chiswell, M.Bevis, J. Duan, R,. A. Anthes, C. Roken, R. H. Ware, M. Exner, T. VanHove, and F.S. Solheim. 1996. The promise of GPS atmospheric monitoring, Bull. Am. Meteorol. Soc., 77, 5-18.
Coster, A. J., A. E. Hiell, F. S. Solheim, V. B. Mendes, P.C. Toor, K. P. Buchmann, and C. A. Upham. 1996. Measurements of precipitable water vapor radiometer, Proc. 9th Int Tech. Meet. Satell. Div. Inst. Of Navig., 1, 625-631.
Elegered, G., Davis, J. L., Herring, T. A., Shapiro, I. I. 1991. Geodesy by radio interferometry: water vapor radiometry for estimation of the wet delay. Journal of Geophysical Research. 96, 6541–6555.
Guerova, G. 2003. Derivation of Integrated Water Vapour (IWV) from the ground-based GPS estimates of Zenith Total Delay (ZTD). Dept. of Microwave Physics, Institute of Applied Physics, University of Bern, Bern, Switzerland.
Klein Baltink, H., H. J. P., Derks., A. C. A. P., Van Lammeren., B. A. C., Ambrosius., A. G. A., Van der Hoeven., H., Van der Marel., F., Kleijer., A. J. M. and Kösters. 1999. GPS water vapor meteorology, Beleids Commissie Remote Sensing (BCRS), Chapter 2: Water vapor from GPS troposheric delay estimates.
Mokhtar,Z. A. Yahaya, A. S. Ahmad, F. Suri, S. Halim, M. H. 2014. Trends for daily rainfall in Northern and Southern Region of Peninsular Malaysia. Journal of Civil Engineering Research, 4(3A):222-227. DOI:10.5923/c.jce.201402.38
Musa, T. A. 2007. Residual Analysis of Atmospheric Delay in Low Latitude Region Using Network-Based GPS Positioning. PhD Thesis, School of Surveying and Spatial Information Malaysian Peninsular. Journal of Atmospheric and Solar-Terrestrial Physics, 73(2011)2410-2422.
Suhaila, J., M. D. Sayang, W. Z. W. Zawiah, A. A. Jemain. 2010,. Trends in Peninular Malaysia Rainfall Data During the Southwest Monsoon and Northeast Monsoon Seasons: 1975 – 2004. Sains Malaysiana, 39(4)(2010):533-542.