QUANTITAVE STRUCTURE-ACTIVITY RELATIONSHIP ANALYSIS (QSAR) OF
ANTIMALARIAL 1,10-PHENANTHROLINE DERIVATIVES COMPOUNDS
Ruslin Hadanu1,*, Sabirin Mastjeh2, Jumina2, Mustofa3, Eti Nurwening Sholikhah3, Mahardika Agus Wijayanti4, and Iqmal Tahir5
1
Department of Chemistry, FKIP, Pattimura University, Poka, Ambon- Indonesia,
2
Department of Chemistry, Faculty of Mathematics and Natural Sciences, Gadjah Mada University, Sekip Utara, Yogyakarta-Indonesia 55281
3
Department of Pharmacology and Toxicology, Faculty of Medicine, Gadjah Mada University, Sekip Utara, Yogyakarta-Indonesia 55281
4
Department of Parasitology, Faculty of Medicine, Gadjah Mada University, Sekip Utara, Yogyakarta-Indonesia 55281
5
Austrian-Indonesian Centre for Computational Chemistry, Faculty of Mathematics and Natural Sciences Gadjah Mada University, Sekip Utara, Yogyakarta, Indonesia 55281
Received 2 December 2006; Accepted 8 January 2007
ABSTRACT
Quantitative Electronic Structure-Activity Relationship (QSAR) analysis of a series of 1,10-phenanthroline derivatives as antiplasmodial compounds have been conducted using atomic net charges (q), dipole moment (μ) ELUMO, EHOMO, polarizability (α) and log P as the descriptors. The descriptors were obtained from computational
chemistry method using semi-empirical PM3. Antiplasmodial activities were taken as the activity of the drugs against chloroquine-resistant Plasmodium falciparum FCR3 strain and are presented as the value of ln (1/IC50)
where IC50 is an effective concentration inhibiting 50% of the parasite growth. The best model of QSAR model was
determine by multiple linear regression method and giving equation of QSAR:
ln 1/IC50 = 3.732 + (5.098) qC5 + (7.051) qC7 + (36.696) qC9 + (41.467) qC11 –(135.497) qC12 + (0.332) μ –
(0.170) α + (0.757) log P.
The equation was significant on the 95% level with statistical parameters: n=16; r=0.987; r2= 0.975; SE=0.317; Fcalc/Ftable = 15.337 and gave the PRESS=0.707. Its means that there were only a relatively few deviations between
the experimental and theoretical data of antimalarial activity.
Keywords: QSAR, antimalarial, semi-empirical method, 1,10-phenanthroline.
INTRODUCTION
Malaria remains one of the most devastating diseases, causing as many as 2.7 million deaths annually with an estimated 400 to 900 million new cases each year [1]. Malaria endemic areas include Africa, South East Asia, India and South America; however, the disease is spreading to new areas, such as Central Asia, and Eastern Europe. Local transmission of malaria in the United States, unheard of in the era between World War II and 1980, now accounts for an increasing number of cases [2]. Clinical cases in the US are now in average of 1,300 per year [3]. Worldwide, the majority of deaths occur in children; other high risk groups include pregnant women, refugees, migrant workers, and non immune travelers-over 20 million Western tourists at risk annually (fact sheets from Malaria Foundation International).
Although four species of the genus Plasmodium cause
human malaria, Plasmodium falciparum is the deadliest
and will be the subject of this review.
During the past two decades an increasing number of quantitative structure-activity/property relationship (QSAR/QSPR) models have been studied using theoretical molecular descriptors for predicting biomedical, activity, toxicological, and technological properties of chemicals. QSAR/QSPR are mathematical models that seek to predict complicated physicochemical/biological properties of chemicals from their simpler experimental or calculated properties. The main problem with the use of experimental data as independent variables in QSAR is that they are not available for the majority of chemical structures, real or hypothetical.
The traditional remedies are no longer effective
and the incidence of malarial by P. falciparum, the most
dangerous species of parasite, continues to grow, while some traditional drugs such as chloroquine and its congeners are losing their activity due to the increasing multi drug resistance [4]. Therefore, it is essential to find new drugs of antimalarial having a pharmacological activity higher than that of currently
Ruslin Hadanu, et al.
available drugs of antimalarial. In this connection, quantitative structure-activity relationship (QSAR) analysis plays an important role to minimize trial and error in designing new antimalarial drugs.
QSAR studies of antimalarial activity represent an emerging and exceptionally important topic in the area of computed-aided drug design. Although the demand for ‘in silico’ discovery is clear in all areas of human therapeutics, the field of anti-infective drugs has a particular need for computational solutions enabling rapid identification of novel therapeutic leads.
In this research semi empirical methods were used to calculate a number of properties/descriptors. In current practice, semiempirical methods serve as efficient computational tools which can yield fast quantitative estimates for a number of properties. This may be particularly useful for correlating large sets of experimental and theoretical data, for establishing trends in classes of related molecules, and for scanning a computational problem before proceeding with
higher-level treatments. Compared with ab initio or density
functional methods, semi empirical calculations are much faster, typically by several orders of magnitude [5], but they are also less accurate, with errors that are less systematic and thus harder to correct.
Among the classes of drugs that are effective in the
treatment of the P. falciparum malarial, there is the
phenanthroline and its derivatives. The
1,10-phenanthroline derivatives was synthesized from 8-aminoquinoline and 1,10-phenanthroline as a starting material. The five models of diaza-analogs of the phenanthrene skeleton were synthesized, described and evaluated for their antiplasmodial activity. From that evaluation, the 1,10-phenanthroline ring system appeared as a new class of potential antimalarial compounds [6]. Previous QSAR analysis have been reported using electronic descriptor producing by AM1 calculation [7,8] using 13
EXPERIMENTAL SECTION
Geometry Optimization and Calculation of Molecular Descriptors
QSAR models are evaluated using sets of 1,10-phenanthroline derivatives compounds whose molecular structure and antiplasmodial activity are known (Table 1). Antiplasmodial activity of these compound were taken as the activity against
chloroquine-resistant P. falciparum (FCR3) strain and
is presented as the value of ln (1/IC50) where IC50is an
effective concentration inhibiting 50% growth of the parasite [8-10]. As the activities were measured under two different conditions, the activities for 1-13 [8] were rescaled with respect to activities for 14-16 [9,10] by
using ln (1/IC50) obtained from two experiments.
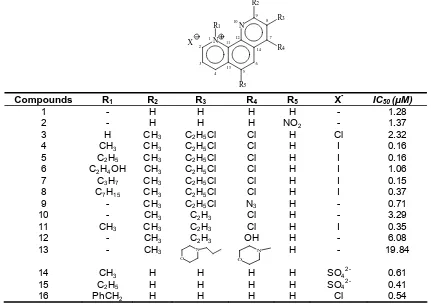
Table 1. Chemical structure and activity data of antimalarial 1,10-phenanthroline derivatives againts FCR3 strain
N
All the compounds (Table 1) were calculated using
package HyperChem® Program Version 7.0 and
complete geometry optimization with the semi-empirical Parameterized Model 3 (PM3) method was performed. Quantum-chemical descriptors were calculated, as for
example: atomic net charges, dipole moment, EHOMO,
ELUMO, polarizability and log P.
From all the descriptors above mentioned, it can be considered that some of them give valuable information about the influence of electronic and coefficient partition features upon the biological activity of drug molecules. In this work, the molecular descriptors were selected so that they represent the features necessary to quantify the activity.
QSAR Evaluation
The steps of quantitative structure-activity relationship analyses were conducted at this research: to determinate a series 1,10-phenanthroline derivatives
compound to be analyzed along with value of IC50
yielded through laboratory experiment; to look for elementary ring structure of 1,10-phenanthroline derivatives compound, which is the most stable using optimization process; to calculate descriptor through optimized structure; statistical analysis process to get equation of QSAR; selected of the best equation model of QSAR; to design the new compound of 1,10-fenantrolin derivatives according to the best model of QSAR and consider of eligibility of synthesis; and making of 1,10-phenanthroline derivatives resulted from molecular design which has the highest predicted value
of IC50 to be synthesized in laboratory.
The net charge atoms for three dimension of molecule structure which have experienced of converged at process of optimization can be recorded through menu file; start log; compute; single point and then stop log. The net charge of atoms on its structural compound can be seem through display menu, labels and charge.
RESULT AND DISCUSSION
Descriptor is a parameter or property of molecule used as independent variables in calculation of predicted
activity (theoretical IC50). The descriptors used in this
research are atomic net charges, dipole moment, log P, EHOMO-LUMO and polarizability. To obtain the structural properties of each test compound and modeling compound after process of geometry optimization, the calculation proses is continued with single point at sub menu. Descriptors or structural properties produced from calculation with single point were atomic net charges and dipole moment, whereas descriptors of log P and polarizability were obtained from “menu compute” of
QSAR properties. EHOMO, ELUMO descriptors can be
obtained from the menu compute, vibrations then click
orbital sub menu. The EHOMO-LUMO descriptors would not
be obtained if calculation was performed using molecular mechanic method. All of the descriptors was given in Table 2.
To calculate of structural electronic and other descriptors of a series 1,10-phenanthroline derivatives was conducted with the semi empiric PM3 method. PM3 method which is better method than the others semi empiric method. Method of PM3 is repair method of before all like MNDO method [11], which can predicts compounds having valence many with the best accuracies [12]. The PM3 method can be used for the analysis of a series 1,10-phenanthroline derivatives, because 1,10-phenanthroline derivatives is organic compound considering atoms as C, H, Cl, Br, O, and N.
Selection of the Best Model
According to result of calculation statistic of multilinear regression by using SPSS version 13.0 for windows were obtained 6 QSAR models as listed in Table 4. From 6 QSAR models were determined 1 of the best QSAR model. Model 5 is the best model. Model 5 is selected as the best model among 6 QSAR models, based on:
1. The value of r and r2 to look for analysis data
linearity that the model 5 having r equal to 1 is
0.987 and r2 is 0.975.
2. The smallest value of SE (Standard Error of Estimation) is model 5 having value equal to 0.317.
3. If the value of F exceed value of Ftable or
comparison of Fcalc/Ftable more than 1. All models
have value of Fcalc/Ftable more than 1, but model 5
selected as the best model because its have the biggest value (15.377) from 6 QSAR models. 4. The 5 model QSAR have smaller value of PRESS
(Predictive Residual Sum of Square) than another QSAR models.
The value of r = 0.987 and r2 = 0.975 to indicate
that correlation between electronic structure (independent variables) with antimalarial activity very firm. Its mean that change of activity of antimalarial ln
(1/IC50) a series 1,10-phenanthroline derivatives
compound resulted 98.7% from the existence of change of descriptor: electronic structure, dipole
moment, ELUMO, EHOMO, log P and polarizability, that all
are independent variables. Comparing parameters F and SE of the six models, it is easily revealed that model 5 is the best model because it has highest F and lowest SE value. According to F value indicated that model 5 is significance at trust level 95% as shown by
ratio of Fcalc/Ftable which the value more than 1. The
value of Fcalc larger than Ftable to indicate that H1
accepted and its showing correlates electronic structure (dependent variables) a series 1,10-phenanthroline derivatives between activity of anti-
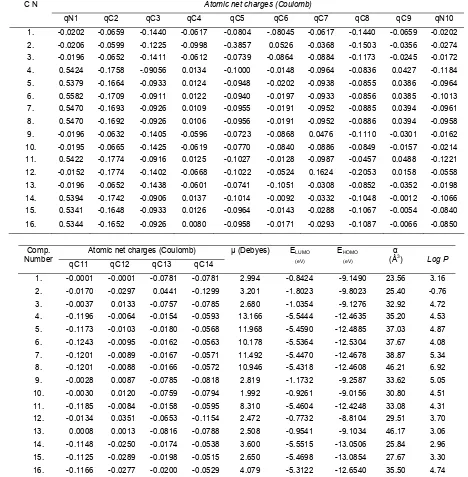
Table 2. Descriptors/independent variables used for QSAR analysis of antimalarial 1,10-phenanthroline derivatives calculated by semi-empirical PM3 method
Atomic net charges (Coulomb) C N
qN1 qC2 qC3 qC4 qC5 qC6 qC7 qC8 qC9 qN10
1. -0.0202 -0.0659 -0.1440 -0.0617 -0.0804 -.08045 -0.0617 -0.1440 -0.0659 -0.0202
2. -0.0206 -0.0599 -0.1225 -0.0998 -0.3857 0.0526 -0.0368 -0.1503 -0.0356 -0.0274
3. -0.0196 -0.0652 -0.1411 -0.0612 -0.0739 -0.0864 -0.0884 -0.1173 -0.0245 -0.0172
4. 0.5424 -0.1758 -.09056 0.0134 -0.1000 -0.0148 -0.0964 -0.0836 0.0427 -0.1184
5. 0.5379 -0.1664 -0.0933 0.0124 -0.0948 -0.0202 -0.0938 -0.0855 0.0386 -0.0964
6. 0.5582 -0.1709 -0.0911 0.0122 -0.0940 -0.0197 -0.0933 -0.0856 0.0385 -0.1013
7. 0.5470 -0.1693 -0.0926 0.0109 -0.0955 -0.0191 -0.0952 -0.0885 0.0394 -0.0961
8. 0.5470 -0.1692 -0.0926 0.0106 -0.0956 -0.0191 -0.0952 -0.0886 0.0394 -0.0958
9. -0.0196 -0.0632 -0.1405 -0.0596 -0.0723 -0.0868 0.0476 -0.1110 -0.0301 -0.0162
10. -0.0195 -0.0665 -0.1425 -0.0619 -0.0770 -0.0840 -0.0886 -0.0849 -0.0157 -0.0214
11. 0.5422 -0.1774 -0.0916 0.0125 -0.1027 -0.0128 -0.0987 -0.0457 0.0488 -0.1221
12. -0.0152 -0.1774 -0.1402 -0.0668 -0.1022 -0.0524 0.1624 -0.2053 0.0158 -0.0558
13. -0.0196 -0.0652 -0.1438 -0.0601 -0.0741 -0.1051 -0.0308 -0.0852 -0.0352 -0.0198
14. 0.5394 -0.1742 -0.0906 0.0137 -0.1014 -0.0092 -0.0332 -0.1048 -0.0012 -0.1066
15. 0.5341 -0.1648 -0.0933 0.0126 -0.0964 -0.0143 -0.0288 -0.1067 -0.0054 -0.0840
16. 0.5344 -0.1652 -0.0926 0.0080 -0.0958 -0.0171 -0.0293 -0.1087 -0.0066 -0.0850
Atomic net charges (Coulomb) Comp.
Number
qC11 qC12 qC13 qC14
μ (Debyes) ELUMO (eV)
EHOMO
(eV)
α
(Å3) Log P 1. -0.0001 -0.0001 -0.0781 -0.0781 2.994 -0.8424 -9.1490 23.56 3.16
2. -0.0170 -0.0297 0.0441 -0.1299 3.201 -1.8023 -9.8023 25.40 -0.76
3. -0.0037 0.0133 -0.0757 -0.0785 2.680 -1.0354 -9.1276 32.92 4.72
4. -0.1196 -0.0064 -0.0154 -0.0593 13.166 -5.5444 -12.4635 35.20 4.53
5. -0.1173 -0.0103 -0.0180 -0.0568 11.968 -5.4590 -12.4885 37.03 4.87
6. -0.1243 -0.0095 -0.0162 -0.0563 10.178 -5.5364 -12.5304 37.67 4.08
7. -0.1201 -0.0089 -0.0167 -0.0571 11.492 -5.4470 -12.4678 38.87 5.34
8. -0.1201 -0.0088 -0.0166 -0.0572 10.946 -5.4318 -12.4608 46.21 6.92
9. -0.0028 0.0087 -0.0785 -0.0818 2.819 -1.1732 -9.2587 33.62 5.05
10. -0.0030 0.0120 -0.0759 -0.0794 1.992 -0.9261 -9.0156 30.80 4.51
11. -0.1185 -0.0084 -0.0158 -0.0595 8.310 -5.4604 -12.4248 33.08 4.31
12. -0.0134 0.0351 -0.0653 -0.1154 2.472 -0.7732 -8.8104 29.51 3.70
13. 0.0008 0.0013 -0.0816 -0.0788 2.508 -0.9541 -9.1034 46.17 3.06
14. -0.1148 -0.0250 -0.0174 -0.0538 3.600 -5.5515 -13.0506 25.84 2.96
15. -0.1125 -0.0289 -0.0198 -0.0515 2.650 -5.4698 -13.0854 27.67 3.30
16. -0.1166 -0.0277 -0.0200 -0.0529 4.079 -5.3122 -12.6540 35.50 4.74
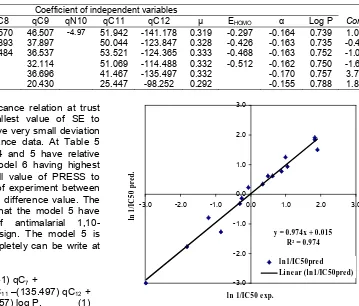
Table 3. Six selected models and their statistical parameters for the correlation between molecular properties and antimalarial activity of antimalarial 1,10-phenanthroline derivatives
Model Variables R Fcalc/Ftable SE PRESS
1. qC2, qC5, qC7, qC8, qC9, qN10, qC11, qC12, μ, EHOMO, α, log P 0.988 4.701 0.468 0.658
2. qC2, qC5, qC7, qC8, qC9, qC11, qC12, μ, EHOMO, α, log P. 0.988 6.831 0.405 0.661
3. qC5, qC7, qC8, qC9, qC11, qC12, μ, EHOMO, α, log P 0.988 9.350 0.363 0.664
4. qC5,qC7, qC9, qC11, qC12, μ, EHOMO, α, log P 0.988 12.431 0.332 0.665
5. qC5, qC7, qC9, qC11, qC12, μ, α, log P 0.987 15.337 0.317 0.707
6. qC7, qC9, qC11, qC12, μ, α, log P 0.984 15.317 0.338 1.319
Table 4. Coefficient of selected independent variables for 6 QSAR models as obtained from multilinear regression analysis
Coefficient of independent variables Model
malarial (ln 1/IC50) having significance relation at trust
level 95%. Meanwhile, the smallest value of SE to indicate that the QSAR model have very small deviation of data or have highest significance data. At Table 5 indicating that models 1, 2, 3, 4 and 5 have relative same value of PRESS, while model 6 having highest PRESS value (1.319). The small value of PRESS to indicate that antimalarial activity of experiment between activity of predict have very small difference value. The mentioned can be make guide that the model 5 have more good ability activity of antimalarial 1,10-phenanthroline derivatives to design. The model 5 is presented at Table 5 and 6, completely can be write at following.
The QSAR model obtained is ideal if its has r2
value equal to 1 and its indicating that correlation independent variable between dependent variables is
very perfect and significance [10] if its has r2 value equal
to 0 indicating structural electronic and properties of molecular (dependent variables) between antimalarial
activity ln (1/IC50) have no correlation or no significance.
The statistical parameters commonly using r2 value
because its have more correctness level than r value.
The r2 value have larger interval than r value so that
small difference which no perceived at r value but its can
perceived clearly at r2 value. The r and r2 value as
statistical parameter only showing linearity measures of relevant model, but cannot depict measure of predicts of equation model, so that require to be paid attention by other statistical parameters.
The other statistical parameters, beside r and r2
which need to be paid attention in this research is SE and F value. The smallest values of SE to express the model obtained is progressively and more significance. At Table 5 showing the model 5 was selected the most significance at trust level 95%. Ones statistical
y = 0.974x + 0.015
Line ar (ln1/IC 50pre d)
Fig 1. Linear regression of experimentally observed
antimalarial activity ln (1/IC50) versus calculated one
based on QSAR model 5
parameters to look for ability of QSAR model is to be analyze of PRESS parameter. The smallest value of PRESS to indicate the QSAR model have good ability to predict antimalarial activity. The PRESS value of six QSAR models was listed in Table 3. The model 5 is the most reliable model because its has the smallest value. The result of evaluation antimalarial activity
[predicted ln (1/IC50)] and correlation with antimalarial
activity [experiment ln (1/IC50)] for the model 5 by using
semi empiric PM3 method have linearity (r2 = 0.9748)
and slope value (0.974) can be seen at Table 7 and Fig. 1.According to the value of variable dipole moment, polarizability, and log P were obtained by the variation of atoms included in multilinear analysis
(Table 4), atoms C5, C7, C9, C11 and C12 seems the
most responsible for the pharmacological activity.
CONCLUSION
We have used a semi-empirical molecular calculation PM3 to study the correlation of antimalarial activity of a series of 1,10-phenanthroline derivatives drugs against chloroquine-resistant FCR3 strain. The
best overall correlation is given by the computed molecular properties of atomic net charges of heterocyclic ring, dipole moment, LUMO-HOMO energies, polarizability and log P.
Significant regression model was obtained by multiple linear regression method for structural properties of 1,10-phenanthroline derivatives versus antimalarial activity against Plasmodium falciparum. We
were reported the descriptors dipole moment (μ),
polarizability (α), atomic net charges: qC5, qC7, qC9, qC11
and qC12 seems to be the most responsible for the
pharmacological activity. The model 5 is significant on the 95% level with statistical parameters (eq 1).
REFFERENCES
1. Breman, J. G. Ame Journal of Tropic and Med and
Hyg, 2001, 64, 1.
2. Mundy, S. B., White, A. C. Jr., Hines, J. S., Marino,
B. J. and Young, E. J. Southern Med J, 1996, 89,
616.
3. Filler, S., Causer, L. M., Newman, R. D., Barber, A. M., Roberts, J. M., MacArthur, J., Parise, M. E. and
Steketee, R. W. MMWR Surveillance Summaries,
2003, 52, 1.
4. Wernsdorfer, W.H., Parasitology Today, 1991, 7,
297 231.
5. Thiel, W., Adv. Chem. Pyhs., 1996, 93, 703-757
6. Yappi, A.D., Mustofa, Valentin, A., Chavignon, O., Teulade, J.C., Mallie, M., Chapat, J.P., and
Blache., Y. Chem. Pharm. Bull. 2000, 48 (12)
1886-1889.
7. Mustofa, Tahir, I., dan Jumina, 2002, Indo. J
Chem., 2, 2, 91-96.
8. Mustofa, Yapii, A.D., Valentin, A., dan Tahir, I.,
2003, Berkala Ilmu Kedokteran, 35 (2), 67-74
9. Sholikhah, E.N., Mustofa, Wijayanti, M.A., Hadanu, R, Tahir, I., Jumina and Supargiyono, 2004, Antiplasmodial Activity and Cytotoxicity of New 1,10-Phenantroline Derivatives, Presented at Third International Eijkman Symposium, Yogyakarta,
Indonesia, and September 30– October 3, 2004.
10. Wijayanti, M.A., Sholikhah, E.N., Tahir, I., Hadanu,
R., Jumina, Supargiyono, and Mustofa, 2006, J.
Health Science, 52 (6) 794-799.
11. Leach, A.R., 1996, Molecular Modelling, Principles
and Applications, Longman, Singapore.
12. Dewar, M.J.S., Zoebisch, E.G., Healy, E.F. and
Stewart, J.J.P., 1985, J. Am. Chem. Soc, 107,
3902-3909.