NOVEL DESIGN OF CALANONE DERIVATIVES AS ANTI-LEUKEMIA COMPOUNDS BASED
ON QUANTITATIVE STRUCTURE-ACTIVITY RELATIONSHIP ANALYSIS
Ponco Iswanto
1,*, Mochammad Chasani
1, Harjono
1, Iqmal Tahir
3,
Muhammad Hanafi
2, and Eva Vaulina YD
11
Chemistry Department, Faculty of Science and Engineering, Universitas Jenderal Soedirman, Karangwangkal, Purwokerto 53122, Indonesia
2
Chemistry Research Centre, Indonesian Institute of Sciences (LIPI), PUSPIPTEK Serpong, Banten 15314, Indonesia 3
Austrian-Indonesian Centre for Computational Chemistry (AIC), Chemistry Department, Universitas Gadjah Mada, Sekip Utara, Yogyakarta 55281, Indonesia
Received March 19, 2010; Accepted July 29, 2010
ABSTRACT
Leukemia drug discovery based on calanone compound was conducted in previous research and produced 6 calanone derivatives. Most of them have lower activities against leukemia cell L1210 than pure calanone. A Quantitative Structure-Activity Relationship (QSAR) analysis is conducted in this work to find more active calanone derivatives. Six compounds were used as the material of the research because they already have anti-leukemia activity data expressed in Inhibitory Concentration of Fifty Percent Cell Lethal (IC50, in g/mL). Calculation of
predictors was performed by AM1 semiempirical method. QSAR equation is determined using Principle Component Regression (PCR) analysis, with Log IC50as dependent variable. Independent variables (predictors) are atomic net
charges, dipole moment (), and coefficient partition of n-octanol/water (Log P). This work recommends 3 novel designs of calanone derivatives that may have higher activities (ing/mL) than those already available, i.e. gemdiol calanone (57.78), 2,4-dinitrophenylhydrazone calanone (30.94) and 2,4,6-trinitrophenylhydrazone calanone (18.96).
Keywords:calanone, QSAR analysis, AM1 semiempirical calculation, leukemia drug
INTRODUCTION
Calanone is a natural product that is isolated from
Calophyllum sp. It has anti-leukemia activity of 59.4 g/mL against leukemia cell L1210. The development of this compound has been conducted. The previous study produced 6 calanone derivatives but only one derivative has higher activity than pure calanone [1]. This problem has to be solved in order to guide novel calanone derivative discovery and to decrease “trial and error” synthesis.
One of computational chemistry applications is Quantitative Structure-Activity Relationship (QSAR) analysis for drug design. QSAR analysis is a combination of computational chemistry and statistical calculation [2]. QSAR analysis was used in some works for designing new compounds such as novel fluoroquinolone derivative as antibacterial compound [3] and antiradical drug based on flavone/flavonol compound [4].
Because of statistical requirement, QSAR analysis commonly needs large number of compounds and predictors especially in Multiple Linear Regression (MLR) calculation. Another regression analysis for small number of compounds with large predictors, called
Principle Component Regression (PCR) [5]. Before PCR calculation, Principle Component Analysis (PCA) calculation is conducted to produce principle components. Afterward, regression analysis for obtaining QSAR equation is conducted against the latent variables. QSAR analysis with PCR calculation has been applied on QSAR study of benzalacetone compounds as anti-mutagen drugs [5].
In this paper, QSAR analysis against six experimental data of calanone compounds as anti-leukemia drugs is performed. PCR statistical calculation is applied in this work. This research is conducted in several steps such as: modeling calanone and its derivatives in three dimensional structures then calculating the theoretical predictors. After that, constructing QSAR equation and designing new calanone compound.
EXPERIMENTAL SECTION
Materials
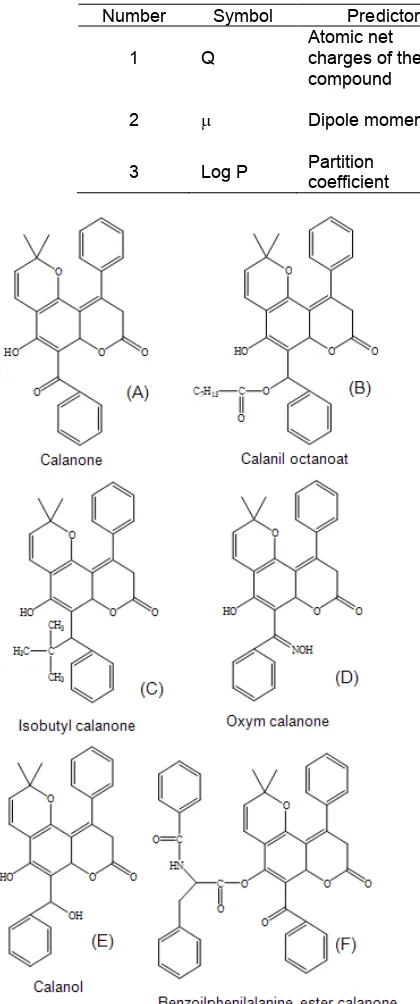
Table 1.Predictors and how to obtain them
Number Symbol Predictor Unit How to obtain
1 Q
Atomic net charges of the compound
coulomb
Optimizing the structure of the compound by AM1 semiempirical calculation
2 Dipole moment debye
Optimizing the structure of the compound by AM1 semiempirical calculation
3 Log P Partition
coefficient - QSAR Properties calculation
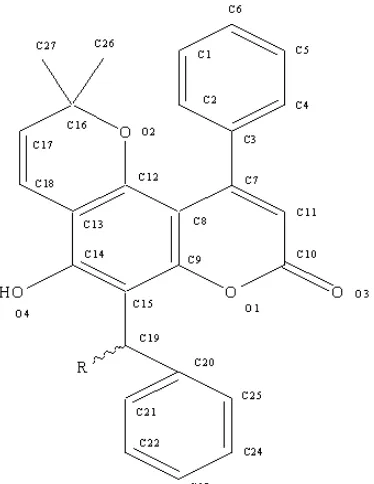
Fig 1. Molecular structure and anti-leukemia activity of calanone compounds (µg/mL); A = 59.4; B = 75.2; C = 105.5; D = 83.6; E = 70.0 and F = 52.5 [1]
used in computational chemistry calculation to produce predictors. Six anti-leukemia activities of calanone and its derivatives against leukemia cell L1210 are applied to statistical calculation as dependent variable (see Fig. 1). Anti-leukemia activities data are obtained from previous experimental study [1].
Instrumentation
Computational chemistry calculation is conducted at Austrian-Indonesian Centre for Computational Chemistry (AIC), Universitas Gadjah Mada, Indonesia and Physical Chemistry Laboratory, Universitas Jenderal Soedirman, Indonesia. Calculations are performed on 1 personal computer (PC), Intel Pentium IV 2.66 GHz processor, 1 GB RAM, and 40 GB
Harddisk Drive. Softwares are Hyperchem ver 7.0 (calculating electronic and lipophylic predictor) and SPSS ver 13.0 (statistical analysis).
Procedure
Molecular Modeling of Calanone Derivatives
Each compound is drawn into a three dimensional (3D) model of compound. Then calculations of parameters are set up for each model.
Generating Molecular Predictors
Predictors can be generated from experimental data or theoretical data. The predictors in this research are theoretical predictors that are generated by computational chemistry calculation. They consist of the physicochemical properties of calanone and its derivatives that are used as independent variables in statistical analysis. They are assumed as an important factor on reaction mechanism and physical properties of drug such as atomic charges, dipole moment, and partition coefficient. Table 1 is the details of theoretical molecular predictors. Dependent variable in this study is biological activity of the compounds.
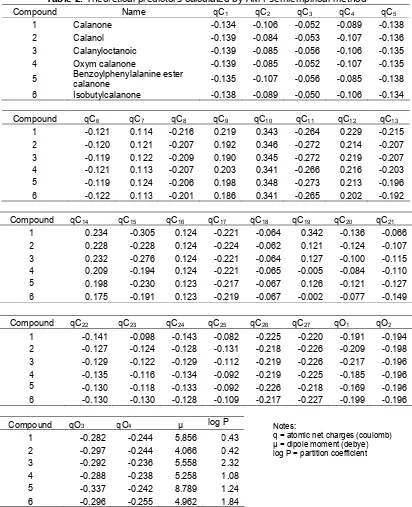
In the case of atomic charge calculation, only atoms in the main structure of Calanone are used as predictors (see Fig. 2). Additional parameters of computational calculation are RHF spin pairing, lowest state and 0.001 kcal.mole-1of RMS gradient.
Constructing QSAR Equation and Designing the New Compound
Fig 2. Numbering of atom in the main structure of calanone [9]
predictors as independent variables. By looking to the quality of statistical parameters, the selected QSAR equation is chosen. The general form of QSAR equation is described below:
A = C + b1.x1+ b2.x2+ b3.x3+ …… Where: A = compound’s activities
C = a constant xn= n
th
variable = nth predictor bn= a coefficient of n
th
predictor
After obtaining QSAR equation, the design of new calanone derivative was then carried out on the basis of some following considerations such as: the most influenced predictor to the activity and the ease of synthesis procedure for the new compound. So, with this consideration, the more active new calanone compound can be produced.
RESULT AND DISCUSSION
Molecular Modeling
Molecular modeling is important for describing the chemical system. The detailed checking of 3D structure of the model is also important. If the structure is not correctly represented, the calculation of predictors would also give wrong results. Modeling chemical system is one of important things besides choosing calculation method in computational chemistry study [2]. The result
from modeling step is a 3D coordinate of the compound. This coordinate is then applied in predictor calculation.
Generating Molecular Predictors
Predictors are generated by optimization of calanone structure based on AM1 semiempirical calculation. The advantages of using AM1 semiempirical method are that the calculation is not time consuming, electronic structure data can be easily obtained and the method is suitable for bulky structure of organic compound such as calanone [2]. AM1 semiempirical calculation method is already applied in QSAR analysis of antibacterial fluoroquinolone compounds and gives a good compromising of quality QSAR equation and the need of computer specification [3]. The selected predictors are the physicochemical properties which influence the anti-leukemia activity of calanone compounds. Table 2 shows the predictors data obtained from calculation.
Table 2 shows the theoretical characteristics of calanone compounds. Atomic net charges and dipole moment describes the electronic properties, where as partition coefficient reflects the solubility property of compounds. In the atomic net charges value, the most significant difference is observed in the 19th C element (C19). These significant differences in atomic net charge are due to the difference in functional group of each calanone compound. For instance, atomic net charges of C19in oxym calanone and isobutyl calanone are -0.005 and -0.002 Coulomb, respectively. This fact is caused by the existence of functional group on their C19that pushed the electron density to the C19, such as alkyl functional group [6]. In contrast, other compounds have positive value of C19atomic net charges, because they have functional groups that pull electron density from C19. All of the obtained predictors are applied for constructing the QSAR equation.
Dipole moment values are also different among the compounds. The highest value is observed in benzoylphenylalanine ester calanone which has a lot of electronegative atom in C19 functional group. Dipole moment value is influenced by the difference in electronegativity among the atoms and the geometry of certain functional group in the structure [6].
Table 2.Theoretical predictors calculated by AM1 semiempirical method
Compound Name qC1 qC2 qC3 qC4 qC5
1 Calanone -0.134 -0.106 -0.052 -0.089 -0.138 2 Calanol -0.139 -0.084 -0.053 -0.107 -0.136 3 Calanyloctanoic -0.139 -0.085 -0.056 -0.106 -0.135 4 Oxym calanone -0.139 -0.085 -0.052 -0.107 -0.135
5 Benzoylphenylalanine ester
calanone -0.135 -0.107 -0.056 -0.085 -0.138 6 Isobutylcalanone -0.138 -0.089 -0.050 -0.106 -0.134
Compound qC6 qC7 qC8 qC9 qC10 qC11 qC12 qC13 1 -0.121 0.114 -0.216 0.219 0.343 -0.264 0.229 -0.215 2 -0.120 0.121 -0.207 0.192 0.346 -0.272 0.214 -0.207 3 -0.119 0.122 -0.209 0.190 0.345 -0.272 0.219 -0.207 4 -0.121 0.113 -0.207 0.203 0.341 -0.266 0.216 -0.203 5 -0.119 0.124 -0.206 0.198 0.348 -0.273 0.213 -0.196 6 -0.122 0.113 -0.201 0.186 0.341 -0.265 0.202 -0.192
Compound qC14 qC15 qC16 qC17 qC18 qC19 qC20 qC21 1 0.234 -0.305 0.124 -0.221 -0.064 0.342 -0.136 -0.066 2 0.228 -0.228 0.124 -0.224 -0.062 0.121 -0.124 -0.107 3 0.232 -0.276 0.124 -0.221 -0.064 0.127 -0.100 -0.115 4 0.209 -0.194 0.124 -0.221 -0.065 -0.005 -0.084 -0.110 5 0.198 -0.230 0.123 -0.217 -0.067 0.126 -0.121 -0.127 6 0.175 -0.191 0.123 -0.219 -0.067 -0.002 -0.077 -0.149
Compound qC22 qC23 qC24 qC25 qC26 qC27 qO1 qO2 1 -0.141 -0.098 -0.143 -0.082 -0.225 -0.220 -0.191 -0.194 2 -0.127 -0.124 -0.128 -0.131 -0.218 -0.226 -0.209 -0.198 3 -0.129 -0.122 -0.129 -0.112 -0.219 -0.226 -0.217 -0.196 4 -0.135 -0.116 -0.134 -0.092 -0.219 -0.225 -0.185 -0.196 5 -0.130 -0.118 -0.133 -0.092 -0.226 -0.218 -0.169 -0.196 6 -0.130 -0.130 -0.128 -0.109 -0.217 -0.227 -0.199 -0.196
Compound qO3 qO4 μ log P 1 -0.282 -0.244 5.856 0.43 2 -0.297 -0.244 4.066 0.42 3 -0.292 -0.236 5.558 2.32 4 -0.288 -0.238 5.258 1.08 5 -0.337 -0.242 8.789 1.24 6 -0.296 -0.255 4.962 1.84
Construction of QSAR Equation and Design of the New Compound
PCA and PCR
The predictors that are used for constructing QSAR equation are quite a lot. In contrast, the experimental data e.g. activity of the compound are too few. To solve this problem PCR calculation method is applied. Before PCR calculation was done, PCA calculation was
conducted on predictor data in order to reduce the amount of data and produce principle components. The PCA result shows that first 4 principle components (t) can be applied in regression analysis. The PCA result and the calculation of 1st until 4th latent variables for each calanone compound are given in Table 3 and 4.
The first 4 latent variables are applied because they can describe over 95% the variation in the predictors [7]. All of data in Table 4 are used in PCR
Notes:
Table 3.Results of PCA calculation Initial Eigenvalues Component
Total % of Variance Cumulative %
1 16.7 50.5 50.5
2 8.9 26.9 77.4
3 4.0 12.2 89.6
4 2.1 6.3 95.9
5 1.3 4.1 100.0
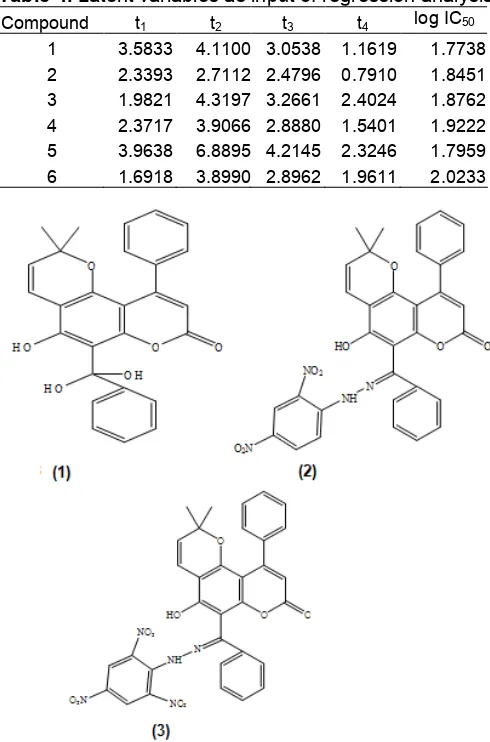
Table 4.Latent variables as input of regression analysis Compound t1 t2 t3 t4 log IC50
1 3.5833 4.1100 3.0538 1.1619 1.7738 2 2.3393 2.7112 2.4796 0.7910 1.8451 3 1.9821 4.3197 3.2661 2.4024 1.8762 4 2.3717 3.9066 2.8880 1.5401 1.9222 5 3.9638 6.8895 4.2145 2.3246 1.7959 6 1.6918 3.8990 2.8962 1.9611 2.0233
Fig 3. The structure of new calanone derivatives. Their theoretical activities are (1) = 57.78 µg/mL, (2) = 30.94 µg/mL and (3) = 18.96 µg/mL [9].
analysis for constructing the QSAR equation.
Selecting the best QSAR equation
Selection of the best QSAR equation is conducted with evaluation of the statistical parameters such as r
(correlation coefficient), r2 (determination coefficient), F
(variance analysis), SE (standard error) and PRESS
(Prediction Residual Sum of Squares). The QSAR equation from the PCR analysis is:
Log IC50= 2.8055 – 0.1135 t1+ 0.2678 t2– 0.5696 t3 Some characteristics of the equation are as follows: n (the number of data) = 6, r = 0.991,
r2 = 0.982, SE = 0.0193, and Fcalc/Ftable = 1.987 and
PRESS = 7.49 10-4. The symbol t1 – t3 are latent variables.
This QSAR equation has good correlation (r
value) between activities and latent variables and can explain over 98% variations of data (see r2 value). Small error is also showed in this QSAR equation (see
SEvalue). It is also accepted at 95% confidence level because theFcalc/Ftableis more than 1.00.
Designing the new compounds
There are 3 factors that are used in the selection of the new calanone derivative candidates, i.e. theoretical activity obtained from QSAR equation calculation, the possibility in synthesizing the new compound and the ease to get the reactant for synthesis [9]. Based on the prediction calculation of their activity, some new compounds which may have better anti-leukemia activity are proposed e.g. gemdiol calanone (1), 2,4-dinitrophenylhydrazone calanone (2)
and 2,4,6-trinitrophenylhydrazone calanone (3) (see Fig. 3).
These three candidates could guide the synthesis procedures of new candidates of calanone derivatives become more focus. All the synthesis works can be started by using pure calanone that produced at Chemistry Research Center, The Indonesian Institute of Sciences (LIPI), Serpong, Indonesia.
CONCLUSION
QSAR analysis can be conducted for the small number of compounds but possessing large predictors using PCR method as regression analysis. Designing 3 more active candidates based on QSAR equation could focus the synthesis and prevent “trial and error” process. Therefore, high cost synthesis of novel calanone derivative could be avoided. More study is needed in order to synthesis the recommended compounds and to increase the theory level of calculation method in obtaining predictor data.
ACKNOWLEDGEMENT
for Computational Chemistry (AIC), Chemistry Department, Universitas Gadjah Mada.
REFERENCES
1. Chasani, M., 2002, Synthesis of Calanone Derivatives and Their Biological Activities, Thesis, University of Indonesia, Jakarta, Indonesia.
2. Young, David C., 2001, Computational Chemistry, John wiley & Sons, New York.
3. Iswanto, P., and Heny Ekowati, 2005, Modeling Novel Fluoroquinolone as Antibacterial Substance,
Mandala of Health: Scientific Journal, Medical Faculty, Universitas Jenderal Soedirman, Purwokerto, Indonesia.
4. Tahir, I., Wijaya, K. Purwono, B. and Widyaningsih, D., 2003,Indo. J. Chem. 3, 1, 48–54.
5. Yuliana, Pranowo, H.D., Jumina, and Tahir, I., 2004,Indo. J. Chem., 4, 1, 68–75.
6. McMurry, J., 2008, Organic Chemistry, 7th ed., Thomson Learning, Belmont, USA.
7. Miller, James N. and Jane C. Miller, 2005,
Statistics and Chemometrics for Analytical Chemistry, 5thed., Pearson Education Limited, UK. 8. Iswanto, P., Pranowo, H.D., and Tahir, I., 2004,
Quantitative Structure-Property Relationship Study of Glass Transition Temperatures of Poly(acrylic acid) Derivatives, Proceedings of Material Science and Technology Seminar 2004, PUSPIPTEK, Serpong, Indonesia.