Introduction
Chronic kidney disease (CKD) is now becoming a global concern. Globally, it affected 7% (approx-imately 488 million people) of total population in 2011, 1.6 million of which were in end-stage form, usually known as end-stage renal disease (ESRD) [HSCI, 2011]. In Indonesia, the number of CKD is staggeringly increasing. Almost 0.2% of total popu-lation, approximately 482 thousands, is believed to suffer from CKD [RISKESDAS, 2013].
It is estimated that 18,613 people are in ESRD in Indonesia [IRR, 2015]. ESRD patients are
primari-ly treated by replacing the function of renal system by two modalities; renal transplant or dialysis. Cur-rently, there are two forms of dialysis; Hemodialy-sis (HD) and Peritoneal DialyHemodialy-sis (PD). Transplant is recommended for long-term perspective to have good quality of life (QoL) associated with it. De-spite the benefit, there are requirements need to be fulfilled prior to transplantation, such as availability of a matching donor, goodness of body to receive the new organ, ethical issues, good knowledge, and the availability of experts and good equipped hospitals.
Another modality, Hemodialysis, is to filter out
Cost Effectiveness Analysis Between Hemodialysis and
Peritoneal Dialysis
Abstract
The number of patients with End Stage Renal Disease (ESRD) in Indonesia is growing. Increasing prevalence of hypertension and diabe-tes mellitus contribudiabe-tes to higher prevalence of ESRD. The majority of patients (94%) with ESRD are undertaking hemodialysis (HD) at public and private hospitals. However, continuous ambulatory Peritoneal Dialysis (PD) has been prescribed to small portion of patients with ESRD. The aim of this study was to examine the cost effectiveness between HD and PD on ESRD patients. This study compared 78 HD patients at Hospital X in Bogor and 10 PD patients at Hospital Y in Jakarta. Patient’s quality of life (QoL) was measured using SF 36 questionnaires. The costs were measured by direct medical costs using CBGs prices, direct non-medical costs (transportation, food for patient and family), and indirect medical costs (opportunity costs). The study found that the HD cost per year per patient was IDR 133.4 million and the comparative cost for PD was IDR 81.7 million. The study found lower QoL of HD patients (46.2%) com-pared to QoL of PD patients (90%). In addition, PD patients had significant better quality of physical activities, emotional states, social function, and sanity. The study found the incremental costs for to HD to reach similar emotional states was IDR 2.0 million compared to PD and IDR 1.8 million for extra physical role gained. It is concluded that PD was more cost-effective than HD in achieving a certain level of quality of life among patients with ESRD in two hospitals in Indonesia.
Keywords cost-effectiveness analysis, End stage renal diseases, dialysis
Abstrak
Jumlah pasien Gagal Ginjal Stadium Akhir (GGSA) di Indonesia terus meningkat. Meningkatnya prevalensi hipertensi dan diabetes mellitus (DM) berkontribusi terhadap prevalensi kasus GGSA. Mayoritas pasien (94%) dengan GGSA menjalani terapi hemodialisis (HD) baik pada Rumah Sakit (RS) swasta ataupun pemerintah. Bagaimanapun, dialisis peritoneal ambula-tori berkelanjutan (continuous ambulatory peritoneal dialysis/CAPD) telah diberlakukan pada sebagian kecil pasien dengan GGSA. Tujuan dari studi ini adalah untuk mengukur efektivitas harga dari HD dan CAPD pada pasien GGSA. Studi memband-ingkan 78 pasien HD di RS X Bogor dan 10 pasien CAPD pada RS Y Jakarta. Kualitas hidup pasien diukur menggunakan kue-sioner 36. Biaya diukur dengan biaya langsung medis (menggunakan harga CBGs), biaya langsung non-medis (transportasi dan biaya makan), serta biaya medis tidak langsung (biaya kesempatan). Studi menunjukkan bahwa HD membutuhkan biaya Rp 133,4 juta per orang per tahunnya, dibandingkan dengan CAPD sebanyak Rp 81,7 juta. Studi menemukan kualitas hidup yang lebih rendah pada pasien HD (46,2%) dibanding CAPD (90%). Selain itu, pasien CAPD memiliki kualitas yang lebih baik dari segi aktivitas fisik, status emosi, fungsi sosial, dan kejiwaan. Studi menemukan bahwa harga inkremental HD, untuk men-capai status emosional yang sama, dibanding CAPD yakni sebanyak 2 juta rupiah; dan 1,8 juta rupiah untuk menmen-capai peran fisik bila HD dibanding dengan CAPD. Dapat disimpulkan bahwa CAPD lebih efektif dari segi biaya dibanding HD dalam mencapai tingkatan kualitas hidup yang lebih baik pada pasien-pasien GGSA di dua RS di Indonesia.
Kata Kunci: analisis efektivitas biaya, gagal ginjal stadium akhir, dialisis
Elsa Novelia1, Ryan Rachmad Nugraha2, Hasbullah Thabrany2
1The National Health Insurance Corporation of Indonesia, Jakarta, Indonesia 2 Center for Health Economics and Policy Studies, Universitas Indonesia, Depok, Indonesia
Korespondensi: Elsa Novelia, e-mail: [email protected]
blood from certain toxic, excess of salt, and fluid us-ing a cleansus-ing machine. In Indonesia, this treatment was introduced in 1967, and has been implemented to date to tackle patients with ESRD. By 2015, there were approximately 382 centers operating across the country. [IRR, 2015]
The other modality is Peritoneal Dialysis that uti-lizes peritoneal membrane function using dialysis solution. Continuous Ambulatory Peritoneal Dialy-sis (CAPD) is the most common Peritoneal DialyDialy-sis applied in Indonesia. The solution must be changed up to 4 times a day [NKUDIC, 2013].
The National Health Insurance of Indonesia, known as JKN, reimbursed IDR 157,542,900 – 416,780,100 for a renal transplant, depending on hospital classes (for severe case requiring trans-plant). The JKN covers twice a week HD that takes 5 hours treatment with reimbursements varied from IDR 786,200 to IDR 982,400, depending on hospi-tal classes [MoH, 2016]. Despite higher cost-effec-tiveness from literatures, Peritoneal Dialysis is still under performed due to lack of dialysis centers that are willing to undertake PD throughout the country. The latest data showed that only 3% of 30,554 di-alysis patients in the JKN were on PD [IRR, 2015].
Data from other countries showed that the pro-portion of PD of the total dialysis were much higher. In Hong Kong, the rate of PD compared to Hemo-dialysis is almost 3:1 (71.8% to 25.6%) [USRDS, 2013]. This is mainly due to, among developed countries, PD is considered more cost-effective than Hemodialysis. The primary difference lies on the incentives of healthcare staffs and machineries/lo-gistical resources, of which Hemodialysis demands more than those of PD, with or without adjustment [Baboolal et al., 2008; Teerawattananon Y., et al., 2007]. However, there are several cases, especially in developing countries, where unit cost of Peritone-al DiPeritone-alysis is slightly higher than HD. The difference mainly lies on delivery cost on the dialysis soluble in PD. [Abu-Aisha et al., 2010].
In Indonesia, limited patient’s knowledge and reluctant of specialists to promote Peritoneal Dialysis is considered as the main reasons for low utilization of PD. In addition, limited information on costs and quality of life as well as limited supplies of professionals increase barriers to implement more PD. On the other hand, limited geographical access and transportation in a vast and widespread of Indonesia block access to dialysis for ESRD patients
in remote areas. Studies on life time costs and quality of life of patients with ESRD will help to convince decision makers to expand PD, especially for people living in remote areas where it is impossible to do weekly basis travel to HD centers. The main research questions are how much the costs and how good the quality of life of PD patients differ from HD patients. Methodology
This study was an economic evaluation to compared costs and outcomes, in term of quality of life of PD versus HD. The study was taken in Hospital X in Bogor regency and Hospital Y in Jakarta. The detail of the unit cost per patient per year includes: direct medical costs, direct non-medical cost, and indirect costs of both PD and HD treatments. Both of these components were identified from patients’ inter-views and providers’ interinter-views and then the total costs per component were calculated and grouped for one year of each HD and PD.
Specifically for direct medical costs of HD and PD, this study took tariff of INA-CBGs, a DRG type reimbursement under the JKN. The CBG tariffs for HD and PD differ for different regions and hospi-tal classes to represent costs of living and intensity of services in different class of hospitals. Informa-tion regarding non-medical costs (e.g. both patient’s and caregiver’s transportation costs and opportunity costs) was collected from the patients. The quality of life of each patient was measured using SF 36 questionnaire, a standard QoL.
The respondents selected in this study were all ESRD patients undertaking HD in Hospital X and all PD patients in Hospital Y. The inclusion criteria of age 18 and older, have been taken dialysis at least one year, and no mental health problem. Patients came to hospital X three times a week to undergo HD. At hospital X, most of patients were covered by the JKN, since the costs had been beyond the ability to pay of most Indonesians. No PD patients regis-tered at hospital X. For PD patients, the data col-lection was performed in patients’ residence, since patients come to the hospital only once a month for check up. They changed solution by themselves at home or at their office. Hospital Y provides both HD and PD since it is class A hospital, which higher than hospital X.
PD were calculated on the perspective of patients. Therefore, the cost components cover indirect op-portunity costs.
Result
This study collected costs and quality of life (QoL) data of about half the number of HD patients in hospital X and about half the number of PD pa-tients in hospital Y. Those who did not meet inclu-sion criteria or refuse to participate were excluded. The data collection was conducted in March-April 2014. This study collected costs and QoL data from 78 HD patients and 10 PD patients who met the inclusion criteria. Non-parametric statistics was ap-plied to test differences in costs and QoL.
The gender distribution of the HD respondents was 56% males while in PD patients 50% were males. The proportion of HD patients below 40 years of age was 23% while no PD patients aged be-low 40 years of age. About two third of HD patients had consultation with a specialist monthly while all PD patients met their doctor monthly. Almost 80% of the HD patients in this study had household ex-penditure per month below IDR 5 million, which consider low income, while 40% of PD patients be-long to this income groups.
The distribution of costs of HD and PD is shown in Table 1. As seen from the Table 1, the average annual total costs HD patients was larger than those
of PD patients., As shown in the table, the mean was larger than the median of HD patients due to higher direct medical costs in higher indirect costs.
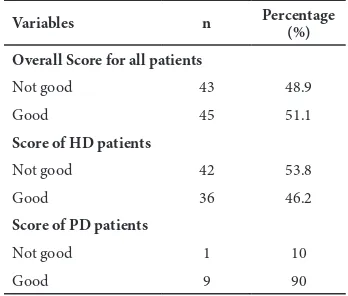
After measuring QoL, this study calculated the total scores of all variables and scores per types of QoL. The total scores were then grouped into good and not good.
Table 2. The Frequency Distribution of Quality of Life (QoL) HD and PD patients
Variables n Percentage (%)
Overall Score for all patients
Not good 43 48.9
Good 45 51.1
Score of HD patients
Not good 42 53.8
Good 36 46.2
Score of PD patients
Not good 1 10
Good 9 90
There were significant differences in QoL be-tween HD and PD patients. Only 46% of HD tients had good QoL compared to 90% of PD pa-tients (p<0.015). The study tested the differences in QoL among various groups such as employment, education, age, comorbidity of diabetes mellitus and hypertension, and length of dialysis. We found that only employment status made difference of QoL.
Table 1. The Cost of HD and PD Per Year Per Patient, in IDR million
Min Max Mean Median
Hemodialysis
INA CBGs tariff * 102 143 102 102
OOP** - 25 4 1.4
Direct medical costs 102 169 106 104
Direct non-medical costs 1.2 53 5.6 3.1
Indirect costs - 197 21.6 11
Total costs 103.4 419.6 133.9 117.8
PD
PD tariff 71.8 71.8 71.8 71.8
OOP** 0.6 24 9.9 10
Direct medical costs 72.4 95.8 81.7 81.8
Direct non-medical costs - - - -
Indirect costs - - - -
Total costs 72.3 95.8 81.7 81.8
*The minimum tariff of hemodialysis in B-class hospital, maximum tariffs of A-class hospital, and mean tariffs of B-class hospital **Not including the out-of-pocket payment for Cimino operation, as it is not yet covered under JKN
Those patients who were employed and used PD significantly had better QoL compared to those who had HD. There was a significant difference of QoL between HD and PD (p<0.01).
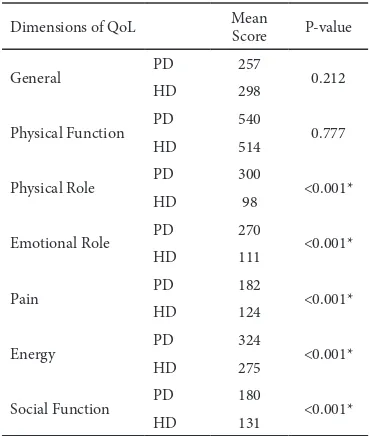
The Table 3 shows distribution of QoL score by components and the differences between HD and PD. We applied t-test to examine the differences of mean scores of various dimension of QoL between HD and PD patients. The table shoes significant differ-ences in dimensions of physical activity (p=<0.001), emotion (p=<0.001), pain (p=<0.001), social func-tion (p=<0.001), and mental health (p=<0.001).
The Cronbach’s alpha analysis also applied to ex-amine the order of QoL that made higher differenc-es. Ordered by the biggest to the smallest Cronbach alpha, the dimensions were: 1) emotional role, 2) physical role, 3) mental health, 4) energy, 5) pain, and 6) social function. Then, we calculated the costs of to reach a unit gain of each dimension for HD and PD patients.
Table 3. The Differences on component of QoL between HD and PD patients, T-test
Dimensions of QoL Mean
Score P-value
General PD 257 0.212
HD 298
Physical Function PD 540 0.777
HD 514
Physical Role PD 300 <0.001*
HD 98
Emotional Role PD 270 <0.001*
HD 111
Pain PD 182 <0.001*
HD 124
Energy PD 324 <0.001*
HD 275
Social Function PD 180 <0.001*
HD 131
The authors calculated the Average Cost Effective Ratio to reach the score of good QoL for HD and PD patients. To reach a good QoL, HD patients required IDR 2.9 million while the PD patients required only IDR 0.91 million. We then calculate the incremental cost-effectiveness ratio (ICER) resulting in PD was more cost effective by IDR 1.2 million per extra QoL gained. The cost to achieve good physical role for HD was IDR 3.2 million, while the cost to achieve the similar QoL for PD was only IDR 1.2 million. The ICER for PD as compared to HD was IDR 1.8
per extra physical role gained. The plot of cost-effec-tiveness analysis, comparing PD and HD, displayed that PD occupied the 2nd quadrant, which means desired dominant from the cost and outcome per-spectives as shown in Figure 1 below.
Figure 1. Cost-effectiveness plane
Discussion
Everywhere in the World, treating ESRD needs that are costly. At present, three options of treating ESRD are available: HD, PD, and renal transplant. Since re-nal transplant confronts supply problems, especially in low-income countries where donors are scarce, HD and PD remain the dominant practices. Coun-tries have different priorities in undertaking HD and PD. It is paradoxical for low and middle countries where financial resources are scarce, but practices of HD and PD have been lack of economic evalua-tion. Under the current UHC, the ESRD consumed the third largest expenditures. However, many ESRD patients in remote areas or islands have not received fair access due to very low proportions (less than 5% currently) of ESRD patients receiving PD. Eval-uation of cost-effectiveness is needed to convince the policy makers to promote more PD or to make a policy of PD first, such as implemented in Thailand.
similar costs. In developing countries such as in Bangladesh, India, Pakistan, and Sri Lanka, the med-ical costs of PD were relatively higher than the costs of HD, because the cost of labors were relatively lower than imported solutions for PD. Although the medical costs of PD were higher, counting the total costs of HD (including direct non-medical costs and indirect cost) resulted in costs of HD were relatively higher than costs of PD. [Philip et al., 2001]
The cost calculation is not adequate to evaluate how good a medical intervention compared to other alternatives. These studies also compared the out-comes and evaluate cost-effectiveness of HD com-pared to PD. The study finding was similar with other studies reported by Noshad et al. for both di-abetic and non-didi-abetic HD patients. In every aspect of QoL, PD patients showed better score than HD patients [Noshad et al., 2009]
This study measured quality of life using SF 36 questionnaire with 8 (eight) dimensions. The study showed significant higher quality of life of those treated with PD for dimensions of physical role, emotional role, pain, energy, social function, and mental health. Another study showed higher scores of in dimension of family life, self-dependency, spiritual condition, energy level, and overall life condition. Higher QoL of PD patients, mainly related to additional energy and self-dependency acquired by PD patients, since the patients can do dialysis at home or at work. This study is consistent with a finding in Hong Kong that showed higher score in emotional role and mental health [Thong and Kaptein A, 2008]
In contrast, many HD patients experienced trou-blesome coping with sleep disturbances and anxiety due to feeling of high emotional burden for rou-tine dialysis to health care facilities [Coccossis et al., 2008]. The symptoms were due to stress related di-alysis procedure, high frequency of visit to hospital, long waiting time in HD unit, and ill-treatment from the medical personnel during HD in hospital. Studies found that HD patients were more prone to develop depressive symptoms and tend to attempt suicide. On the other hand, PD patients showed less stress and better QoL [Thong and Kaptein A, 2008].
This study dig more on costs and QoL to compare the two most common options in tackling ESRDs. The study found that ICER of PD compared to HD was IDR 1.2 million to gain additional score of QoL. That amount of saving is about a quarter of monthly
family income of the household surveyed. The ICER of PD compared to HD was IDR 1.8for every extra physical role gained. This study affirmed study by Philip and by Karin who also PD was found that the costs of PD relatively lower than HD to achieve sim-ilar quality of life. [Karin S., Magnusson M., Carls-son P., 2002]
More thorough studies and or pilot project to im-plement PD First are required due to limitation in-herent in this study. Limited sample of patients and study sites involved (only two hospitals) become the biggest concern. Although, the results are consistent with findings from various studies elsewhere in the world, precaution is adviced before expanding PD.
Conclusion
It is concluded that from payer and patients per-spectives, PD is much more efficient and effective to manage ESRD patients. The study suggested that PD should be given the 1st priority in treating ESRD patients, subject to the fulfillment of the medical re-quirements. The authors recommended that the gov-ernment and the National Social Security Council (DJSN) conduct more thorough studies to evaluate CEA and ICER of PD versus HD in a larger scale. In addition, budget impact analysis for the Indonesian UHC (JKN) should be performed before the PD First policy is be applied nationwide. A pilot pro-spective study is considered to be the best way to implement the PD First policy. In the end, the JKN will benefit and the ESRD patients in many regions with difficult physical access will benefit the most.
Acknowledgement
Author would like to express the outmost gratitude to the Hospital X and Hospital Y for approving the data collection at the sites.
References
Albert W Wu, Nancy E Fink, Jane VR, Marsh Manzi, 2004. “Changes in quality of life during haemodialysis and peritoneal dialysis treatment.” J Am Soc Nephrol. 15: 743-753.
Chonchol, M Spiegel DM., 2005. The Patient with Chronic Kidney Disease. Philadelphia: In Schrier, RW 6th ed Manual of Nehrology.
differences in early and later years of current treatment.” BMC Neprhology. p9-14.
Harvard Stem Cell Institute (HSCI). “Kidney Dis-ease Program.” 2011. http://www.hsci.harvard.edu/ node/905.Diakses 15 Januari 2014.
Indonesia Renal Registry. 2013. “List Renal yang terdaftar.” http://www.indonesianrenalregistry.org/
renal_tabel.php. Diakses 15 Januari 2014.
Ministry of Health (MoH) Government of Indo-nesia (GoI),2016. Permenkes No. 52 Thn. 2016 tentang Standar Tarif Pelayanan Kesehatan dalam Penyelenggaraan Program Jaminan Kesehatan. Jakarta.
Indonesian Nephrologist Association. 2015. 8th
Re-port Indonesia Renal Registry. http://www.indones-iarenalregistry.org/renal_tabel.php. Diakses 1 April
2017.
Baboolal K., McEwan P., Sondhi S., Spiewanows-ki P., WechowsSpiewanows-ki J., Wilson K. 2008. The cost of renal dialysis in a UK setting–a multicentre study. Nephrol Dial Transplant 23 (1): 1989–89. Teerawattananon Y., Mugford M.,
Tangcharoen-sathan V., 2007. Economic Evaluation of Pal-liative Management versus Peritoneal Dialysis and Hemodialysis for End-Stage Renal Disease: Evidence for Coverage Decisions in Thailand. Value in Health. 10: 61–72.
United States Renal Data System (USRDS), 2015. USRDS Annual Data Report.
Abu-Aisha, et al., 2010. Peritoneal Dialysis in Afri-ca.
Karopadi., et al., 2013. “Cost of Peritoneal Dialysis and Haemodialysis Across the World.” Nephrol Dial Transplant http://www.medscape.com/viewarti-cle/812610_1. Accessed on January 15th, 2014.
Noshad, Sadreddini S, Nezami N, Salekzamani Y, and Ardalan M. R., 2009. “Comparison of outcome and quality of life: haemodialysis versus peritoneal dialysis patients.” Singapore Med. 185-192.
National Kidney and Urologic Diseases Information Clearinghouse (NKUDIC)., 2013. “Kidney Fail-ure: Choosing a Treatment Thats Right For You.”. http://kidney.niddk.nih.gov/kudiseases/pubs/choosing treatment/. Accessed on January 15th, 2014.
Prodjosudjadi, and W Suharjono., 2009. “End Stage Renal Disease in Indonesia, Treatment Develop-ment.” Ethnicity and Disease. S1-33,S1-36. Philip, 2001. “The Cost Barrier to peritoneal
dial-ysis in the developing world-an asian perpective.” Peritoneal Dialysis International.
Peeters P, rublee D, Just PM, Joseph A., 2000. “Analysis and interpretation of cost data in dial-ysis.” West European Literature, Health Policy. 54: 209-27.
Thong, Mellisa SY, and Adrian a Kaptein, 2008. Quality of life in patients on peritoneal dialysis. Springer, USA: Nolp and Gokald Textbook on Peritoneal Dialysis.
Sennfalt, Karin, Martin Magnusson, and Per Carlsson, 2002. “Comparison of Hemodialysis and Peritoneal Dialysis- A Cost Utility Analysis.” Peritoneal Dialysis International. 22: p39-47. Sherwood, Lauralee, 2001. Fisiologi Manusia dari Sel
ke Sistem, Edisi 2. Jakarta: Penerbit Buku Kedok-teran EGC.