Peatland Distribution in Sumatra and
Kalimantan- explanation of its data sets
including source of information, accuracy,
data constraints and gaps
By:
Drs. Wahyunto and I Nyoman N. Suryadiputra
Indonesia Programme
Peatland Distribution in Sumatra and Kalimantan-
explanation of its data sets including source of information,
accuracy, data constraints and gaps
© Wetlands International – Indonesia Programme, 2008
Authors : Drs. Wahyunto and I Nyoman N. Suryadiputra
Lay-out : Triana
Cover Photographs : Doc. Wetlands International – IP
Laporan ini dapat diperoleh di:
Wetlands International – Indonesia Programme Jl. A.. Yani No. 53 Bogor 16161
Jawa Barat – INDONESIA Tel. 0251 312189 Fax. 0251 325755 E-mail: [email protected]
Reference:
Wahyunto and I Nyoman N. Suryadiputra. 2008. Peatland Distribution in Sumatra and Kalimantan-explanation of its data sets including source of information, accuracy, data constraints and gaps. Wetlands International – Indonesia Programme. Bogor. xiii + 52.
Preface
This report describes the steps taken to produce Atlases of the distribution and stores of below-ground Carbon in the peatlands of Sumatra and Kalimantan. This report is intended to be read in conjunction with the Atlases produced and is incomplete without it. Readers are therefore strongly advised to read both documents. The titles of these atlases are :
• Wetlands International. 2003. Peta-peta sebaran lahan gambut, luas dan
simpanan/kandungan karbon di Sumatra (Maps of peatland distribution and carbon content in Sumatra), 1990-2002.
• Wetlands International. 2004. Peta-peta sebaran lahan gambut, luas dan simpanan/
kandungan karbon di Kalimantan (Maps of peatland distribution and carbon content in Kalimantan), 2000-2002.
We are aware that in the production of these atlases we faced a number of constraints, all of which are discussed in this report. Nevertheless, we hope that the information contained within this report (and the atlases) will provide input for academics, researchers, policytakers and policymakers that will enable the peatlands of Sumatra and Kalimantan to be managed sustainably. By knowing the location and extent of peatlands in each kabupaten (district) of Sumatra and Kalimantan, it is hoped that managers will be more careful in deciding how they should be developed, considering that peatlands are highly vulnerable to fire but that their function, if well maintained, will provide many benefits to a wide variety of life both on and around them.
Finally, to all who have been involved directly or indirectly in the production of this book, we express our sincere thanks and hope that the time and effort that you have contributed will benefit us all in conserving Indonesia’s wetlands in general, and in particular those in Sumatra and Kalimantan.
The authors
Table of Contents
Page
PREFACE iii
GLOSSARY OF TERMS AND ABBREVIATIONS x
1. INTRODUCTION 1
2. BACKGROUND TO THE COMPILATION OF THE PEATLAND
DISTRIBUTION ATLAS 2
3. COMPILATION OF PEAT DISTRIBUTION ATLAS FOR
SUMATRA AND KALIMANTAN 4
3.1. Primary data used to compile Maps of Peat Distribution and Carbon
Content (spatial data) 4
3.2. Other supporting maps 5
3.2.1. Peta Rupabumi Indonesia (RBI) scale 1:250,000 published
by Bakosurtanal, 1996 - 2000 as spatial data (for basic map) 5
3.2.2. Soil and land mapping units scale 1:250,000 for the whole of Sumatra Island, published by Pusat Penelitian Tanah dan
Agroklimat (Puslitanak), 1990 8
3.2.3. RePPProT Maps 10
3.3. Satellite Imagery 12
3.3.1. Sumatra 12
3.3.2. Kalimantan 14
3.4. Soil maps and reports of surveys and soil mapping in Sumatra and
Kalimantan 16
4. METHODS AND STEPS TO DETERMINE THE PRESENCE OF
PEAT, ITS DELINEATION AND AREA 27
4.1. Collect and study maps and their report booklets containing
4.1.1. Peta Rupabumi Indonesia (Digital) maps scale 1:250,000 published by Bakosurtanal from 1986 to 1990 for the whole
of Sumatra 27
4.1.2. Peta Rupabumi Indonesia (Digital) maps scale 1:250,000 published by Bakosurtanal from 1990 to 2002 for the whole
of Kalimantan 28
4.2. Compilation of basic map for the presentation of peat distribution
maps 29
4.3. Compilation of peat maps/data, processing, analysis, evaluation, standardisation of information/scale, presentation in map form
(maturity level, depth, BD, land use and distribution) 29
4.4. Satellite imagery analysis to detect peatland distribution 30
4.5. Combination of data on peatland bio-physico-chemical condition obtained from the literature study with those on distribution, depth
and land-use type obtained from satellite image analysis 32
4.6. Ground truthing 32
4.6.1. Aims 32
4.6.2. Validation points & constraints encountered 33
4.6.3. Intensity of field monitoring (number of monitoring points
and level of accuracy) 33
4.7. Post ground-truthing activities 34
4.7.1. Re-analysis and map revision, compile and consolidate
classification of peat swamp land characteristics 34
4.7.2. Determination of area, delineation and distribution of
peatland 34
4.7.3. Map formatting prior to printing, scale 1:250,000, for each
province and the island 38
4.8. Constraints affecting compilation of peat distribution maps/Atlas 41
4.8.1. Landsat images (out of date, cloud cover, etc) 41
4.8.2. Maps used 41
4.8.3. Ground truthing limitations (area and intensity of
observation) 41
4.8.4. Regional growth (changes to provincial and district
5. ESTIMATE OF BELOW GROUND CARBON STORE 42
5.1. Acquisition of data for key parameters 42
5.2. Formula for Estimating Below Ground Carbon Store 43
5.3. Example of calculation 44
5.4. Constraints affecting calculation of Carbon store 47
6. RECOMMENDATIONS FOR IMPROVEMENT 50
LIST OF TABLES
Table 1. Estimates of peatland area and distribution in Indonesia by various
authors/sources (taken from Najiyati et al 2005) 2
Table 2. Peatland distribution and its carbon stores in each province 3
Table 3. RBI maps of Sumatra used as basic maps for the compilation of the
peatland distribution Atlas for Sumatra 7
Table 4. RBI maps of Kalimantan used as basic maps for the compilation of
the peatland distribution Atlas for Kalimantan 7
Table 5. LAND SYSTEM AND LAND SUITABILITY MAPS, published by
RePPProT, Dep. Transmigrasi, 1986 (Sumatra) 11
Table 6. Table 6. LAND SYSTEM AND LAND SUITABILITY MAPS,
published by RePPProT, Dep. Transmigrasi, 1986 (Kalimantan) 12
Table 7. Satellite Images used to compile Atlas of peatland distribution in
Sumatra 14
Table 8. Satellite images used to compile Atlas/maps of peatland distribution
in Kalimantan 15
Table 9. Maps and reports/information used as reference for compiling the Atlases of Peat Distribution and carbon store in Sumatra and
Kalimantan 16
Table 10. Distribution and Area of Peatland in Sumatra, 1990 35
Table 11. Distribution and Area of Peat Swamp Land in Central Kalimantan
Province (Kalimantan Tengah). 37
Table 12. Values of BD and C-organic for different maturity levels of peat in
Sumatra (Wahyunto et al -WIIP, 2004) 42
Table 13. Values of BD and C-organic for different maturity levels of peat in
Kalimantan (Wahyunto et al -WIIP, 2004) 43
Table 14. Examples of calculation of carbon store for different peat maturity
levels in East Kalimantan province 45
Table 15. Accuracy level as affected by number of observation points / samples 48
Table 16. Effect of accuracy level on the total size of the survey team
LIST OF FIGURES
Figure 1. The RBI map data was used as a basic map on which to show the
distribution of peat in Sumatra 6
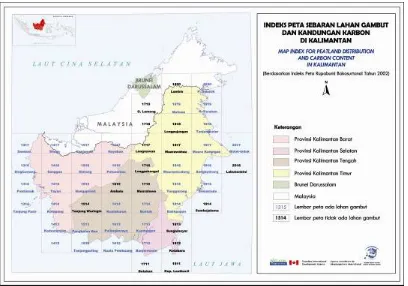
Figure 2. The RBI map data was used as a basic map on which to show the
distribution of peat in Kalimantan 6
Figure 3. The soil and land mapping units used as a source of main data for
the Peat Distribution Map in Sumatra 9
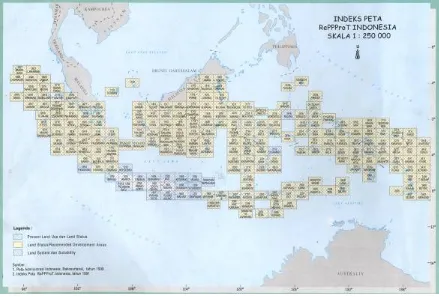
Figure 4. Landsystem and Land Suitability Map published by RePPProT that
were used for Peat Distribution Maps in Sumatra and Kalimantan 10
Figure 5. Satellite image used for the peat distribution map in Sumatra 13
Figure 6. Satellite image used for the peat distribution map in Kalimantan 15
Figure 7. Map of peat distribution and carbon content in Riau Province 38
Figure 8a. Map of peat distribution and carbon content in Sumatra, 1990 39
Figure 8b. Map of peat distribution and carbon content in Sumatra, 2002 39
Figure 9. Map of peat distribution and carbon content in Central Kalimantan
Province 40
Figure 10. Map of peat distribution and carbon content in Kalimantan 40
Glossary of Terms and Abbreviations
Bakosurtanal. : National Mapping Coordination Board (Badan Koordinasi dan Pemetaan Nasional)
Balitbang : Research and Development Agency (Badan Pelitian dan Pengembangan)
BAPPEDA : Regional Development Planning Agency (Badan Perencanaan Pembangunan Daerah)
BAPPENAS : National Development Planning Agency (Badan Perencanaan Pembangunan Nasional)
BMG : Meteorology and Geophysics Office (Badan Meteorogi dan
Geofisika)
BPPT : Agency for the Assessment and Application of Technology
(Badan Pengkajian dan Penerapan Teknologi)
Bulk Density : The weight of a volume of undisturbed peat soil expressed in units of gr/cc or kg/m3. Values range between 0.10-0.40 gr/cc, depending on the peat’s level of maturity
CCFPI : Climate Change Forests and Peatlands in Indonesia, is a forestry project which is closely related to the issue of climate change, where the forest plays an important role in carbon sequestration. This project is implemented by WI-IP together with Wildlife Habitat Canada (WHC) and funded by grants from the Canadian Goverment (CIDA, Canadian International Development Agency) through the Canada Climate Change Development Fund for a period of four years (August 2001 – September 2005), then extended to December 2006. Activities under this Project involve the participation of community and government in the conservation and rehabilitation of peatlands and peat forests in Indonesia. This Project was specifically designed to support the United Nations Framework Convention on Climate Change (UNFCCC) for Canada and Indonesia.
CDM : Clean Development Mechanism
CIDA : Canadian International Development Agency
DAS : River catchment area (Daerah Aliran Sungai)
Decomposition : The breaking down of organic material by living creatures (mainly bacteria and moulds) in the environment, that produces inorganic compounds or simpler organic compounds.
Deptan : Ministry for Agriculture (Departemen Pertanian)
Ditjen.Bina Bangda : Directorate General for Regional Development, Ministry of Home Affairs (Direktoral Jenderal Bina Pembangunan Daerah, Departemen Dalam Negeri)
Ditjen PHKA : Directorate General for Forest Protection and Nature Conservation, under the Ministry for Forestry (Direktorat Jenderal Perlindungan Hutan dan Konservasi Alam, Departemen Kehutanan)
GEC : Global Environmental Center, a NGO based in Kuala Lumpur
Malaysia
GHG : Green House Gases: certain gases in the atmosphere that can
obstruct/prevent the escape of infrared radiation from the earth, with the result that the average temperature of the earth’s surface is getting warmer. This resembles the trapping of infrared radiation inside a greenhouse, thus raising the temperature. The Kyoto Protocol lists six types of GHG whose emissions must be regulated/reduced: carbon dioxide (CO2), nitrous oxide (N2O), methane (CH4), sulphur hexafluoride (SF6), perfluorocarbon (PFC), and hydrofluorocarbon (HFC).
Giga : 109 (1,000,000,000) E.g. 1 Giga ton = 1,000,000,000 ton
HPH : Forestry Licence (Hak Pengusahaan Hutan)
IPB : Bogor Agricultural University (Institut Pertanian Bogor)
Keppres : Presidential decree (Keputusan Presiden)
Kpts : Decree/decision (Keputusan)
LAPAN : National Institute for Aeronautics (Lembaga Penerbangan dan Antariksa Nasional )
LIPI : Indonesian Institute of Sciences (Lembaga Ilmu Pengetahuan
Indonesia)
LREP : Land Resources Evaluation and Planning Project
LSM : Non-governmental organisation (Lembaga Swadaya Masyarakat)
MenHut : Minister for Forestry (Menteri Kehutanan)
Men LH : Minister for the Environment (Menteri Lingkungan Hidup)
NGO : Non-governmental Organisation. A non-profit organisation
managed outside the political structure with the purpose of achieving a particular social aim.
Organosol / histosol : Soil that contains enormous quantities of organic materials from partially decomposed plant matter. This soil is formed because the low oxygen content of inundated land slows down the decomposition of organic materials. The term ‘histosol’ derives from the word Histos meaning ‘network’. ‘Histosol’ can therefore be taken to mean ‘soil constructed from a network’. The term ‘organosol’ indicates soil with a very high content of organic materials. Organosol and Histosol are terms used in soil classification, usually to denote soil commonly known as peat.
Parit : Ditch, a small channel (width 0.5 – 3 m; depth 0.6 – 1.5 m length up to 13 km), made in peatland, usually dug by individuals or groups to transport logs and/or other forest products
Peat : (organosol or histosol) soil formed from the accumulation over a
long period of time of organic matter such as the remains of plants. Peat soil is generally waterlogged or flooded all year long unless drained. Several experts have defined ‘peat’ in different ways:
• According to Driessen, 1978: peat is soil containing more
than 65% organic material (dry weight) and having a peat depth greater than 0.5 m.
• According to “Soil Taxonomy”: peat is soil comprised of
organic materials with a thickness exceeding 40cm or 60cm, depending on the bulk density and level of decomposition of the organic matter
Peat dome : The central part of peatland, which rises like a dome. This part is usually less fertile because its nutrients come only from rainwater.
PEMDA : Regional Government (Pemerintah Daerah)
PERDA : Regional Regulation (Peraturan Daerah)
PLG : Proyek Lahan Gambut – the one million hectare peatland project developed in Central Kalimantan in 1995 during the era of President Suharto. The project was officially terminated in 1999 during the term of President Habibi because it was considered to be a failure.
PP : Government Regulation (Peraturan Pemerintah)
PU : Public Works (Pekerjaan Umum)
Puslitanak : Soil and Agroclimate Research Centre (Pusat Penelitian Tanah dan Agroklimat)
RePPProT : Regional Physical Planning Project for Transmigration
RTRWP : Provincial Spatial Planning (Rencana Tata Ruang Wilayah Propinsi)
SK : Decree/decision (Surat Keputusan)
Subsidence : In a geological, technical or mapping survey context, subsidence is defined as the downward movement or collapse of a surface (usually the earth’s surface) relative to a certain datum – usually sealevel. The opposite of subsidence is uplift, which raises up the surface. In the context of peatlands, subsidence means the collapse of the peat’s surface, usually as a result of over-drainage or damage to its hydrology and vegetation, oxidation of the peat.
UGM : Universitas Gajah Mada
UNEP : United Nations Environmental Programme
UNFCCC : United Nations Framework Convention on Climate Change
UU : Law (Undang Undang)
WHC : Wildlife Habitat Canada, a NGO in Canada
WI-IP : Wetlands International-Indonesia Programme, an international non-profit organisation active in the field of wetlands conservation
1. Introduction
Peatland is a wetland ecosystem characterised by the accumulation of organic material over a long period of time. This accumulation occurs because organic materials pile up on the floor of wetland forests much more quickly than they decompose. The formation of peat almost always occurs in inundated conditions or in wet coastal basins where organic materials are produced in large quantities.
At the turn of the 21st century, the best known functions of peatlands were its role as a wetland habitat that supported characteristic flora and fauna (biodiversity), as a hydrological regulator (preventing floods during the wet season and preventing seawater intrusion during the dry), and as a source of livelihoods for the local community (e.g. timber for house construction, industry, foodstuffs, medicines, etc.). However, as we approach the end of the 2000s, the world’s attention has begun to widen to see the global role that peat plays on the surface of this Earth, that is as a wetland habitat capable of sequestering and storing large amounts of carbon and thereby preventing the emission of green house gases (CO2 in particular), that impact on climate change, into the Earth’s atmosphere.
The world’s increasing attention to peat is not unrelated to the realization by many nations that global climate change is occurring and will have far reaching consequences for divers aspects of life on the surface of this Earth. One indication of their concern is the ratification of the United Nations Framework Convention on Climate Change (UNFCCC) by a variety of countries, despite the inadequate support given by certain countries to its implementation on a practical level (as specified in the Kyoto Protocol).
2. Background to the compilation of the
Peatland Distribution Atlas
To date, there is still uncertainty regarding some of the data and information on the extent (area), thickness and distribution of peatlands in Indonesia (including their physico-chemical characteristics). This is a serious constraint as precise, accurate data of this type is a necessary prerequisite to drawing up an appropriate peatland management strategy. The uncertainty is reflected in the wide variation in the figures obtained for the total extent of peatlands in Indonesia, ranging from 13.5 to 26.5 million ha, as submitted by different sources (Table 1). Meanwhile, other sources estimate the total to be around 20.6 million ha (22.5 million ha according to Hooijer et al, 2006) or about 10.8% of Indonesia’s land area. Of this total, approximately 7.2 million ha is thought to lie on the island of Sumatra, 5.76 million ha in Kalimantan, and the remainder in Papua and other regions of Indonesia.
Table 1. Estimates of peatland area and distribution in Indonesia by various authors/ sources (taken from Najiyati et al 2005)
Peatland distribution and area (million ha) Author/Sources
Sumatra Kalimantan Papua Other Total
Driessen (1978) Puslittanah (1981) Euroconsult (1984) Soekardi & Hidayat (1988) Deptrans (1988)
Subagyo et al. (1990) Deptrans (1990) Nugroho et al. (1992) Radjagukguk (1993) Dwiyono& Racman (1996)
Wetlands International (2002 – 2006)
9.70
* not including peatland associated with saline land and floodplain (2.46 million ha)
Remote Sensing / Satellite Imaging and Geographic Information System (Sistim Informasi Geografis, SIG). The data/information thus collected covered peat thickness, type/maturity, physico-chemical properties, extent and distribution, as well as an estimate of its below ground carbon content. Determination of the extent, distribution and carbon content of peatlands on the island of Sumatra was made based on information from 1990 and 2002, that for Kalimantan on data from 2000 and 2002. Data for Papua will not be discussed in this report.
To obtain the above information, WIIP worked together with (or at least used data from) a variety of sources, including Bogor Agricultural University (Institut Pertanian Bogor, IPB), the National Survey and Mapping Coordination Agency (Badan Koordinasi Survey dan Pemetaan Nasional, Bakosurtanal), the Soil and Agroclimate Research Centre (Pusat Penelitian dan Pengembangan Tanah dan Agroklimatology, Puslitanak).
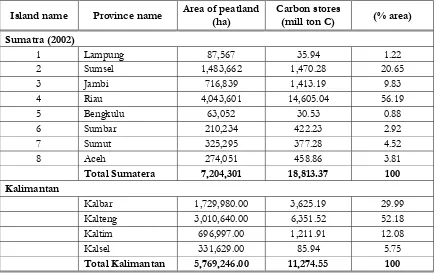
From the above study two peatland atlases which represent Sumatra and Kalimantan were produced. Each atlas describes the area and distribution of peatlands at the district level of each province in the island as well as the amount of carbon stored therein. Table 2 below gives a summary of this data for each island and its provinces (note: WIIP has also recently finalized the atlas for Papua.)
Table 2. Peatland distribution and its carbon stores in each province
Island name Province name Area of peatland (ha)
Carbon stores
(mill ton C) (% area) Sumatra (2002)
1 Lampung 87,567 35.94 1.22
2 Sumsel 1,483,662 1,470.28 20.65
3 Jambi 716,839 1,413.19 9.83
4 Riau 4,043,601 14,605.04 56.19
5 Bengkulu 63,052 30.53 0.88
6 Sumbar 210,234 422.23 2.92
7 Sumut 325,295 377.28 4.52
8 Aceh 274,051 458.86 3.81
Total Sumatera 7,204,301 18,813.37 100 Kalimantan
Kalbar 1,729,980.00 3,625.19 29.99
Kalteng 3,010,640.00 6,351.52 52.18
Kaltim 696,997.00 1,211.91 12.08
Kalsel 331,629.00 85.94 5.75
3. Compilation of Peat Distribution Atlas
for Sumatra and Kalimantan
Chapters III to V of this report describe the steps taken by WIIP in compiling peat distribution atlases for Sumatra and Kalimantan. The compilation of these atlases (also the one for Papua, which is not discussed in this report) was paid for by the CCFPI funded by CIDA. The atlas of Sumatra’s peat swamps was published by WIIP in 2003 (containing the results from the identification of peatland area and distribution in 1990 and 2002), while the atlas for Kalimantan was published in 2004 (containing results from 2002) and that for Papua in 2006 (results from 2000/2001).
3.1. PRIMARY DATA USED TO COMPILE MAPS OF PEAT DISTRIBUTION AND CARBON CONTENT (SPATIAL DATA)
The peat distribution atlases for Sumatra and Kalimantan were compiled with reference to a number of maps published (mainly) by Puslitanak, in project reports (LREP and RePPProT) and their annexes, which form an integral part of the whole publication. The following is a list of the references used:
a. Atlas Peta Tanah Eksplorasi Indonesia skala 1:1.000.000 (Exploration soil map atlas of Indonesia) published by Puslitbang Tanah dan Agroklimat, 2000
b. Peta tanah eksplorasi Pulau Kalimantan skala 1:1000.000 (Exploration soil maps for Kalimantan) published by Puslit Tanah dan Agroklimat, 1997
c. Peta Lahan Rawa Pulau Kalimantan skala 1:1000,000 (Maps of swamp land in Kalimantan) published by Puslit. Tanah dan Agroklimat, 2000
d. Peta tanah tinjau mendalam wilayah pengembangan lahan gambut sejuta hektar (PLG), Kalimantan Tengah skala 1:100,000 (Detailed reconnaissance soil maps for million hectare peatland project in Central Kalimantan) published by Puslit Tanah dan Agroklimat, 1998
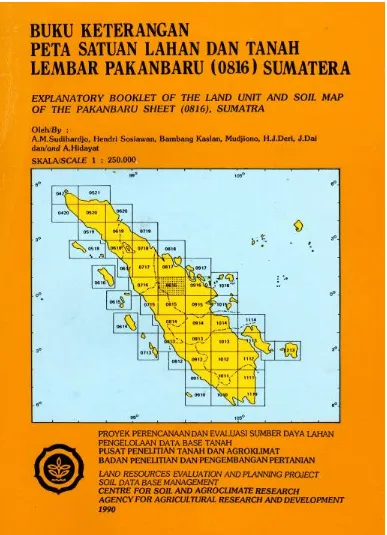
e. Peta dan buku Keterangan Satuan Lahan dan Tanah skala 1:250,000 (Map and explanatory booklet on soil and land mapping units) published by Land Resources Evaluation Project (LREP), Pusat Penelitian Tanah Bogor, 1990.
f. Land System and Land Suitability Map published by RePPProT, Department for
3.2. OTHER SUPPORTING MAPS
In addition to the primary materials listed above, reference was also made to a number of other documents, including maps, reports and remote sensing / satellite imagery data. The data/maps below were used as references for compiling spatial information, as point source data, and as peatland characteristics data.
For example: if at one site/point on the map or in the report it is stated that the site comprises shallow peat of hemist maturity level, this information can then be used as a reference, whereas for its spatial distribution reference is made to delineation and satellite imagery analysis, topographic maps, and geological maps.
3.2.1. Peta Rupabumi Indonesia (RBI) scale 1:250,000 published by Bakosurtanal, 1996 - 2000 as spatial data (for basic map)
The RBI map provides information on the distribution of : (a) road networks that include State roads at provincial and district level, as well as roads linking sub-districts and villages; (b) rivers flowing through the area, and the direction of their flow; (c) height contour lines and shorelines ; (d) cities and provincial, district (kabupaten) and sub-district (kecamatan) level settlements; (e) main types of land use: wet rice-fields, dry fields, forest, lakes, swamps; (f) administrative boundaries between provinces and kabupatens; (g) place names and types of land use (mountain, swamp, town, village, river, beach/coast).
Information on road networks, rivers, shoreline, distribution of settlements/ towns and lakes/swamps was all updated from satellite imagery analysis, while administrative area maps were revised from the administrative maps published by Bappenas (1986) and KPU (2003).
This digital RBI map data was used as a basic map on which to show the distribution and carbon content of peat in Sumatra and Kalimantan, each map on a scale of 1:250,000. The peat distribution maps for each province and island were generalized from the integration of several RBI maps (scale 1:250,000). A number of topographic maps (scale 1:250,000) were also used to calculate the area of peatland in each kabupaten district. These maps were processed using the Geographic Information System (Teknik Sistem Informasi Geografi) digital file data so that they could be printed in Ao format. For ease of use and portability, however, the final maps in the Peat Distribution ATLAS are also available as a handier A3 size hard copy.
Figure 1. The RBI map data was used as a basic map on which to show the distribution of peat in Sumatra
Figure 2. The RBI map data was used as a basic map on
Table 3. RBI maps of Sumatra used as basic maps for the compilation of the peatland distribution Atlas for Sumatra
No. Map No. Map Name No. Map No. Map Name
1 0421 Banda Aceh 22 0912 Bengkulu
2 0420 Lhok Kruet 23 0911 Manna
3 0521 Lhok Seumawe 24 1014 Jambi
4 0520 Takengon 25 1013 Palembang
5 0519 Tapak Tuan 26 1012 Lahat
6 0518 Sinabang 27 0714 Muara Siberut
7 0620 Langsa 28 1011 Baturaja
8 0621 Simpang Ulim 29 1016 Pangkal Pinang
9 0619 Medan 30 1010 Kotaagung
10 0618 Sidikalang 31 1113 Bangka
11 0617 Sibolga 32 1112 Toboali
12 0616 Teluk dalam 33 1015 Dado
13 0719 Tebing Tinggi 34 1111 Menggala
14 0718 Pematang Siantar 35 1110 Tanjung Karang
15 0717 Padang Sidempuan 36 0814 Painan
16 0716 Lubuk Sikaping 37 0812 Ketahun
17 0715 Padang 38 0813 Sungai Penuh
18 0714 Muara Siberut 39 0917 Bengkalis
19 0818 Bagan Siapi-api 40 0916 Siak Sri Inderapura
20 0817 Dumai 41 0915 Rengat
21 0816 Pakanbaru 42 0914 Muarabungo
22 0815 Solok 43 0913 Sarolangun
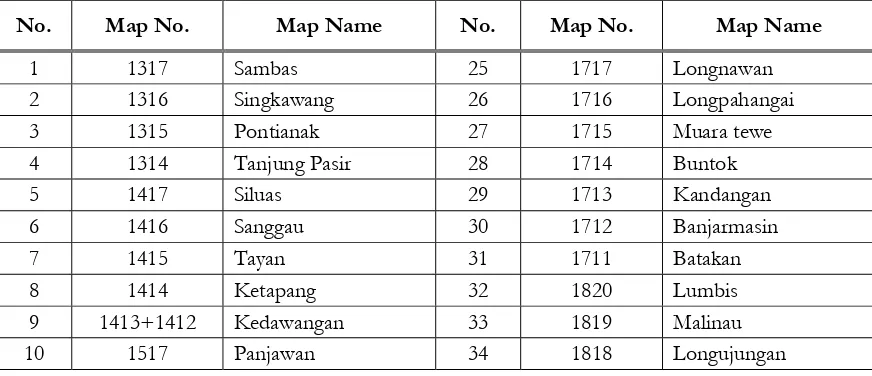
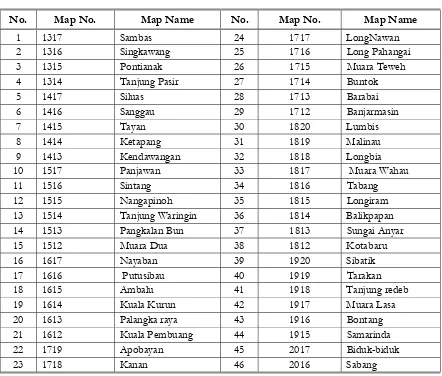
Table 4. RBI maps of Kalimantan used as basic maps for the compilation of the peatland distribution Atlas for Kalimantan
No. Map No. Map Name No. Map No. Map Name
1 1317 Sambas 25 1717 Longnawan
2 1316 Singkawang 26 1716 Longpahangai
3 1315 Pontianak 27 1715 Muara tewe
4 1314 Tanjung Pasir 28 1714 Buntok
5 1417 Siluas 29 1713 Kandangan
6 1416 Sanggau 30 1712 Banjarmasin
7 1415 Tayan 31 1711 Batakan
8 1414 Ketapang 32 1820 Lumbis
9 1413+1412 Kedawangan 33 1819 Malinau
No. Map No. Map Name No. Map No. Map Name
11 1516 Sintang 35 1817 Muarawahau
12 1515 Nanga Pinoh 36 1816 Muaraancalong
13 1514 Tanjung Waringin 37 1815 Tenggarong
14 1513 Pangkalan Bun 38 1814 Balikpapan
15 1512 Tanjung Putting 39 1813 Sungaianyar
16 1617 Nayaban 40 1812 Kotabaru
17 1616 Putusibau 41 1811 Kep. Laut kecil
18 1615 Ambalu 42 1920 P. Sebatik
19 1614 Kualakurun 43 1919 P.Tarakan
20 1613 Palangkaraya 44 1918 Tanjung Selor
21 1612 Kuala Pembuang 45 1917 Muara karangan
22 1718+1718 G. Lemong 46 1916 Sangkulirang
23 1915 Samarinda 47 2017 Biduk-biduk
24 1914 Sambojalama 48 1016 Labuhanbini
3.2.2. Soil and land mapping units scale 1:250,000 for the whole of Sumatra Island, published by Pusat Penelitian Tanah dan Agroklimat (Puslitanak), 1990
These maps were compiled by their publisher (Puslitanak) using remote sensing data (aerial photographs, radar images, Landsat MSS and Landsat TM satellite images) to determine mapping units from each land unit polygon. Using the results obtained from observation and field validation, these were then augmented with information on soil characteristics and other environments existing within the polygon. Soil/land unit distribution boundaries were delineated by analyzing remote sensing data. In these maps, peat swamps are included in the land unit / Physiographical Group “Peat Dome” which is dominated by peat soils (Histosol or Organosol).
In these maps, Peat Dome is classified at level I on the basis of its nutrient content: D.1. denotes eutrophic peat (relatively fertile as it is enriched by sediments) and D.2. oligotrophic peat (nutrient-poor). Level II differentiates by water quality (1: freshwater peat and 2: saltwater peat), and Level III distinguishes on the basis of peat depth (1: <0.5 m, 2: 0.5–2 m, and 3: >2 metres). For example, if the map legend ascribes the Symbol D.2.1.2 to a land unit containing peat, it means that this land is oligotrophic peat dome (D.2), freshwater (1), and that the peat is 0.5 to 2 m thick (2). This data was used as basic information in compiling the 1990 and 2002 peatland distribution maps for Sumatra.
3.2.3. RePPProT Maps
The maps published by RePPProT (Regional Physical Planning Project for Transmigration) that were used included: Present Land Use and Land Status, and Land System and Land Suitability. The main ones used as reference for the peat distribution map of Sumatra (1990) and Kalimantan were the Land System and Land Suitability maps on a scale of 1:250,000. A desk study was made of these maps (80-90% took the form of analysis of remote sensing and other supporting data), supplemented by field verification data (10-20%). These maps, together with geological and soil maps/data, were used as input for the analysis of satellite images in order to identify the distribution of peatlands. However, if while analyzing the image of a particular site it was known for certain (from previous surveys to that area) that the site did in fact comprise peatland, even if this contradicted the RePPProT map, it was identified as peatland. The RePPProT maps used are presented in Table 5, Table 6, and Figure 4.
Figure 4. Landsystem and Land Suitability Map published by RePPProT that were used for
Table 5. LAND SYSTEM AND LAND SUITABILITY MAPS
published by RePPProT, Departemen Transmigrasi, 1986 (Sumatra)
No. Map No. Map Name No. Map No. Map Name
1 0421 Banda Aceh 27 0912 Bengkulu
2 0420 Lhok Kruet 28 0911 Manna
3 0521 Lhok Seumawe 29 1014 Jambi
4 0520 Takengon 30 1013 Palembang
5 0519 Tapak Tuan 31 1012 Lahat
6 0518 Sinabang 32 0714 Muara Siberut
7 0620 Langsa 33 1011 Baturaja
8 0619 Medan 34 1010 Kotaagung
9 0618 Sidikalang 35 1113 Pangkal Pinang
10 0617 Sibolga 36 1112 Tanjung Selapan
11 0719 Tebing Tinggi 37 1111 Menggala
12 0718 Pematang Siantar 38 1110 Tanjung Karang
13 0717 Padang Sidempuan
14 0716 Lubuk Sikaping
15 0715 Padang
16 0818 Bagan Siapi-api
17 0817 Dumai
18 0816 Pakanbaru
19 0815 Solok
20 0814 Ketahun
21 0813 Sungai Penuh
22 0917 Bengkalis
23 0916 Siak Sri Inderapura
24 0915 Rengat
25 0914 Muarabungo
Table 6. LAND SYSTEM AND LAND SUITABILITY MAP
published by RePPProT , Departemen Transmigrasi, 1986 (Kalimantan)
No. Map No. Map Name No. Map No. Map Name
1 1317 Sambas 24 1717 LongNawan
2 1316 Singkawang 25 1716 Long Pahangai
3 1315 Pontianak 26 1715 Muara Teweh
4 1314 Tanjung Pasir 27 1714 Buntok
5 1417 Siluas 28 1713 Barabai
6 1416 Sanggau 29 1712 Banjarmasin
7 1415 Tayan 30 1820 Lumbis
8 1414 Ketapang 31 1819 Malinau
9 1413 Kendawangan 32 1818 Longbia
10 1517 Panjawan 33 1817 Muara Wahau
11 1516 Sintang 34 1816 Tabang
12 1515 Nangapinoh 35 1815 Longiram
13 1514 Tanjung Waringin 36 1814 Balikpapan
14 1513 Pangkalan Bun 37 1813 Sungai Anyar
15 1512 Muara Dua 38 1812 Kotabaru
16 1617 Nayaban 39 1920 Sibatik
17 1616 Putusibau 40 1919 Tarakan
18 1615 Ambalu 41 1918 Tanjung redeb
19 1614 Kuala Kurun 42 1917 Muara Lasa
20 1613 Palangka raya 43 1916 Bontang
21 1612 Kuala Pembuang 44 1915 Samarinda
22 1719 Apobayan 45 2017 Biduk-biduk
23 1718 Kanan 46 2016 Sabang
3.3. SATELLITE IMAGERY
3.3.1. Sumatra
(1) more detailed information on peat depth: the Soil and land mapping units distinguish only between peat that is thicker or thinner than 2m. The atlas details four classes, i.e. shallow peat (50-100 cm), moderate depth (100-200 cm), deep (200–400 cm) and very deep (>400m),
(2) the maturity level for each class of depth: fibrists, hemists, saprists or a combination of these.
To determine the extent and severity of peatland shrinkage, data from two different years were compared. These were the 1990 peat distribution data described above, and data obtained from a survey by WI-IP in 2002, along with data from satellite images. This comparison showed changes in the distribution and depth of peatlands over a period of 12 years. Difficulty in obtaining cloud-free images for 2002 for the whole of Sumatra meant that the images used ranged from 2000 to 2002. The so-called “2002” comprehensive peat distribution for Sumatra therefore actually represents the period 2000-2002.
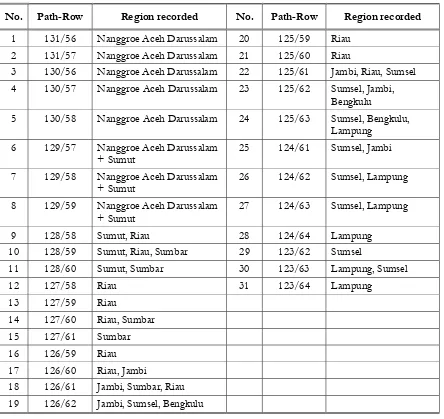
Satellite images used for the 1990s and 2002 peat distribution maps for Sumatra are listed in Table 7 and Figure 5.
Table 7. Satellite Images used to compile Atlas of peatland distribution in Sumatra
No. Path-Row Region recorded No. Path-Row Region recorded
1 131/56 Nanggroe Aceh Darussalam 20 125/59 Riau 2 131/57 Nanggroe Aceh Darussalam 21 125/60 Riau
3 130/56 Nanggroe Aceh Darussalam 22 125/61 Jambi, Riau, Sumsel 4 130/57 Nanggroe Aceh Darussalam 23 125/62 Sumsel, Jambi,
Bengkulu
5 130/58 Nanggroe Aceh Darussalam 24 125/63 Sumsel, Bengkulu, Lampung
6 129/57 Nanggroe Aceh Darussalam + Sumut
25 124/61 Sumsel, Jambi
7 129/58 Nanggroe Aceh Darussalam + Sumut
26 124/62 Sumsel, Lampung
8 129/59 Nanggroe Aceh Darussalam + Sumut
27 124/63 Sumsel, Lampung
9 128/58 Sumut, Riau 28 124/64 Lampung
10 128/59 Sumut, Riau, Sumbar 29 123/62 Sumsel
11 128/60 Sumut, Sumbar 30 123/63 Lampung, Sumsel
12 127/58 Riau 31 123/64 Lampung
13 127/59 Riau
14 127/60 Riau, Sumbar
15 127/61 Sumbar 16 126/59 Riau
17 126/60 Riau, Jambi
18 126/61 Jambi, Sumbar, Riau
19 126/62 Jambi, Sumsel, Bengkulu
3.3.2. Kalimantan
Figure 6. Satellite image used for the peat distribution map in Kalimantan
Table 8. Satellite images used to compile Atlas/maps of peatland distribution in Kalimantan
No. Path-Row Region recorded No. Path-Row Region recorded
1 122/59 Kalbar 21 117/57 Kaltim
2 122/60 Kalbar 22 117/58 Kaltim
3 122/61 Kalbar 23 117/59 Kaltim
4 121/59 Kalbar 24 117/60 Kaltim
5 121/60 Kalabar 25 117/61 Kaltim, Kalteng, Kalsel
6 121/61 Kalbar 26 117/62 Kalsel, kalteng, Kaltim
7 121/62 Kalbar 27 117/63 Kalsel
8 120/59 Kalbar 28 118/62 Kalteng/ kalsel
9 120/60 Kalbar, Kalteng 29 118/63 Kalsel
10 120/61 Kalbar, Kalteng 30 116/58 Kaltim
11 120/62 Kalbar, Kalteng 31 116/59 Kaltim
12 119/59 Kalbar, Kaltim 32 116/60 Kaltim
13 119/60 Kalbar, Kaltim, Kalteng 33 116/61 Kaltim
14 119/61 Kalteng, Kalbar 34 116/62 Kalsel, Kaltim
No. Path-Row Region recorded No. Path-Row Region recorded
3.4. SOIL MAPS AND REPORTS OF SURVEYS AND SOIL MAPPING IN SUMATRA AND KALIMANTAN
Soil maps at exploration level (scale 1:1000,000), reconnaissance soil maps (scale 1:250,000) and detailed reconnaissance soil maps (scale 1:100,000) covering Sumatra and Kalimantan published by Pusat Penelitian Tanah dan Agroklimat were used as reference sources for compiling the Atlases of peat distribution and carbon content in Sumatra and Kalimantan. In addition, information on the analysis of the physico-chemical parameters of soil samples was gleaned from various published reports; these parameters included the C-organic carbon content of the peat soil, and its Bulk Density value (BD). From these (and also peat volume) the size of the carbon store in the peat at each mapping site could be calculated (see analysis in 5.2). A list of the reports used as references for the Atlas of peat distribution and carbon store in Sumatra and Kalimantan is presented in Table 9.
Table 9. Maps and reports/information used as reference for compiling the Atlases of Peat Distribution and carbon store in Sumatra and Kalimantan.
EXPLORATION LEVEL LAND RESOURCE MAPS (Sumatra and Kalimantan)
No Site Year (Ha) Area Map Scale Executor Notes
1 Sumatra (Northern part)
1964 - 1:1.000.000 Balai Penyelidikan
Tanah
Exploration soil ma
2 Sumatra (Southern part)
1964 - 1:1.000.000 Balai Penyelidikan
Tanah
Exploration soil ma
3 P. Bangka 1955 - 1:1.000.000 Balai Penyelidikan
Tanah
Exploration soil ma
4 P. Kalimantan 1993 - 1:1.000.000 Puslittanak Exploration soil ma
5 Kalimantan Barat 1955 - 1:1.000.000 Balai Penyelidikan
Tanah
Exploration soil ma
6 Kalimantan Barat 1971 - 1:1.000.000 Lembaga Penelitian
Tanah
Exploration soil ma
7 Kalimantan Tengah 1960 - 1:1.000.000 Balai Penyelidikan
Tanah
No Site Year Area
(Ha) Map Scale Executor Notes
8 Kalimantan Tengah 1970 - 1:1.000.000 Lembaga Penelitian
Tanah
Exploration soil ma
9 Kalimantan Selatan 1958 - 1:1.000.000 Balai Penyelidikan
Tanah
Exploration soil ma
10 Kalimantan Selatan 1971 - 1:1.000.000 Lembaga Penelitian
Tanah
Exploration soil ma
11 Kalimantan Timur 1955 - 1:1.000.000 Balai Penyelidikan
Tanah
Exploration soil ma
12 Kalimantan Timur 1962 - 1:1.000.000 Lembaga Penelitian
Tanah
Exploration soil ma
13 Kalimantan Timur
(Southern part)
1967 - 1:1.000.000 Balai Penyelidikan
Tanah
Exploration soil ma
RECONNAISSANCE LEVEL LAND RESOURCE MAPS (Sumatra)
No Site Year Area
(Ha) Map Scale Executor Notes
NANGROE ACEH DARUSSALAM PROVINCE
1 Kab. Aceh Utara, Timur, Besar dan Pidie
1987 1.600.000 1:250.000 Puslittan - P2DBT Map & explanatory
booklet
2 Lho'kruet (Lembar
0420)
1990 342.720 1:250.000 Puslittanak –
LREPP
Map & explanatory booklet
3 Banda Aceh (Lembar 0421)
1990 530.100 1:250.000 Puslittanak –
LREPP
Map & explanatory booklet
4 Simeulue (Lembar
0518)
1990 204.102 1:250.000 Puslittanak –
LREPP
Map & explanatory booklet
5 Tapaktuan (Lembar
0519)
1990 724.840 1:250.000 Puslittanak –
LREPP
Map & explanatory booklet
6 Lhok Seumawe
(Lembar 0521)
1990 463.300 1:250.000 Puslittanak –
LREPP
Map & explanatory booklet
7 Langsa (Lembar 0620) 1990 742.246 1:250.000 Puslittanak –
LREPP
Map & explanatory booklet
8 Simpang Ulin
(Lembar 0621)
1990 453.300 1:250.000 Puslittanak –
LREPP
Map & explanatory booklet
9 Takengon (Lembar
0520)
1991 1.796.535 1:250.000 Puslittanak –
LREPP
No Site Year Area
(Ha) Map Scale Executor Notes
PROVINSI SUMATRA UTARA / NORTH SUMATRA PROVINCE
1 Sumatera Utara
antara S.Wampu dan S.Asahan
1970 2.000.000 1:250.000 Lem Penelitian
Tanah
4 Sidikalang (Lembar
0618)
1989 1.506.750 1:250.000 Puslittan – LREPP
5 Pematangsiantar (Lembar 0718)
1989 1.524.750 1:250.000 Puslittan – LREPP
Map & explanatory booklet
6 Nias (Lembar 0616) 1990 402.297 1:250.000 Puslittanak –
LREPP
7 Padangsidempuan (Lembar 0617+0717)
1990 1.169.919 1:250.000 Puslittanak –
LREPP
Map & explanatory booklet
8 Medan (Lembar 0619) 1990 2.128.920 1:250.000 Puslittanak –
LREPP
Map & explanatory booklet
9 Tebing Tinggi
(Lembar 0719)
1990 384.375 1:250.000 Puslittanak –
LREPP
Map & explanatory booklet
PROVINSI RIAU / RIAU PROVINCE
1 Pakanbaru 1957 - 1:250.000 Balai Penyelidikan
Tanah
3 Pakanbaru (Lembar
0816)
1990 1.860.320 1:250.000 Puslittanak -
LREPP
1990 1.882.885 1:250.000 Puslittanak -
LREPP
Map & explanatory booklet
5 Daerah Pasang Surut 1976 375.000 1:200.000 LPT – P4S Reconnaissance soil
map
6 Rengat (Lembar 0915) 1990 1.841.754 1:250.000 Puslittanak -
No Site Year Area
(Ha) Map Scale Executor Notes
8 Bengkalis (Lembar
0917)
1990 366.156 1:250.000 Puslittanak -
LREPP
Map & explanatory booklet
9 Dabo (Lembar 1015) 1990 275.151 1:250.000 Puslittanak -
LREPP
Map & explanatory booklet
10 Tanjungpinang (Lembar 1012)
1990 417.857 1:250.000 Puslittanak -
LREPP
1990 1.112.684 1:250.000 Puslittanak -
LREPP Map & explanatory booklet
2 Sarolangun (Lembar
0913)
1990 1.845.312 1:250.000 Puslittanak -
LREPP Map & explanatory booklet
3 Muarabungo (Lembar
0914)
1990 1.835.734 1:250.000 Puslittanak -
LREPP
Map & explanatory booklet
4 Jambi (Lembar 1014) 1990 1.049.678 1:250.000 Puslittanak -
LREPP Map & explanatory booklet
WEST SUMATERA PROVINCE
Sumbar I (Kodya Padang, Kab. Solok 1
dan Padang Pariaman
1984 942.180 1:250.000 Puslittan Reconnaissance soil
map
1984 1.049.851 1:250.000 Puslittan Reconnaissance soil
map
3 Pagai (Lembar 0713) 1990 206.550 1:250.000 Puslittanak -
LREPP
1990 1.715.073 1:250.000 Puslittanak -
LREPP
Map & explanatory booklet
5 Padang (Lembar
0715)
1990 579.080 1:250.000 Puslittanak -
LREPP
Map & explanatory booklet
6 Lubuk Sikaping
(Lembar 0716)
1990 1.635.735 1:250.000 Puslittanak -
LREPP
Map & explanatory booklet
7 Solok (Lembar 0815 ) 1990 1.841.754 1:250.000 Puslittanak -
LREPP
1986 1.313.100 1:200.000 Puslittan - P3MT Map & explanatory
No Site Year Area
(Ha) Map Scale Executor Notes
2 Bengkulu II
(Kab.Bengkulu Selatan)
1987 585.700 1:250.000 Puslittan - P2DBT Map & explanatory
booklet
3 Ketahun (Lembar
0815)
1990 202.383 1:250.000 Puslittanak -
LREPP
Map & explanatory booklet
4 Manna (Lembar 0910) 1990 685.829 1:250.000 Puslittanak -
LREPP
Map & explanatory booklet
5 Bengkulu (Lembar
0912)
1990 1.709.303 1:250.000 Puslittanak -
LREPP
Map & explanatory booklet
SOUTH SUMATERA PROVINCE
1 Palembang Selatan 1953 250.000 1:250.000 Soepraptohardjo,
M (BPT)
Reconnaissance soil map
2 Sumsel Bagian Selatan 1970 4.000.000 1:250.000 LPT Reconnaissance soil
map
3 P.Bangka 1971 - 1:250.000 LPT Reconnaissance soil
map
4 Toboali (Lembar
1112)
1989 1.121.650 1:250.000 Puslittan - LREPP Map & explanatory
booklet
5 Baturaja (Lembar
1011)
1990 1.821.400 1:250.000 Puslittanak -
LREPP
Map & explanatory booklet
6 Palembang (Lembar
1013)
1990 1.726.715 1:250.000 Puslittanak -
LREPP
Map & explanatory booklet
7 Belitung (Lembar
1213)
1990 483.262 1:250.000 Puslittanak -
LREPP
Map & explanatory booklet
8 Lahat (Lembar 1012) 1991 1.841.870 1:250.000 Puslittanak -
LREPP
1964 250.000 1:250.000 Lembaga Penelitian
Tanah
Reconnaissance soil map
3 Lampung 1968 987.900 1:250.000 Lembaga Penelitian
Tanah
Reconnaissance soil map
4 Rajabasa 1972 - 1:250.000 Lembaga Penelitian
Tanah
Reconnaissance soil map
5 Kotaagung (Lembar
1010)
1989 786.630 1:250.000 Puslittan - LREPP Map & explanatory
booklet
6 Tanjungkarang (Lembar 1110)
1989 717.600 1:250.000 Puslittan - LREPP Map & explanatory
booklet
7 Menggala 1989 1.071.300 1:250.000 Puslittan - LREPP Map & explanatory
RECONNAISSANCE LEVEL LAND RESOURCE MAPS (Kalimantan-Indonesia)
1984 611.696 1:250.000 Puslittan - P3MT Reconnaissance soil
map & report booklet
2 Kalbar II
(Kab.Sanggau dan Pontianak)
1986 762.350 1:250.000 Puslittan Reconnaissance soil
map & report booklet
3 Putussibau, Kab.Kapuashulu
1986 627.500 1:250.000 Puslittan - Sekjen
Dep. Trans
Reconnaissance soil map & report booklet
4 Menjalin WPP V, Kab.Pontianak
1986 90.250 1:250.000 PT.Kern Teknik
Indon - Ditjen
1986 133.800 1:250.000 Gamidacon
Inter.Con - Ditjen
2 Kalimantan Tengah 1981 2.000.000 1:250.000 Orstom Trans.
Project (PTA - 44)
Reconnaissance soil map & report booklet
3 Kuala Jelai WPP IXc, Kab. Kobar
1986 125.000 1:250.000 PT.Karya Eka
Sejahtera - Ditjen
1988 84.375 1:250.000 Puslittan -
PT.Djayanti Djaya
1940 15.000 1:250.000 Razouk Schultz
(BI)
Reconnaissance soil map & report booklet
EAST KALIMANTAN KALIMANTAN
1 Enggalan Empayang
WPP XVIIa, Kab.Kutai
1985 118.264 1:250.000 PT.Desa Contra
Infra - Ditjen
1986 500.000 1:250.000 Puslittan - Sekjen
Dep.Trans
No Site Year Area
(Ha) Map Scale Executor Notes
3 Sasamba (Samarinda,
Sanga-sanga, Muarajawo, Balikpapan)
1998 459.112 1:250.000 Puslittanak Reconnaissance soil
map & report booklet
DETAILED RECONNAISSANCE LEVEL LAND RESOURCE MAP (Sumatra)
No Site Year Area
(Ha) Map Scale Executor Notes
NANGROE ACEH DARUSSALAM PROVINCE
1 Cot Girek 1964 100.000 1:100.000 Badan Koordinasi
Survei Bogor
Soil map & report booklet
NORTH SUMATERA PROVINCE
1 Natal (Tapanuli) 1939 14.000 1:100.000 Van der Voort, M
(BI)
Soil map & report booklet
2 Dairi 1939 46.000 1:100.000 Dames, T.W.C (BI) Soil map & report
booklet
3 Medan 1959 - 1:100.000 Pangudijatno, G
(BPT)
Soil map & report booklet
RIAU PROVINCE
1 Middenstroom gebied
vd S.Rokan Kanan
1941 600.000 1:100.000 Van der Voort, M
(BI)
Soil map & report booklet
2 Aek Natas 1952 70.000 1:100.000 Van der Voort, M
(BI)
Soil map & report booklet
3 Rumbai (Caltex) 1957 - 1:100.000 Soepraptohardjo -
R.Dudal
Soil map & report booklet
Soil map & report booklet
5 Pasir Pangarayan
WPP X, Kab.Kampar
1983 146.600 1:100.000 Faperta UNPAD -
TKTD Cipta Karya PU
Soil map & report booklet
JAMBI PROVINCE
1 Muara Tembesi 1937 2.650 1:100.000 Van Loenen, F.C
(BI)
Soil map & report booklet
2 Tempino 1937 5.375 1:100.000 Van Loenen, F.C
(BI)
Soil map & report booklet
3 Bukit Luncung 1937 7.075 1:100.000 Van Loenen, F.C
(BI)
No Site Year Area
(Ha) Map Scale Executor Notes
4 Rantau Panjang 1937 3.125 1:100.000 Van Loenen, F.C
(BI)
Soil map & report booklet
5 Batang Merangin 1939 132.400 1:100.000 Wentholt, F.A (BI) Soil map & report
booklet 6 Tabib - Air Hitam
gebied
1940 100.000 1:100.000 Van Loenen, F.C
(BI)
Soil map & report booklet
Soil map & report booklet
Soil map & report booklet
3 S.Dasar en S.Megang 1941 4.000 1:100.000 Van der Voort, M
(BI)
Soil map & report booklet
4 Kungku 1942 110.000 1:100.000 Van der Voort, M
(BI)
Soil map & report booklet
5 Komiba Baturaja 1956 20.000 1:100.000 Hardjono (BPT) Soil map & report
booklet
Soil map & report booklet
2 Way Tenong vlake on Omgeving
1940 10.000 1:100.000 Te Hiele, H.J (BI) Soil map & report
No Site Year Area
(Ha) Map Scale Executor Notes
3 Way Sekampung 1942 65.000 1:100.000 Van der Voort, M
(BI)
Soil map & report booklet
1983 495.000 1:100.000 Puslittan - FAO Soil map & report
booklet
DETAILED RECONNAISSANCE LEVEL LAND RESOURCE MAP (Kalimantan Indonesia)
Soil map & report booklet
Soil map & report booklet
Sosok WPP VIIb, Faperta UNPAD -
Ditjen Cipta Karya
Soil map & report booklet
Soil map & report booklet
No Site Year Area
(Ha) Map Scale Executor Notes
2 Riam Talawi WPP Xa, Kab.Kobar
1982 107.200 1:100.000 CV.Tunas Muda
Usaha- Ditjen Pankim Dep. Trans
Soil map & report booklet
Mentangai WPP XVII,
Faperta UNPAD - Ditjen Cipta Karya 3
Kab.Kuala Kapuas & Barito Selatan
1983 215.640 1:100.000
Dep. PU
Soil map & report booklet
4 Sepangsimin WPP
XX,
Kab.Barito Utara
1985 112.712 1:100.000 PT.Mondeal -
Ditjen Pankim Dep.Trans
Soil map & report booklet
Soil map & report booklet
Soil map & report booklet
6 Sebagian Barito Utara & Kapuas
1994 1.000.000 1:100.000 Bappeda Tk.I
Kalteng -
Soil map & report booklet
Soil map & report booklet
3 Delta Pulau Petak 1972 250.000 1:100.000 Soepraptohardjo,
M
Soil map & report booklet
EAST KALIMANTAN PROVINCE
1 Tanjung Plateau 1949 - 1:100.000 Van Soelen, W.J
(BI)
Soil map & report booklet
2 Tenggarong, Kab.Kutai
1983 307.500 1:100.000 Transmigrations
Area development
Soil map & report booklet
3 Mensalong WPP Ib, Kab.Bulungan
1983 182.980 1:100.000 Faperta UNPAD -
Ditjen Cipta Karya PU
Soil map & report booklet
No Site Year Area
Soil map & report booklet
Soil map & report booklet
7 Muara Biawu WPP
XV, Kab.Pasir
1985 98.827 1:100.000 PT.Lenggogeni –
Ditjen Pankim Dep.Trans
Soil map & report booklet
8 Sesayap WPP Ib, Kab.Bulungan
1985 131.320 1:100.000 Pedicinal - Ditjen
Pankim Dep.Trans
Soil map & report booklet
9 Long Iban WPP IV, Kab.Bulungan
1985 121.180 1:100.000 Pedicinal - Ditjen
Pankim Dep.Trans
Soil map & report booklet
Soil map & report booklet
11 Manubar WPP Xg, Kab.Kutai
1985 94.768 1:100.000 PT.Nusa
Consultant - Ditjen Pankim, DepTrans
4. Methods and Steps to determine the
presence of peat, its delineation and
area
For Sumatra, the information to be presented in the Atlas comprises a collection of peat swamp distribution maps for 1990 and 2002.
In compiling the atlas of peat distribution in Sumatra, a variety of available supporting data (such as maps resulting from soil mapping surveys carried out by a number of state and private institutions, including universities) were used as reference. Particularly significant were the supporting data provided by the Soil and Agroclimate Research Centre in Bogor, which published “Peta Satuan Lahan dan Tanah skala 1:250.000” (Soil and Land Mapping Units, scale 1:250,000) together with their explanatory booklet for the whole of Sumatra in 1990. These maps and information were processed and analysed to form the primary source of data for presenting peat distribution maps showing conditions in 1990 (as the input maps had been published in 1990). By analysing this data for 1990 conditions (and also for 2002 conditions, as explained in 3.3.1 above) the dynamics/changes in peat distribution and characteristics over the 12 years from 1990 to 2002 could be determined. The dynamics of these changes covered the following parameters: changes/shrinkage in peatland area, changes in peat thickness (thickness decreased as a result of subsidence and/or fire), changes in land use, loss of the peat layer especially in areas of shallow and very shallow peat (<50 cm) as a result of agricultural use.
The methods and steps used to compile the peatland distribution maps were as described below :
4.1. COLLECT AND STUDY MAPS AND THEIR REPORT BOOKLETS
CONTAINING INFORMATION ON PEAT SWAMP LANDS AND THEIR DISTRIBUTION
4.1.1. Peta Rupabumi Indonesia (Digital) maps scale 1:250,000 published by Bakosurtanal from 1986 to 1990 for the whole of Sumatra
time of mapping (2002), in particular the network of main roads connecting provinces and districts (kabupaten), river networks, coastlines, and urban spread. Coastal plains near river estuaries flowing directly into the sea showed the most dynamic changes/growth as a result of erosion upstream and sedimentation downstream. The main source of data used for updating detailed information was satellite imagery (as explained in 3.3.1 above) and data/information obtained from field studies. Peatland distribution maps were prepared for each province (8 provinces) and for the whole of Sumatra Island by combining and generalising several 1:250,000 scale maps, the final maps being designed for presentation in Ao size format (Ansi E: 34 x 44 inch or 86.4 – 111.75 cm).
Information/sketches of the administrative divisions of each province and kabupaten district in Sumatra were obtained from the map of regional administrative divisions published by Bappenas in 1986. However, as some of these divisions had changed as a consequence of the decentralisation of government, maps bearing updated boundary information were obtained from the local Bappeda office during field visits, while also seeking confirmation and input/suggestions from Bappeda staff in order to complete and perfect the draft peatland distribution maps. A list of the RBI maps of Sumatra is presented in Table 3, and their distribution in Figure 1.
4.1.2. Peta Rupabumi Indonesia (Digital) maps scale 1:250,000 published by Bakosurtanal from 1990 to 2002 for the whole of Kalimantan
Peta Rupabumi Indonesia (Digital) maps on a scale of 1:250,000 were published by Bakosurtanal from 1990 to 2000. For the entire Kalimantan mainland 48 digital RBI/topographic maps were used (Table 2), while maps for islands Padang Tikar and Tanjung Pasir (West Kalimantan) and Pulau Laut were not used as the areas of peatland there were too small to be mappable at a scale of 1:250,000. The digital Rupabumi maps required further editing to accommodate landscape conditions existing at the time of mapping (2002), in particular the network of main roads connecting provinces and districts (kabupaten), river networks, coastlines, and urban spread. Coastal plains near river estuaries flowing directly into the sea showed the most dynamic changes/growth as a result of erosion upstream and sedimentation downstream, especially the Kapuas estuary at Pontianak and the Mahakam estuary at Samarinda, Kaltim. The main source of data used for updating detailed information was satellite imagery (ranging from 2001 to 2002, see explanation in 3.3.2 above) and data/information obtained from field studies. Peatland distribution maps were prepared for each province (4 provinces) and for the entire Indonesian part of Kalimantan Island by combining and generalising several 1:250,000 scale maps, the final maps being designed for presentation in Ao size format (Ansi E: 34 x 44 inch or 86.4 – 111.75 cm).
Bappenas in 1986. However, as some of these divisions had changed as a consequence of the decentralisation of government, maps bearing updated boundary information were obtained from the local Bappeda office during field visits, while also seeking confirmation and input/suggestions from Bappeda staff in order to complete and improve the draft peatland distribution maps. A list of the RBI maps of Kalimantan is presented in Table 2 and their distribution in Figure 2.
4.2. COMPILATION OF BASIC MAP FOR THE PRESENTATION OF PEAT DISTRIBUTION MAPS
To prepare basic maps that would then be used for the presentation of peat swamp land distribution, digital data was processed as follows.
The Peta Rupabumi Indonesia maps from Bakosurtanal are generally presented in mapsheet format (e.g. mapsheet 1713- Kandangan- Kalimantan). This mapsheet for Kandangan covers 2 provinces: Kalimantan Tengah (to the west of the map) and Kalimantan Selatan (to the east). To prepare maps of peat distribution per province, therefore, required the amalgamation of several RBI maps. When joining the edges of these, elements of the landscape, such as roads and rivers, did not match up and the toponomy was even different. In these cases independent data was needed to match and join up these elements, by analysing data from satellite imagery. The process of matching the map sheets and edges was done within the program packet Geographic Information System (GIS), using the ‘editing’ and ‘edge adjustment’ modules; any remaining gaps needed to be joined up through computerised digitation. Several mapsheets were combined into a single unit describing the distribution of peat in one province (generally, 7 to 20 mapsheets of 1:250,000 scale were combined for one province). For handy use, this map was formatted as one mapsheet and presented in hardcopy form size Ao (34 x 44 inches). This entailed generalisation and reformatting. To achieve this and to ensure that the information was understandable to the user, the font sizes, line sizes, geographic coordinates and map title had to be adjusted, which required map layouting.
4.3. COMPILATION OF PEAT MAPS/DATA, PROCESSING, ANALYSIS, EVALUATION, STANDARDISATION OF INFORMATION/SCALE, PRESENTATION IN MAP FORM (MATURITY LEVEL, DEPTH, BD, LAND USE AND DISTRIBUTION)
detecting the existing conditions of the peat swamp lands and their distribution (see Table 8 for a list of reports/maps used as reference).
These maps, together with their legend, explanatory booklet and/or report booklet, contain information on: peat distribution, maturity level, depth/thickness, general chemical properties and fertility. However, as the mapping level varies (depending on the purpose of mapping) the information presented also varies. For example, the information on peat thickness given in one source distinguishes only 2 classes: less than 2 metres and more than 2 metres, while another source classes peat thickness as: Very shallow (<0.5 m) or deep (> 4 m). Such data cannot be used directly as they stand, but nevertheless, peat thickness still needs to be classified. For the purposes of the atlas, this was done as follows. For Sumatra 5 classes of peat thickness are used: <50cm, 50-100cm, 100–200cm, 200–400cm, and >400cm. For Kalimantan, where the peat is deeper/thicker, the classification is into 6 classes: <50cm, 50– 100cm, 100–200cm, 200–400cm, 400-800cm and 800-1200cm or over.
In seeking information on the location and characteristics of peatlands, reference was made to information within the particular site and spot (using geographic co-ordinates). Information, peatland characteristics and soil properties at each site/spot followed those given in the information booklet or legend being used as reference, except that the lines showing distribution boundaries were drawn on the basis of the results obtained from the analysis of satellite imagery.
In order to standardise the maturity levels and BD of the peat, the following approaches were taken.
Alternative 1: First priority was to obtain information on peat maturity level and BD
accompanied by detailed results of their laboratory analysis.
Alternative 2: If the information was not accompanied by detailed laboratory results,
further data was sought from the institution that had carried out the mapping (priority being given to agricultural institutions). The accuracy level of data will be higher where the data was obtained from field surveys carried out by the writer.
Alternative 3: If the information on peat characteristics differed from one reference to
another, the information quoted was the one given in the majority of the sources.
4.4. SATELLITE IMAGERY ANALYSIS TO DETECT PEATLAND DISTRIBUTION
detailed information to be analysed would not contain significant deviations and would correspond closely to the actual conditions in the field. Geometric corrections were made (length, breadth and area) to rectify errors in measurements so that the geometry would match actual field conditions as closely as possible. The reference used was the topographic Rupabumi Indonesia maps ranging in scale from 1:50,000 to 1:250,000 published by Bakosurtanal. The corrections were made by matching up the geographic positions (co-ordinates) on the satellite image to those on the corresponding RBI map. Certain reference points, such as road junctions, river bends and other relatively permanent landmarks were also matched up by super-imposing them onto the same reference point on the RBI map, which was considered to be to correct scale (distance, breadth, area). In this way, once the geometry had been corrected with reference to the topographic maps, the accuracy of scale was then assumed to be the same as that of the reference maps used to correct them.
Image enhancement was carried out to ensure that the image appearance /performance would as far as possible match actual field conditions, thereby minimising deviations in the analysis and interpretation of information related to the characteristics and distribution of peat swamp lands. Image enhancement is the process of removing deviations that occurred at the time when the data was recorded by the satellite, as a result of weather disturbances, haze, effects due to the earth’s rotation and satellite movements, and so on.
Analysis of the presence and distribution of peat swamp land was carried out as follows:
1. Using reference soil maps resulting from mapping surveys performed by trusted institutions (Puslitanak, IPB, UGM, PU and others).
For a map to be used as reference, it was a prerequisite that it should be accompanied by a detailed laboratory analysis of soil samples, detailed information about the site/location where each soil sample was taken, and an analysis of its morphology. In compiling the peat distribution atlas, soil maps that lacked information on soil sample analysis results, sampling sites and morphology were not used as reference.
2. Analysis using ‘Crop community’ as a spectral signature.
3. Analysis of peat distribution and characteristics by extrapolation.
Parameters that can be investigated from images as explained in 1 and 2 above include: tone, texture, performance and spectral signature that appear on the image of each site. The results thus obtained can then be used as a reference to identify the distribution of peat having the same characteristics and performance in other areas on the scene or satellite image sheet (extrapolation approach).
4.5. COMBINATION OF DATA ON PEATLAND BIO-PHYSICO-CHEMICAL CONDITION OBTAINED FROM THE LITERATURE STUDY WITH THOSE ON DISTRIBUTION, DEPTH AND LAND-USE TYPE
OBTAINED FROM SATELLITE IMAGE ANALYSIS
This section will discuss the stages in the production of the draft basic 1:250,000 scale Map of peatland characteristics drawn by combining the results of the literature study and satellite image analysis. The stages were as follows:
1. The basic map (using UTM projection) is used to present spatial information resulting from satellite image analysis (satellite image projections were synchronized when geometric corrections were being made). This information comprises peatland distribution according to depth, classified over a range of 6 classes: 50cm, 50–100cm, 100–200cm, 200-400cm, 400–800cm, and >800cm).
2. After the results of the satellite image analysis had been entered onto the basic map (scale and projection having been synchronized and corrected), information from the literature study (such as: peat maturity level, carbon content and BD) was then entered onto each polygon or mapping unit, with reference to the site/geographic position on the basic map. Some polygons remained unfilled where the data was incomplete or no survey or mapping had yet been carried out.
4.6. GROUND TRUTHING
4.6.1. Aims
• To check the truth and accuracy of the satellite image analysis/interpretation of peat
distribution and depth (to validate qualitative information so that it could be converted into quantitative information)
• To monitor and check the truth of information on peat maturity level in the literature as
4.6.2. Validation points & constraints encountered
In deciding on the sites and routes for ground-truthing and on the intensity of field monitoring, the following were taken into consideration:
• The number of teams and the effective number of ground-truthing days
• Ideally, each mapping unit should be visited and monitored in the field; if the polygon is
considered large, monitoring should be performed at more than one site within it
• The monitoring route should represent several classes of peat depth and maturity
• The monitoring route should give priority to areas where data is limited, but should also
include some transects representing areas that do have data in order to check the accuracy of the data collected.
4.6.3. Intensity of field monitoring (number of monitoring points and level of accuracy)
The intensity of field monitoring (number of monitoring points and level of accuracy) depends on the map scale required. Ideally, according to the principles of ground based mapping, peat swamp land distribution mapping should include a minimum size delineation of 0.4cm2 (Buurman and T.Balsem, 1990). This minimum is for all scales of mapping. Thus, on a peat distribution map scale 1:100,000 the minimum information size that can be presented is 40ha. Ideally, therefore, each monitoring site should represent detailed information for a minimum of 40ha. For a 1:250,000 scale map, the monitoring site should represent 250 ha., while for a 1: 1 million scale map each site should represent an area of 4,000 ha.