The Impact of After-sales Service Quality on Customer Satisfaction
and Customer Loyalty of Middle-upper Class Landed Housings
Didik Wahjudi1*,Timoticin Kwanda2, Rianthi Sulis3
Abstract: Nowadays, good products are not sufficient. The market competition requires an excellent after-sales service. After-sales service quality has been identified as a source of revenue and competitive advantage. While other industry sectors have readily paid attention to after-sales service quality, little study has been done on the effectiveness of after-after-sales service quality in the field of landed housings. This study aims to explore the relationship among after-sales service quality, customer satisfaction, and customer loyalty. Especially, we want to confirm the impact of after-sales service quality on customer satisfaction and customer loyalty of middle-upper class landed housings in Surabaya. This research was conducted by a survey on 170 respondents from four housing complexes in Surabaya, i.e. Pakuwon City, Citraland, Bukit Darmo Golf, and Graha Family. The data was examined by using structural equation modeling (SEM). Through data analysis, we confirm the positive correlation between after-sales service quality and customer satisfaction, the positive correlation between customer satisfaction and customer loyalty, and the direct and indirect relationships between after-sales service quality and customer loyalty. The practical implication of this study provides assurance to landed housing management on the effectiveness of after-sales service quality in maintaining old customers and encouraging new consumers.
Keywords: After-sales service quality; customer satisfaction; customer loyalty; middle-upper class landed housing.
Introduction
The importance of after-sales service quality has been widely recognized in all industry sectors, not only in pure service sectors but also in sectors where service is considered as a part of an augmented product (Rigopoulou et al. [1]). Furthermore, Rigopoulou et al. [1] identify the ever-increasing relative significance of the after-sales service quality to the core products/services as a part of differentia-tion strategy. Several studies claim the reladifferentia-tionship between after-sales service quality, customer satis-faction, customer loyalty, and profitability (Anderson and Mittal [2]). Existing studies find a significant influence of after-sales service quality on customer satisfaction and customer loyalty. Customer loyalty occurs only when the customers are delighted with the products/services (Yang and Peterson [3]). Excel-lent after-sales service quality not only affects the retention of existing customers and but also increases the number of new customers (Anderson et al. [4]).
1 Faculty of Industrial Technology, Mechanical Engineering
Depart-ment, Petra Christian University, Jl. Siwalankerto 121-131, Sura-baya 60236, INDONESIA. Email:[email protected]
2 Faculty of Civil Engineering and Planning, Architecture
Depart-ment, Petra Christian University, Jl. Siwalankerto 121-131, Sura-baya 60236, INDONESIA. Email: [email protected]
Email: [email protected]
3 Faculty of Civil Engineering and Planning, Civil Engineering
Mas-ter Program, Petra Christian University, Jl. Siwalankerto 121-131, Surabaya 60236, INDONESIA. Email: [email protected] * Corresponding author
Satisfied customers are more likely to recommend the products/services to other customers, have greater repurchase intentions, and make actual repurchase action (Anderson and Mittal [2]).
Methods
product (Fazlzadeh et al. [5]). After-sales service is a means to provide benefits to customers and create a business opportunity for the company (Saccani et al., [6]). After-sales service is generally utilized in a manufacturing industry. Manufacturing firms strive to meet customer needs with product design, com-prehensive product offerings, consumer support, and after-sales service (Lele [7]). In the landed housing field, after-sales service can be in the form of (a) maintenance (the work required to keep or maintain a building at a good level), (b) alteration (develop-ment of facilities that makes the building more suitable for today's use, (c) conversion (provision of new facilities or re-arrangement of internal space for the compatibility of new uses).Parasuraman et al. [8] identify five dimensions of service quality, i.e. tangible, reliability, responsive-ness, assurance, and empathy. Tangible is about the outlook of physical facilities, equipment, staff, and communication materials. Reliability represents the capacity to fulfill stated service responsibly and faithfully. Responsiveness describes the readiness of staff to assist customers and offer reliable service. Assurance measures the competence and politeness of staff and the capability to create trust and confi-dence. Empathy indicates an attentive and persona-lized concern to customers. This study adopted constructs proposed by Parasuraman et al. [8] to measure the five dimensions of after-sales service quality.
Customer Satisfaction
Existing studies identify two concepts of customer satisfaction, i.e. transaction-specific customer satis-faction and cumulative customer satissatis-faction. Tran-saction-specific customer satisfaction refers to an evaluation over a specific purchase transaction, while cumulative customer satisfaction represents evaluation based on the total purchase and usage of goods or services over time (Anderson et al. [4]). This study adopted the cumulative customer satisfaction because it aimed to measure the overall satisfaction of customers over a quite long time period.
Many studies utilize the single scale to measure satisfaction using scale 1 to 5 or 1 to 7, where 1 = very dissatisfied and 5 or 7 = very satisfied. However, this simple measurement does not repre-sent the com-plexity of customer of satisfaction because customer satisfaction is behavior and
emotion that cannot be measured directly (Fornell et al. [9]). This study adopted five-scale construct proposed by Fornell et al. [9] appended by two items from Gorondutse and Hilman [10] and Ndubisi and Wah [11] to measure customer satisfaction.
Customer Loyalty
Customer loyalty has been identified as the promi-nent source of competitive advantage (Khan [12], Lin and Wang [13]). The literature identifies different kinds of customer loyalty. At first customer loyalty is assumed to comprise of behavioral loyalty only (Rauyruen et al. [14]). Behavioral loyalty is defined as readiness to make a repeat purchase from or maintain an association with a company (Khan [12]). Later on, some authors come with the idea of attitudinal loyalty, which is described as emotional attachment to the company, provision of positive word of mouth, and recommendation to use its product/service (Khan, [12], Rauyruen et al.[14]. Gremler and Brown [15] propose another kind of loyalty, cognitive loyalty. Cognitive loyalty is characterized as considering no other alternatives when there is a need to make a decision as to what or where to buy product/service (Gremler and Brown [15]). Rauyruen et al. [14] recommend the use of composite loyalty that combines behavioral and attitudinal loyalty. They argue that when a purchase decision is made it is difficult to distinguish whether that decision is supported by behavioral or attitudinal loyalty. This study adopted the concept of composite loyalty proposed by Rauyruen et al. [14]. The customer loyalty construct was operationalized as willingness to recommend product/service of the company (Gorondutse and Hilman [10]), considering to purchase product/service from the company as the first choice (Gorondutse and Hilman [10]), price tolerance (Gorondutse and Hilman [10]), desire to build a long-term relationship with the company (Gorondutse and Hilman [10]), willingness to provide feedback to the company (Gorondutse and Hilman [10]), pride of the product’s premium or prestigious value (Rauyruen et al. [14]).
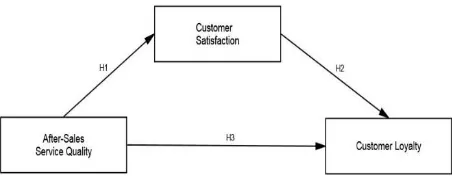
Development of Theoretical Framework
Figure 1. The conceptual framework
Customer satisfaction is identified to be one key factor that affects customer loyalty (Gorondutse and Hilman [10], Khan [12], Lin and Wang [13], Rauyruen et al. [14] Aktepe et al. [17]). Loyalty level can be measured through the length of the relation-ship between producer and customer. The more satisfied is the customer, the longer the relationship will be. Aktepe et al. [17] identify very satisfied customers are the best customer group and a tar-geted customer group because they share their satisfaction with other customers.
After-sales service quality is reported to have a strong influence on customer loyalty, either directly or indirectly through customer satisfaction. Zeithaml et al. [17] identify the direct and indirect links between service quality and customer loyalty, while Gorondutse and Hilman [10] and Parasuraman et al. [8] only find the indirect impact of service quality on customer loyalty through customer satisfaction. They do not find a significant direct link between service quality and customer loyalty.
Based on the above discussion, we developed the following hypotheses:
H1: After-sales service quality is positively correlated
with customer satisfaction of middle-upper class landed housing companies in Surabaya.
H2: Customer satisfaction is positively correlated
with customer loyalty of middle-upper class landed housing companies in Surabaya.
H3: After-sales service quality is positively correlated
with customer loyalty of middle-upper class landed housing companies in Surabaya.
Thus, the conceptual framework of this study is presented in Figure 1.
Sample and Procedures
The target population of this research was residents of middle-upper class housing complexes in Sura-baya. These houses were built on a plot of land of 200-600 m2 and 600-2000 m2, with supporting
operational facilities and infrastructure such as sports centers, parks, playgrounds, conference build-ings, shopping centers, and even recreational faci-lities. The four middle-upper class housing complex
surveyed were Pakuwon City, Citraland, Bukit Darmo Golf, and Graha Family. We utilized convenience sampling method to obtain responses because we did not have access to every resident of those complexes.
One hundred seventy respondents participated in the survey by completing the questionnaires. These respondents were asked to complete 34 indicators of the seven constructs using a five-point Likert scale, where 1 = strongly disagree and 5 = strongly agree. Five constructs were part of after-sales service qua-lity, and one construct each for customer satisfaction and customer loyalty.
Results and Discussions
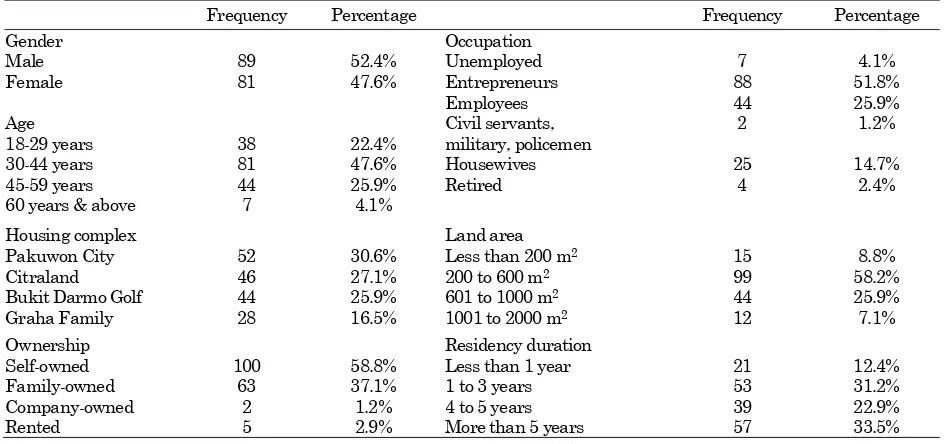
Table 1 provides the demography of respondents. Based on the respondents' demographic data, it was found that the largest portion of respondents was from Pakuwon City (East Surabaya) and Citraland (West Surabaya) housing complexes, with the largest age group was 30-44 years, and the largest owner-ship status was self-owned property. There were some respondents that owned houses smaller than 200 m2 in land area, but we still included them in
our analysis because they enjoyed the same facilities and services with the remaining respondents.
Prior to the analysis, we conducted data screening as recommended by Hair et al. [19]. Data screening using SPSS software revealed no missing data. Next, data were examined for the existence of univariate and multivariate outliers. For detection of univariate outliers, cases that have |z| value greater than 4.0 were considered outliers (Hair et al. [19]). We found no case that had |z| value greater than 4.0, so all cases were retained. Multivariate outliers were identified using Mahalanobis distance (D2) divided by the number of variables. A conservative p-value of 0.001 recommended by Hair et al. [19] was used to identify multivariate outlier cases. This assessment detected 3 cases (#64, 78, and 139) to be multivariate outliers and they were excluded from further ana-lysis.
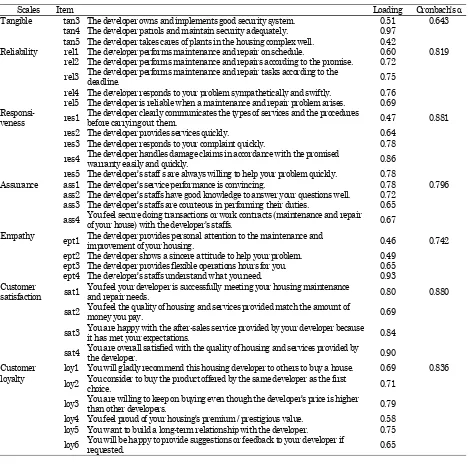
Measurement Model
Out of six indicators of the initial tangible dimension of after-sales service quality, only three of them were retained. Indicators tan1, tan2, and tan6 were removed because of low factor loadings, 0.35, 0.25, and 0.23, respectively. These three indicators, namely developer maintains residential road very well (tan1), developer maintains cleanliness, picks up, and manages waste properly (tan2), and developer maintains residential facilities such as clubhouse and sports areas regularly (tan6), may be considered as basic services so that they only have weak influence on the overall after-sales service quality assessment by the housing residents. The remaining items are shown in Table 2. All models showed good fit satisfying measures recommended by Hair et al. [19], i.e. models with number of observed variables less than 12 and number of observations of less than 250 to have CMIN/DF ≤ 3,
CFI ≥ 0.97, RMSEA ≤ 0.08, and SRMR ≤ 0.08.
We developed three measurement models (i.e. after-sales service quality, customer satisfaction, customer loyalty) in the confirmatory factor analysis (CFA). The five dimensions of after-sales service quality were reduced into a construct of after-sales service quality through the CFA. This process aimed to reduce the number of variables to a manageable number while maintaining the characteristics of the original variables (Hair et al. [19]). The hypotheses were verified by using composite scores in the structural model. The use of composite score is considered to be superior to the summated scale because composite scores represent all variable loading on the factor (Hair et al. [19]).
Figure 2. The second-order measurement model of ASSQ
After-sales service quality (ASSQ) had initially five 5 dimensions, namely tangible, reliability, responsive-ness, assurance and empathy. However, during the data reduction, it was found that tangible had a small factor loading (0.32) on ASSQ. The small value of factor loading of tangible dimension in this study was possibly due to it was no longer a performance factor, but it had become a basic factor (Anderson and Mittal, [2]). In other words, tangible dimension did not make any difference in these middle-upper class landed housings because the four landed housing management had taken care of this tangible dimension. However, it would cause dissatisfaction if it did not exist (Wang and Ji [21]). Tangible dimension is also found to have small value by Berry et al. [22]. In that study, Berry et al. [22] ask 1900 respondents regarding the quality of after-sales service of 5 leading companies in America. They find that out of 5 dimensions of ASSQ, tangible has the smallest contri-bution, i.e. only 11%. Thus, tangible was not included in the second-order measurement model of ASSQ, that is presented in Figure 2. The model fit of the second-order measurement model satisfied the model fit measures recommended by Hair et al. [19]. However, the reliability was a little bit below the recommended value of 0.7.
Table 1. Demography of respondents
Frequency Percentage Frequency Percentage
Gender Occupation
Male 89 52.4% Unemployed 7 4.1%
Female 81 47.6% Entrepreneurs 88 51.8%
Employees 44 25.9%
Age Civil servants, 2 1.2%
18-29 years 38 22.4% military, policemen
30-44 years 81 47.6% Housewives 25 14.7%
45-59 years 44 25.9% Retired 4 2.4%
60 years & above 7 4.1%
Housing complex Land area
Pakuwon City 52 30.6% Less than 200 m2 15 8.8%
Citraland 46 27.1% 200 to 600 m2 99 58.2%
Bukit Darmo Golf 44 25.9% 601 to 1000 m2 44 25.9%
Graha Family 28 16.5% 1001 to 2000 m2 12 7.1%
Ownership Residency duration
Self-owned 100 58.8% Less than 1 year 21 12.4%
Family-owned 63 37.1% 1 to 3 years 53 31.2%
Company-owned 2 1.2% 4 to 5 years 39 22.9%
The Cronbach’s alpha of this second-order measure-ment model was 0.632.
Structural Model
Following the completion of measurement models, a path diagram was developed to examine the media-ting effect of customer satisfaction on the relation-ship between ASSQ and customer loyalty. There were five control variables that we tested in our structural model, i.e. age, occupation, housing com-plex, ownership, and residency duration. However, none of them exhibited significant effects on custo-mer loyalty. Hence, we did not include these control variables in the final model. The model fit indicated satisfactory results satisfying the model fit measures
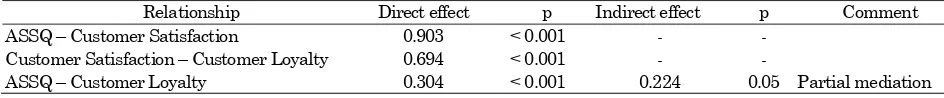
recommended by Hair et al. [19]. The path diagram of all variables is presented in Figure 3. ASSQ was positively correlated with customer satisfaction with standardized regression weight (β) = 0.903 and p < 0.001. Customer satisfaction was also positively correlated with customer loyalty with standardized regression weight (β) = 0.694 and p < 0.001. In the presence of customer satisfaction, the direct effect of ASSQ on customer loyalty was significant (β = 0.304 and p = 0.001). Thus, all hypotheses (H1, H2, and H3)
were confirmed. The indirect effects of ASSQ on customer loyalty through customer satisfaction was significant with standardized regression weight (β) = 0.224 and p = 0.05. It can be inferred that the effects of ASSQ on customer loyalty was partially mediated by customer satisfaction.
Table 2. Scale validity and reliability of five dimensions of ASSQ, customer satisfaction, and customer loyalty
Scales Item Loading Cronbach's α
Tangible tan3 The developer owns and implements good security system. 0.51 0.643 tan4 The developer patrols and maintain security adequately. 0.97
tan5 The developer takes cares of plants in the housing complex well. 0.42
Reliability rel1 The developer performs maintenance and repair on schedule. 0.60 0.819 rel2 The developer performs maintenance and repairs according to the promise. 0.72
rel3 The developer performs maintenance and repair tasks according to the
deadline. 0.75
rel4 The developer responds to your problem sympathetically and swiftly. 0.76 rel5 The developer is reliable when a maintenance and repair problem arises. 0.69 Responsi-
veness res1
The developer clearly communicates the types of services and the procedures
before carrying out them. 0.47 0.881
res2 The developer provides services quickly. 0.64
res3 The developer responds to your complaint quickly. 0.78 res4 The developer handles damage claims in accordance with the promised
warranty easily and quickly. 0.86
res5 The developer's staff s are always willing to help your problem quickly. 0.78
Assurance ass1 The developer's service performance is convincing. 0.78 0.796 ass2 The developer's staffs have good knowledge to answer your questions well. 0.72
ass3 The developer's staffs are courteous in performing their duties. 0.65 ass4 You feel secure doing transactions or work contracts (maintenance and repair
of your house) with the developer's staffs. 0.67
Empathy
ept1 The developer provides personal attention to the maintenance and
improvement of your housing. 0.46 0.742
ept2 The developer shows a sincere attitude to help your problem. 0.49 ept3 The developer provides flexible operations hours for you. 0.65 ept4 The developer's staffs understand what you need. 0.93 Customer
satisfaction sat1
You feel your developer is successfully meeting your housing maintenance
and repair needs. 0.80 0.880
sat2 You feel the quality of housing and services provided match the amount of
money you pay. 0.69
sat3 You are happy with the after-sales service provided by your developer because
it has met your expectations. 0.84
sat4 You are overall satisfied with the quality of housing and services provided by
the developer. 0.90
Customer loyalty
loy1 You will gladly recommend this housing developer to others to buy a house. 0.69 0.836 loy2 You consider to buy the product offered by the same developer as the first
choice. 0.71
loy3 You are willing to keep on buying even though the developer's price is higher
than other developers. 0.79
loy4 You feel proud of your housing's premium / prestigious value. 0.58 loy5 You want to build a long-term relationship with the developer. 0.75 loy6 You will be happy to provide suggestions or feedback to your developer if
Discussion of Findings
This study aims to explore the relationships among after-sales service quality (ASSQ), customer satis-faction, and customer loyalty. To the best of our knowledge, this is the first study that explores the relationship between after-sales service quality and customer loyalty in the real estate field. There are three main findings from this study. First, the results of this study indicate that after-sales service quality is positively correlated with customer satisfaction of middle-upper class landed housing companies. This result is in line with the finding of Rigopoulou et al. [1], which confirms that ASSQ influences the value perceived by customers of electrical appliances. This finding also confirms the finding of Fazlzadeh et al. [5] that argues customer satisfaction is strongly influenced by the after-sales service quality. Second, this study identifies that customer satisfaction has positive impacts on consumer loyalty of middle-upper class landed housing companies. This finding supports the claim of several authors such as Bodet [23], Gorondutse and Hilman [10], Khan [12], Lin and Wang [13], and Rauyruen et al. [14] that there is a positive relationship between customer satisfaction and customer loyalty. Third, the finding of this study confirms the relationship between after-sales service quality and customer loyalty, both directly and indirectly through customer satisfaction. This result is also in accordance with previous research con-ducted by Zeithaml et al. [18] that identify the evidence of relationship among after-sales service quality, customer satisfaction, and customer attitude. Customers that do not have service issues have the strongest level of loyalty. However, Gorondutse and Hilman [10] and Parasuraman et al. [8] claim that the impact of after-sales service quality on customer loyalty can only be accomplished
through customer satisfaction. In other words, they argue that there is no direct link between after-sales service quality and customer loyalty.
Conclusion
There are limited studies on service quality in real estate field especially on landed housings, unlike in the manufacturing field. Through this study, some relationships that are identified in other fields are confirmed. All three proposed hypotheses are con-firmed, i.e. the relationship between after-sales ser-vice quality and customer satisfaction, the relation-ship between customer satisfaction and customer loyalty, and the relationship between after-sales service quality and customer loyalty, either directly and indirectly. This study provides practical implyca-tions to landed housing management that they need to pay more attention to their after-sales service quality because good services generate satisfied and loyal customers. These loyal customers are more likely to make repeat purchase and provide a positive recommendation on their products/services.
There are some research limitations in this study. First, we were constrained to use convenience sam-pling technique because we did not have access to every resident of the four housing complexes. The second limitation is that not every middle-upper class landed housing in Surabaya was surveyed, for example, Pakuwon Indah housing complex in West Surabaya. Further research may consider to include cultural factors as mediating variables because cul-tural factors also affect consumer behavior (Solomon [24]). The other recommendation is to examine the moderating effect of residency duration on the rela-tionship among after-sales service quality, customer satisfaction and customer loyalty.
Figure 3. Path diagram of all variables
Table 1. Table of Effect Estimates and their p-values
Relationship Direct effect p Indirect effect p Comment ASSQ – Customer Satisfaction 0.903 < 0.001 - -
Customer Satisfaction – Customer Loyalty 0.694 < 0.001 - -
References
1. Rigopoulou, I. D., Chaniotakis, I. E., Lympero-poulos, C. and Siomkos, G. I., After-sales Service Quality as an Antecedent of Customer Satis-faction: The Case of Electronic Appliances. Mana-ging Service Quality: An International Journal, 18, 2008, pp. 512-527.
2. Anderson, E. W. and Mittal, V., Strengthening the Satisfaction-profit Chain, Journal of Service Research, 3, 2000,pp. 107-120.
3. Yang, Z. and Peterson, R. T., Customer Perceived Value, Satisfaction, and Loyalty: The Role of Switching Costs. Psychology & Marketing, 21, 2004, pp. 799–822.
4. Anderson, E. W., Fornell, C. and Lehmann, D. R., Customer Satisfaction, Market Share, and Profitability: Findings from Sweden. Journal of Marketing, 58, 1994, pp. 53-66.
5. Fazlzadeh, A., Bagherzadeh, F. and Mohamadi, P., How after-Sales Service Quality Dimensions Affect Customer Satisfaction, African Journal of Business Management, 5, 2011, pp. 7658-7664. 6. Saccani, N., Johansson, P. and Perona, M.,
Con-figuring the After-sales Service Supply Chain: A Multiple Case Study. International Journal of Production Economics, 110, 2007, pp. 52-69. 7. Lele, M. M., After-sales Service Necessary Evil or
Strategic Opportunity? Managing Service Quali-mer Satisfaction Index: Nature, Purpose, and Findings. Journal of Marketing, 60,
1996, pp.
7-18.10.Gorondutse, A. H. and Hilman, H., Mediation Effect of Customer Satisfaction on the Relation-ships between Service Quality and Customer Loyalty in the Nigerian Foods and Beverages Industry: Sobel Test Approach. International Journal of Management Science and Engineering Management, 9, 2014, pp. 1-8.
11.Ndubisi, N. O. and Wah, C. K., Factorial and Discriminant Analyses of the Underpinnings of Relationship Marketing and Customer Satis-faction, International Journal of Bank Marketing, 23, 2005, pp. 542-557.
12.Khan, I., Impact of Customers Satisfaction and Customers Retention on Customer Loyalty. Inter-national Journal of Scientific & Technology Research, 1, 2012, pp. 106-110.
13.Lin, H.-H. and Wang, Y.-S., An Examination of the Determinants of Customer Loyalty in Mobile Commerce Contexts. Information & Manage-ment, 43, 2006, pp. 271-282.
14.Rauyruen, P., Miller, K. E. and Barrett, N. J., Relationship Quality as a Predictor of B2b Customer Loyalty. Journal of Business Research, 60, 2007, pp. 21-31.
15.Gremler, D. D. and Brown, S. W., Service Loyal-ty: Its Nature, Importance, and Implications. In: Edvardsson, B., Brown, S. W., Johnston, R. and Scheuing, E. E. (eds.) Advancing Service Quality: A Global Perspective. Jamaica, NY: International Service Quality Association, 1996.
16.Ahn, J. S. and Sohn, S. Y., Customer Pattern Search for after-Sales Service in Manufacturing. Expert Systems with Applications, 36, 2009, pp. 5371–5375.
17.Aktepe, A., Ersöz, S. and Toklu, B., Customer Satisfaction and Loyalty Analysis with Classifica-tion Algorithms and Structural EquaClassifica-tion Model-ing, Computers & Industrial Engineering, 86, 2015, pp. 95-106.
18.Zeithaml, V. A., Berry, L. L. and Parasuraman, A.
,
The Behavioral Consequences of Service Qua -lity. Journal of Marketing, 60,1996, pp.
31-46. 19.Hair, J. F., Jr., Black, W. C., Babin, B. J. andAnderson, R. E., Multivariate Data Analysis, Up-per Saddle River, NJ, Pearson Prentice Hall, Customer Needs through Quantitative Analysis
of Kano’s Model. International Journal of Quality & Reliability Management, 27, 2010, pp. 173-184. 22.Berry, L. L., Parasuraman, A., Zeithaml, V. A., Adsit, D., Hater, J., Vanetti, E. J. and Veale, D. J., Improving Service Quality in America: Lessons Learned. The Academy of Management Executive, 8, 1994, pp. 32-52.
23.Bodet, G., Customer Satisfaction and Loyalty in Service: Two Concepts, Four Constructs, Several Relationships, Journal of Retailing and Con-sumer Services, 15, 2008, pp. 156–162.