FACTORS AFFECTING THE COST OF DEBT
IN COMPANIES LISTED WITHIN KOMPAS 100
Muhamad Septian
1; Rosinta Ria Panggabean
21PT Dipostar Finance, Jl. Asia Afika No. 8, Jakarta Selatan, DKI Jakarta, 10270, Indonesia
2 Accounting and Finance Department, Faculty of Economic and Communication, Bina Nusantara University, Jln. K.H. Syahdan No 9, Jakarta Barat, DKI Jakarta, 11480, Indonesia
[email protected]; [email protected]
Received: 26th June 2015/ Revised: 9th November 2015/ Accepted: 11th April 2016
How to Cite: Septian, M., & Panggabean, R. R. (2016). Factors Affecting the Cost of Debt in Companies Listed Within Kompas 100. Binus Business Review, 7(1), 17-25.
http://dx.doi.org/10.21512/bbr.v7i1.1439
ABSTRACT
Article aimed to determine the effect of Good Corporate Governance (GCG) which was proxied through the proportion of independent commissioners, managerial ownership, institutional ownership, quality audits, and family ownership on the cost of debt. The objects of this study were companies listed in Kompas 100 from the period of August 2013-January 2014. The method used to take samples of the study applied purposive sampling method. Data analysis methods used were descriptive statistics, the classical assumption test, and hypotheses test. Based on the results of hypothesis testing that performed by using multiple regression analysis at the 0.05 significant level, the results of this study prove that the proportion of independent commissioners has a significant negative effect on the cost of debt. Also, managerial ownership has a significant positive effect on the cost of debt. On the other hand, institutional ownership, quality audits, and family ownership have no significant effect the cost of debt.
Keywords:cost of debt, independent commissioner, managerial ownership, institutional ownership, audit quality
INTRODUCTION
The structure of companies’ capital generally consists of equity and debt. To obtain such capital, there are costs associated with the acquisition and compensation to the provider of capital, in long term and short term. All of which that should be included in management’s judgment in every financing decision. Each type of financing raises economic costs for the company. The cost of capital is closely related to the level of profit that is implied (required rate of return). From the perspective of investors, the level of required rate of return is the profit level that indicates the risk level of assets owned. Meanwhile, for the company, the amount of required rate of return is the cost of capital to be issued to raise capital.
Companies must grow and develop, so as to fulfil the obligation, among others, to pay debts to creditors, both the principal and the interest on the debt. However, if the company cannot meet its obligations then the company is declared insolvent
or bankrupt (Bodie et al., 2008). In Indonesia, an example of a company that went bankrupt because unable to pay the debt is PT Metro Batavia (Batavia Air). Batavia Air is declared bankrupt by the decision No. 77 of the bankruptcy. Batavia Air is unable to pay debts to creditors, the International Lease Finance Corporation (ILFC) worth 4.68 million US dollars maturing December 13, 2012. ILFC filed a summons or warning to Batavia Air for not making a payment. However, Batavia Air still cannot pay its debts. So that ILFC filed a bankruptcy lawsuit against Batavia Air in the Central Jakarta District Court (Yuniar, 2013).
Based on those cases, the problem occurs when the management is not able to pay its obligations, resulting in the transfer of ownership of assets from shareholders to creditors. In the contract on the debt are agency problems between shareholders, management, and creditors. Management has an obligation to repay the principal along with the interest to creditors who have a claim on the assets of the company. However, management is also contracted by shareholders to be
Binus Business Review, 7(1), May 2016, 17-25 DOI: 10.21512/bbr.v7i1.1439
able to provide returns or dividends to shareholders. In addition, the loan agreement also regulates the maximum dividend to be distributed to the shareholders that the ownership structure is maintained to enhance the growth of companies and to guarantee the return to creditors (Ross et al., 2008).
To minimize the agency problem requires a
mechanism to increase the confidence of third parties.
Creditors, the providers of funds, have the need to ensure the loaned funds will be used properly and
efficiently by the debtor. It can be caused by the
asymmetry of information which the creditor has limitations for information and company performance (Ross et al., 2008). Therefore, it needs a mechanism to accommodate the interests of all stakeholders, namely corporate governance.
Corporate governance can be defined as a set of
rules governing the relationship between shareholders and managers, governments, employees and holders of other internal and external interests relating to their rights (FCGI, 2001). Corporate governance is applied to improve the performance and accountability of the company to optimize shareholder value in the long-term by taking into account the interests of other stakeholders and based on the values of ethics and laws and regulations in force.
Corporate governance in Indonesia began to be noticed by the public after the monetary crisis in 1999 when many companies went bankrupt due to the economic conditions are quite bad. Weak corporate governance is often referred to as one of the causes of
the financial crisis in Asian countries (Johnson et al., 2000). Deteriorating economic conditions led many companies are not able to pay off the debt because at that time the value of the rupiah depreciated and an
increase in inflation is quite high. This resulted in an
impact on many people, as many banks were liquidated or merged and many companies are ultimately restructuring to be able to continue to operate or even bankruptcy. These events give attention to many
companies to restore confidence to stakeholders.
The presence of Good Corporate Governance (GCG) at the time of crisis recovery in Indonesia is very necessary, given the Good Corporate Governance (GCG) requires good management in an organization. GCG is a system that cannot give protection and assurance to stakeholders, including the shareholders, lenders, employees, executive, government, customers,
and other stakeholders. Johnson et al. (2000) showed
that countries with weak legal protection make the minority shareholders affected by the crisis more severe than countries with strong legal protection.
Measurement of the implementation of Good Corporate Governance (GCG) by the company can be proxied by several indicators including managerial ownership, institutional ownership, independent
commissioner and audit quality (Juniarti & Sentosa,
2009). Managerial ownership is the embodiment of the principles of transparency GCG. Management should manage the company to be transparent so that
it does not conflict with the interests of shareholders (Juniarti & Sentosa, 2009). Yunita (2012) stated that
the managerial ownership in a company to make managers more cautious in making decisions related to the debt policy. Manager suppresses the amount of debt to minimize the possible risks that have an impact on the decision of creditors in determining the rate of return. The smaller the risk that the company will
make the creditors have a higher degree of confidence
that affects the rate of return will be set. The impetus for triggering the performance of the company’s management tried to make it happens to make the risk smaller in the eyes of creditors so that ultimately creditors will only ask for a small return.
In addition to managerial ownership, institutional ownership is also an embodiment of the principles of corporate governance. Institutional ownership outside
the company in a significant number will result in the
stringent supervision of the management conducted by management who made outside the company. For the management, the supervision of outside parties to encourage the management showed better performance and made management in a transparent manner.
Research conducted by Robert and Yuan
(2009), with a sample of companies listed on the
NYSE, NASDAQ, and AMEX, included in the SDC Syndicated Loan Database in the period of 1995 to
2004, found that institutional ownership reduced the cost of corporate debt. The reason was the effective monitoring conducted by Institutional to encourage management to improve company performance. The increased performance of the company makes the risk smaller companies so the return desired by the creditor will be lower.
In contrast to research conducted by Juniarti and Sentosa (2009) as well as Robert and Yuan (2009), the research of Yunita (2012), with a sample of manufacturing companies listed in Indonesia Stock Exchange 2008-2010 period, showed a positive effect
of institutional ownership the cost of debt. The higher the institutional ownership, the higher the company’s debt policy. This is due to institutional shareholders as the largest shareholder wanted to fund the company with debt because they did not reduce their voting
rights (Yunita, 2012).
In addition to managerial and institutional ownership, an element of independent directors in the company’s organizational structure consists of commissioners from outside the company will work to balance the decision-making process, especially to protect minority shareholders and other parties concerned. Therefore, the proportion of independent board is the embodiment of GCG.
The presence of independent board within the organizational structure allows the company to
provide financial statements that have more integrity
so that creditors can see the company’s performance and ultimately affect the cost of debt or creditor
Lehman Brothers Index 1993-1998 period, shows
that the proportion of independent commissioners can reduce the cost of debt.
Another proxy measure of GCG is the quality
of the audit. Past research has shown auditors offer different levels of quality audit in response to a variety of client requests to audit quality. The previous study distinguishes the quality of auditors by the reputable
public accounting firm (big four) and non-reputable public accounting firm (non-big four), and there is a
use of auditor industry specialization as the basis for giving value for the quality of audits. Companies that
have implemented GCG will seek to use qualified
auditor.
Research by Juniarti and Sentosa (2009),
with a sample of manufacturing companies listed in
Indonesia Stock Exchange 2003-2007 period, stated
that the greater the quality of the audit led to the cost of debt the company becomes smaller. The company
chose to use reputable public accounting firm (big
four) because it has a good reputation. To maintain
its reputation, the reputable accounting firm uses better systems, qualified human resources, as well as
acting more cautious in conducting the examination process (auditing). This is seen as a positive thing for the creditors because the company is valued more transparent, leading to lower corporate risk and smaller cost of debt borne.
A study needed to be investigated is the
ownership of the family and their impact on the cost of corporate debt. The prior research stated that family ownership affects the cost of debt. Rebecca
and Siregar (2011), with a sample of manufacturing firms in Indonesia Stock Exchange 2008-2010 period,
found that a large proportion of family ownership in a company can raise the cost of debt.Shareholding in large numbers indicates the level of control that is owned by the company is also getting bigger. The controlling shareholder is raising incentives to increase
private profits and as a result, creditors anticipate such risks with higher debt costs. Boubakri and Ghouma
(2010) gave evidence that family ownership had a
significant positive effect on the cost of debt.
This study is an extension of previous research
done by Juniarti and Sentosa (2009). The differences
of this study with previous research are as follows: (1) variables used previous investigators is the proportion of independent board, managerial ownership, institutional ownership, and quality audits. While in this study, the researchers added one independent variable, the family ownership which suggested in previous research to add other variables that affect the cost of debt. (2) The object of this research is the companies included in the list of the Kompas 100 2013
with the period of August-January 2014. Meanwhile,
the object of previous research is manufacturing
companies listed on the Stock Exchange. (3) The
period of this study takes from the period of 2008 to 2012. Meanwhile, the previous study period took
in 2003 to 2007. The period of 2008-2012 indicates
the actual conditions that are the most relevant to the issues observed.
The problems of this study are as follows: (1) Is Good Corporate Governance (GCG) is proxied by the proportion of independent board, managerial ownership, institutional ownership, audit quality and family ownership partially affect the cost of debt? (2) Is Good Corporate Governance (GCG) is proxied by the proportion of independent board, managerial ownership, institutional ownership, audit-quality,) and family ownership simultaneously affect the cost of debt?
The purpose of this research is as follows: (1) to analyze the effect of Good Corporate Governance (GCG) is proxied by the proportion of independent board, managerial ownership, institutional ownership, audit quality and family ownership partially affect the cost of debt. (2) To analyze the effect of Good Corporate Governance (GCG) is proxied by the proportion of independent board, managerial ownership, institutional ownership, audit quality and family ownership simultaneously affect the cost of debt.
METHODS
The object of this research is the companies included in the list of the Kompas 100 the period
August 2013 - January 2014. The population in this
study are all companies listed on the Indonesian
Stock Exchange (BEI) in the study period
2008-2012. The data used in this research is secondary
data that the financial statements and annual reports
of all companies included in the list of Kompas 100
in the period of August 2013-January 2014 and had published financial statements and annual report
for the period ended from 31 December 2008 to 31 December 2012. The testing devices are statistics used to process samples of existing data is to use statistical tests descriptive, classic assumption test (normality test, autocorrelation test, heteroscedasticity test, multicollinearity test) and hypothesis testing (test
the coefficient of determination, f-test, t-test). Tests were performed using SPSS (Statistical Product and Services Solutions) by using the following research
model:
COD = a + b1KIND+ b2KMAN+ b3KINST+ b4KAUD+ b5FOWN+ b6DER + b7SIZE + e
(1)
Where:
COD = Cost of debt (cost of debt) of firm i in year t
a = Constant
b = regression coefficient
KIND = the proportion of independent directors of firm i
Kinst = institutional ownership companies i KAUD = Quality audit firm i
Fown = Family ownership (family holdings) DER = Debt equity ratio
SIZE = Size of company i
e = Error
The following paragraphs will explain about several operationalization variables used in this study.
Good corporate governance is good governance of an organization that is based on professional ethics in business or work, which aims to create excellence in enterprise performance management business and service companies, as well as a good institution to manage the company aims to increase business productivity. The indicators that are taken in the measurement of good corporate governance are as follows.
Independent board is the organ in charge of enterprise and collective responsibility to oversee and advise the board of directors, as well as to ensure the company implements the GCG. Commissioners should not be involved in operational decision
making. Each member of the board of commissioners
including the chief commissioner is equivalent. The main task of the commissioner is as primus inters pres that is coordinating the activities of the board of commissioners (KNKG, 2006).
Independent commissioner measured by the percentage of the total number of board of
commissioners (Juniarti & Sentosa, 2009). The
formulation is
(1)
Managerial ownership is a management share ownership of the entire share capital of the company
managed (Gideon, 2005). Managerial ownership is measured by the percentage of shares owned by the management of the entire outstanding share capital
of the company (Juniarti & Sentosa, 2009). The
formulation is
(2)
Institutional ownership is the company’s shares are owned by institutional investors, such as
investment firms, banks, insurance companies, foreign institutions, trust funds or other institutions (Juniarti,
2009). The term refers to the institutional investors who include the management of professional investors who invest on behalf of other parties, both individually
and organizationally (Brancato, 1997 in Juniarti & Sentosa, 2009).
In accordance with the above definition,
institutional ownership is measured by the percentage of institutional ownership in the share structure of the
company as previous studies (Bhojraj & Sengupta, 2003; Robert & Yuan, 2006; Piot and Missonier 2007; Juniarti & Sentosa, 2009; Collins & Huang 2010; and Shuto & Kitagawa, 2010). Formulated as
(3)
Audit quality is measured using the size of the Public Accounting Firm (KAP). Companies audited by the reputable public accounting firms (big four) in this
research, produce a high quality audit. On the other hand, companies audited by the non-reputable public
accounting firms (non-big four) produce low quality audit. The reputable public accounting firms (big four) consist of Pricewater House Coopers, Deloitte, Ernst & Young and KPMG.
Audit quality is measured by whether the company’s financial statements audited by the big-four accounting firm or not. Dummy variables are used
for this proxy is to give a value of 1 if the company’s
financial statements audited big-four accounting firm and the value 0 when the audited financial statements of the company by other KAP (Juniarti & Sentosa,
2009).
Family company, in general, is a company majority owned by certain families or their share
ownership is concentrated in certain families (Ayub, 2008). Laporta (1999) in Ayub (2008) identified
family ownership to individual ownership and private
company ownership (above 5%), which is not the ownership of SOEs and enterprises, public company or financial institution. Thus, the company kind
of family ownership is not limited to the company
placing his family members in the position of CEO,
directors or other management positions. Companies
that hire CEOs, directors or managers from outside the
family members of the owner of the company remains categorized as a family type of company ownership.
In a sensitivity analysis, family ownership is measured using dummy variables, namely one for the
company with the family ownership of 20% or more and 0 for firms with family ownership of less than 20%. The use of this measure refers to IAS 15 (revised
2009) which states that if the investor has, directly or
indirectly, 20% or more of the voting power of the investee, the investor is considered to have significant influence. This analysis was conducted to find out the presence or absence of significant influence (not just
the percentage of ownership) of family ownership that affects the cost of corporate debt.
This study uses control variables which are the
determine how well the lender is protected in case of bankruptcy. From the perspective of long-term ability to repay debt, the lower this ratio, the better
the company’s debt position (Financial Statement Analysis).
Debt to equity ratio is measured by comparing the company’s total liabilities to total equity of the company at the end of the year. The formula of Debt
Equity Ratio (DER) is
(4)
Company size is calculated using proxy total assets owned by the company at the end of the year. This study uses the dependent variable amount of debt costs received by the company. Cost of debt is the level that should be received from the investment to achieve the yield rate required by the creditor or in other words is the rate of return required creditors when performing
fund in a company (Fabozzi in Ayub, 2008). The cost
of debt includes interest rates that must be paid by the
company when making loans. Singgih (2002) stated
that the cost of debt is the interest rate before tax that companies pay on their loan provider.
Cost of debt is calculated based on the amount of interest expense paid by the company within one year divided by the number of loans that generate such interest. This is in accordance with the researches of
Piot (2007); Juniarti and Sentosa (2009); and Rebecca and Siregar (2011), which use the company’s debt
interest rate to calculate the cost of debt received by the company. The study also focuses on newly issued debt obtained by the company in the current period. Thus, the cost of debt can be formulated as
(5)
RESULTS AND DISCUSSIONS
Selection of the sample in this study was
conducted with a purposive sampling method. The sample selection process is based on certain criteria that have been set. The sample selection processes is based on criteria that are shown in Table 1.
Table 2 illustrates the minimum, maximum, average (mean) and standard deviation of each
variable of the study. Based on test results obtained by descriptive statistics 170 observational data (N)
derived from the multiplication of the number of sample companies (34 companies) with the study
period (five years, from 2008 until 2012).
The results of descriptive statistics for the independent variable proportion of independent commissioners (KIND), which is the percentage of the total number of independent directors on the board of directors, based on Table 2, this variable
has an average value reaches 0.4497 or 44.97%.
These results indicate that the majority of the sample companies have independent directors proportion of
44.97%. The maximum value of the proportion of independent directors amounted to 0.8571 or reached 85.71%. This shows that the highest proportion of
independent commissioners of the sample companies
amounted to 85.71%. Meanwhile, the minimum value
of the proportion of independent directors amounted
to 0.1667 or reached 16.67%. This suggests that the Commissioner lowest proportion of sample firms is 17%.
The next independent variable is the managerial
ownership (KMAN), which is the percentage of the
number of shares held by the management of the entire
outstanding share capital of the company. According to
the Table 2, this variable has an average value reaches
0.0074 or 0.74%. The minimum value of managerial ownership of 0.00 or 0%, it means that there is no
managerial ownership in the company. The maximum
value of managerial ownership reached 0.1752 or 17.52%. This shows that the highest managerial ownership of the sample companies is 17.52%.
Institutional ownership is defined as the
percentage of institutional ownership in the structure
of the company’s shares. According to the Table 2, the
average value for the variable institutional ownership
is amounted to 0.6093 or 60.93%. It shows that most of the sample firms on average are owned by institutions with a share of 60.93% equity stake in the company.
The maximum value of institutional ownership may
reach 0.9980 or 99.80%. This shows that the highest
the highest institutional ownership of the company
amounted to 99.80% of the samples. The minimum value of institutional ownership amounted to 0.0585 or 5.85%. This suggests that institutional ownership
is the lowest of the sample companies amounted to
5.85%.
Results of analysis using descriptive statistics on the variable quality of the audit showed a minimum value of 0, and the maximum value of 1. The average value is 0.6412 with a standard deviation of 0.4811.
Based on Table 2, the variable has an average value of 0.6412 or 64.12%. This suggests that the bulk of
the sample of companies is audited by the reputable
public accounting firms (big four).
Family ownership is defined as a company
that is majorly owned by certain families, or their share ownership is concentrated in certain families.
Based on Table 2, this variable has an average value of 0.2647 or 26.47%. This shows that 26.47% of the
sample company is a family company. The maximum value of family ownership is equal to 1. This suggests
that family ownership in the company sample of 20%
or more while the minimum value of family ownership is at 0. This indicates that there is no ownership of the family in the sample companies.
Furthermore, the results of descriptive statistics for the variables debt to equity ratio show the average
value of 3.2176 or 321.76%. These results indicate that
Table 1 Sample Selection
Description Amount
Companies included in the list of Kompas 100 period August 2013-January 2014 100
Companies that do not publish financial statements and annual reports to the full in the period 2008-2012 39 Companies that do not have the interest expense and interest bearing debt during the period 23
The company's financial statements are presented in foreign currencies, other than Rp 4
Total Companies 34
The time period 2008-2012 five-year analysis 5
The total number of samples during the study period 170
Source: Results from Self-Calculation
Table 2 Descriptive Statistics Test Results
N Minimum Maximum Mean Std. Deviation
KIND 170 ,1667 ,8571 ,4497 ,1067
KMAN 170 ,0000 ,1752 ,0074 ,0253
KINST 170 ,0585 ,9980 ,6093 ,2174
KAUD 170 ,0000 1,0000 ,6412 ,4811
FOWN 170 ,0000 1,0000 ,2647 ,4425
DER 170 ,2145 17,6567 3,2176 3,6862
SIZE 170 18502257139 6,35619E+14 6,49276E+13 1,22791E+14
COD 170 ,0034 ,1772 ,0777 ,0378
Valid N (listwise) 170
Source: Secondary Data Processing Result
compared with stocks. In addition, it also indicates that the degree of preference for companies in Indonesia to
external financing using debt is quite high. The average
for the size of the company as measured by total assets
amounted to 64,927,570,260,336,-. This shows that
the average total assets of the sample companies above Rp 10 trillion. The maximum value of the company’s size as measured by total assets amounted to Rp
635,619,000,000,000, -. While the minimum value of the size of the company is Rp 18,502,257,139, -.
Based on Table 2, it is known that the average
COD (cost of debt), which is owned by the company
samples amounted to 0.0777 or 7.77%. This indicates
that the company’s average sample loan has an interest
rate 7.77%. The maximum value of COD is 17.72%. The minimum value COD is 12.34%.
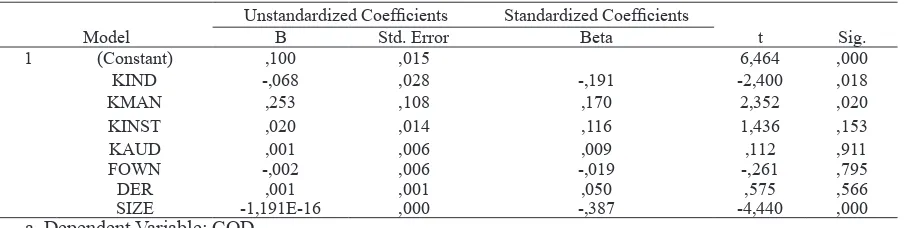
Table 3 Test Results Statistics t
Unstandardized Coefficients Standardized Coefficients
Model B Std. Error Beta t Sig.
1 (Constant) ,100 ,015 6,464 ,000
KIND -,068 ,028 -,191 -2,400 ,018
KMAN ,253 ,108 ,170 2,352 ,020
KINST ,020 ,014 ,116 1,436 ,153
KAUD ,001 ,006 ,009 ,112 ,911
FOWN -,002 ,006 -,019 -,261 ,795
DER ,001 ,001 ,050 ,575 ,566
SIZE -1,191E-16 ,000 -,387 -4,440 ,000
a. Dependent Variable: COD
Table 3 shows the results of the t-test between independent variables and control variables on the dependent variable. The variable proportion of independent commissioners (KIND) has t-count of
-2.400 with a significance level of 0,018 or 1.8%. The significance level is less than 0.05 or 5%. The resulting value is a negative beta of -0.068, which means H1a
is received. Thus, it can be said that the proportion of
independent commissioners significant negative effect
on the cost of debt. This suggests that the presence of independent directors will lower the cost of debt.
Managerial ownership variable (KMAN) has t-count amounted to 2,352 with a significance level of 0,020 or 2%.
The significance level is less than 0.05 or 5%.
The beta value generated was positive amounting to
0,253, which means H2a is rejected. So it can be said that managerial ownership a significant positive effect
on the cost of debt. Institutional ownership variable
(KINST) has t-count of 1.436 with a significance level of 0.153, or 15.3%. The significance level is greater than 0.05, or 5%, which means H3a rejected so that
it can be said that the proportion of independent
commissioners did not significantly affect the cost of debt. Variable quality audit (KAUD) has t-count 0.112 with a significance level of 0.911, or 91.1%. The significance level is greater than 0.05, or 5%, which means H4a rejected. So it can be said that the quality of the audit no significant effect on the cost of debt.
The variable of family ownership has t-count of -0.261
with a significance level of 0,795. The significance level is higher than 0.05, which means H5a is rejected.
Thus, it can be said that the family ownership has
no significant effect on the cost of debt. Variable of Debt Equity Ratio (DER) has t-count of 0.575 with a significance level of 0.566, which means Ha is
rejected. This suggests that the debt to equity ratio
did not significantly affect the cost of debt. Variable size of the company (firm size) had t-count of -4.440 with a significance level of 0.000. The resulting value is a negative beta of -1,191E-016 which mean Ha is accepted. So it can be said that the size of the company (firm size) has a significant negative effect on the cost
of debt.
Thus, from the t-test results in Table 3, the regression equation is:
Y = 0,100 0,068KIND + 0,253KMAN + 0,020 0,068KINST
+ 0,001KAUD - 0,002FOWN + 0,001DER – 1,191E – 16SIZE + e (6)
The variable proportion of independent commissioners (KIND) in Table 3 shows a negative
coefficient of -0.068 with a significance level of 0.018 which is smaller than α = 5% (0.018<0.05). The significance level is smaller than α = 5%, thus it is proved that H10 is rejected while H1a is received.
In other words, the hypothesis test result shows that the proportion of independent commissioners has
significant negative effect on the cost of debt. The results support the research conducted by Anderson et al. (2003), Robert and Yuan (2006), Piot (2007),
and Agustiawan (2012). This may be due to the
independent board within the organizational structure
led the company’s financial statements to provide more
integrity so that creditors can see the performance of the company. This ultimately affects the cost of debt
or rate of return set by the creditor. Anderson et al.,
(2003), proved that independent commissioners negatively affect the cost of debt, which means that an independent commissioner inversely proportional
to the cost of debt. According to him, in the act of
monitoring, independent directors can consider the effectiveness of supervision over the board of directors and audit committee as a guarantee of the integrity of
the value in the financial statements.
Managerial ownership variable (KMAN) in Table 3 shows the positive coefficient of 0.253 with a significance level of 0.020 which means greater than α = 5% (0.020<0.05). The significance level smaller than α = 5% proves that H20 and H2a are rejected or,
in other words, the hypothesis test results indicate that
managerial ownership has a significant positive effect
on the cost of debt. This result is consistent with the
result of the research by Agustiawan (2012) as well as Shuto and Kitagawa (2010). This could be due to, in addition to the conflict between shareholders to the manager, the conflict between creditors with managers, shareholders in the company, is one of the conflicts
that could occur within the company. The manager, as a shareholder, has an incentive to maximize the returns
to be obtained through investment and financing
decisions on the burden borne by the creditor. This happens because the responsibility of shareholders is limited. For example, shareholders have an incentive
to invest in projects that are at higher risk than specified
by the creditor. Thus, creditors bear the losses are greater when the investment company has failed and an experienced corporate debt default. Furthermore, shareholders also have the incentive to make the
transfer of wealth through financing activities, such as excessive dividend payments. In an efficient market, the rational lender incentives should know this. As a
result, they will adjust the return obtained so that the cost of corporate debt is higher.
Institutional ownership variable (KINST) in Table 3 shows the positive coefficient of 0.020 with a significance level of 0.153 which means it is greater than α = 5% (0.153>0.05). The significance level greater than α = 5% proves that H30 is received while H3a rejected or, in other words, the hypothesis
test results show that institutional ownership does not affect the cost of debt. It can be due to the major types of public company in Indonesia is still a family-owned company so that their monitoring by the institutional tend not affect the decision of the lender in determining the company’s cost of debt. The existence of institutional ownership in a company is considered to provide monitoring action against the
management. But if it is not accompanied by a serious
the company.
Variable quality audit (KAUD) in Table 3 shows the positive coefficient of 0.001 with a significance level of 0.911 which means greater than α = 5% (0.911>0.05). The significance level greater than α = 5% is proved that H40 is received while H4a rejected
or, in other words, the hypothesis test results indicate
that the quality of the audit no significant effect on the
cost of debt. The results are consistent with research
conducted by Agustiawan (2012) which shows that the quality does not significantly influence the cost of debt. According to Agustiawan (2012), companies choose to use big-four accounting firm because it has a good
reputation but not directly result in the cost of small
debt. The financial statements audited by the big-four accounting firm does not guarantee the company’s
cost of debt to be getting smaller.
Variable family ownership (FOWN) in Table
3 shows a negative coefficient of -0.002 with a significance level of 0,795 which means greater than α = 5% (0.795>0.05). For the significance level to be greater than α = 5% proves that H50 is accepted and H5a is rejected, or in other words the hypothesis
test results show that family ownership does not
significantly influence the cost of debt. The results are consistent with research conducted by Ayub (2008) and Rebecca and Siregar (2012). This may be due to
agency problems between managers and shareholders can be reduced in the company with ownership of the family, despite the agency problem between majority shareholders and minority shareholders. In other words, agency problem between majority shareholders and
minority shareholders that commonly occur in firms
with family ownership gives greater risks to investors than a creditor that is likely to affect the decision of shareholders or prospective investor and not unduly
influence the decision of creditors. Research by Rebecca and Siregar (2011) suggested that family ownership does not significantly influence the cost of debt. According to them, agency problem between
majority shareholders and minority shareholders that
commonly occur in firms with family ownership
provides a greater risk to investors than the creditors
that are likely to influence the decision of shareholders or potential investors and does not unduly influence
the decision of creditors.
Control variables of Debt to Equity Ratio (DER) in Table 3 shows the positive coefficient of 0.001 with a significance level of 0.566, which means greater than α = 5% (0.566>0.05). The significance level that is greater than α = 5% proves that the debt to equity ratio variables did not significantly affect the
cost of debt. This is possible because lenders assume that the management can take action manipulation by increasing the equity of the company. The greater the equity of the company compared to the debt you have, the smaller the debt to equity ratio. Therefore, lenders do not just use the leverage ratio in considering investment decisions taken.
The size of the company (Firm Size) in Table 3 shows a negative coefficient of -1,191E-16 with a
significance level of 0.000, which is smaller than α = 5% (0.000< 0.05). The significance level that is smaller than α = 5% proves that the size of the company’s significant influence negatively on the cost of debt
received by the company. The results are consistent
with research conducted by Bhojraj and Sengupta (2003), Chen and Jian (2006), Shuto and Kitagawa (2010), and Rebecca and Siregar (2011). The greater
the total assets owned by the company, the greater the ability of the company to pay off its liabilities in the future so that the risk of company defaults will decline.
As a result, the cost of debt incurred by the company
will be lower.
CONCLUSIONS
This study aims to determine the effect of Good Corporate Governance (GCG) proxied by the proportion of independent board, managerial ownership, institutional ownership, audit quality, and family ownership towards the cost of debt to the companies included in the list of Kompas 100 in the
period of August 2013-January 2014.
Based on the data collected and testing that
was performed against 34 sample companies using multiple regression models, it can be concluded that (1) Good Corporate Governance (GCG) is proxied through the proportion of independent commissioners
has a negative significant effect on the cost of debt, managerial ownership has a positive significant effect
on the cost of debt, institutional ownership has no
significant effect on the cost of debt, quality audits did not significantly affect the cost of debt and ownership of the family does not have a significant effect on
the cost of debt.(2) Good Corporate Governance is proxied through the proportion of independent board, managerial ownership, institutional ownership, audit
quality, and family ownership significant to the cost
of debt.
REFERENCES
Anderson, R. C., Mansi, S. A., & Reeb, D. M. (2003). Founding Family Ownership and the Agency Cost of Debt. Journal of Financial Economics, 68(2), 263-285.
Agustiawan, A. S. (2012). Analisis Pengaruh Corporate Governance terhadap Cost of Debt (Unpublished thesis). Universitas Indonesia, Depok, Indonesia. Anderson, R. C., Mansi, S. A., & Reeb, D. M. (2004). Board
Characteristics Accounting Report Integrity, and the Cost of Debt. Journal of Financial Economics, 37(3), 315-342.
Ayub, M. (2008). Pengaruh Family Ownership terhadap Cost of Debt (Unpublished thesis). Universitas Indonesia, Depok, Indonesia.
Bodie, Z., Kane, A., & Marcus A. J. (2008). Investment. (7th ed.). New York: Mc-Graw-Hill International Edition. Boubakri, N., & Ghouma, H. (2010). Control/ownership
structure, creditor rights protection, and the cost of debt financing: International evidence. Journal of Banking & Finance, 34(10), 2481-2499.
Chen, Y. M., & Jian, J. Y. (2007). The Impact of Information Disclosure and Transparency Rankings System (IDTRs) and Corporate Governance Structure on Interest Cost of Debt. Working Paper. National Yunlin University of Science and Technology. Taiwan.
Forum for Corporate Governance in Indonesia (FCGI). (2001). Corporate Governance: Seri Tata Kelola Perusahaan (2nd ed.). Jakarta: Yayasan Pendidikan Pasar Modal Indonesia & Sinergy Communication. Juniarti, & Sentosa, A. A. (2009). Pengaruh Good Corporate
Governance, Voluntary Disclosure terhadap Biaya Utang (Cost of Debt). Jurnal Akuntansi Keuangan, 11(2), 88-100.
Komite Nasional Kebijakan Governance (KNKG). (2006). Pedoman umum GCG. Jakarta.
Piot, C., & Piera, F. M. (2007). Corporate Governance, Audit Quality, and The Cost of Debt Financing of French Listed Companies. Working Paper.
Rebecca, Y., & Siregar, V. S. (2011). Pengaruh Corporate Governance Index, Kepemilikan Keluarga, dan Kepemilikan Institusional terhadap Biaya Ekuitas dan Biaya Hutang: Studi Empiris pada Perusahaan Manufaktur yang Terdaftar di BEI. Jurnal FEUI. Roberts, G. S., & Yuan, L. (2009). Does Institutional
Ownership Affect the Cost of Bank Borrowing? Working paper, York University.
Ross, S. A., Westerfield, R.W., Jaffe, J., & Jordan, B. D. (2008). Modern Financial Management. (8th ed.). New York: McGraw-Hill International Edition. Shuto, A., & Kitagawa, N. (2010). The effect of managerial
ownership on the cost of debt: Evidence from Japan. RIEB Discussion Paper Series.
Singgih, S. (2002). Buku Latihan SPSS Statistik Parametrik. Jakarta: PT. Elex Media Komputindo.
Yuniar, M. (2013, 18 February). Aset Batavia Air Akan Dieksekusi Bank. Retrieved December 20, 2013 from http://www.tempo.co/read/ news/2013/02/18/090462016/Aset-Batavia-Air-Akan-Dieksekusi-Bank