Optimization of Annealing Temperature, Concentration of Primer, and Genome DNA for Amplification of Disease Resistance Gene Markers
on Tiger Shrimp (Penaeus monodon)
Andi Tenriulo1, Ahyar Ahmad2, Abd. Rauf Patong2 Email: [email protected]
1
Chemistry Graduate, Science Faculty, Hasanuddin University, Makassar, South Sulawesi, 90245
2
Lecturer of Chemistry Department, Science Faculty, Hasanuddin University, Makassar, South Sulawesi, 90245
Abstrak. Identifikasi udang tahan penyakit secara molekuler dengan teknik PCR merupakan salah satu langkah awal dalam upaya perakitan strain udang windu Penaeus monodon tahan penyakit. Penelitian ini bertujuan untuk mengoptimalisasi proses PCR agar memperoleh gen target yang sesuai dan meningkatkan produk amplifikasi. Isolasi genom DNA dilakukan dengan metode fenol-kloroform. Amplifikasi fragmen mikrosatelit menggunakan kit RTG-PCR beads dengan primer spesifik MsatPm-F dan MsatPm-R. Optimalisasi suhu annealing diatur pada 50, 52, 54, dan 56 ºC. Optimalisasi konsentrasi primer dilakukan dengan konsentrasi 0,5 µM; 1,0 µM; 1,5 µ M; dan 2,0 µ M primer forward dan reverse, dan DNA genom yang digunakan sebagai cetakan masing-masing sebanyak 0,5; 1,0; 1;5; dan 2,0 µg/µL. Hasil penelitian menunjukkan bahwa kondisi reaksi PCR sangat menentukan proses amplifikasi untuk identifikasi udang windu tahan penyakit, dimana suhu annealing 54 ºC, konsentrasi primer MsatPm-F dan MsatPm-R 1 µM DNA genom sebanyak 1 µg/µ L memberikan amplifikasi terbaik karena menghasilkan target yang sesuai, pita yang tebal, dan tidak terjadi mispriming.
kata kunci: Annealing, DNA genom udang windu, konsentrasi primer, optimalisasi, PCR.
Abstract. Identification of the molecular basis of disease-resistant shrimp with PCR technique is one of the initial steps in Assembly of tiger shrimp Penaeus monodon strains resistant to the disease.This study aims to optimize the PCR process in order to obtain the corresponding target genes and increases the amplification products. Isolation of genomic DNA was conducted by using phenol-chloroform method. Amplification of microsatellite fragments using RTG-PCR beads kit with specific primers MsatPm-F and MsatPm-R. Optimization of annealing temperature is set at 50, 52, 54, and 56 ºC. Optimization of primer concentration is done with a concentration of 0,5 µ M; 1,0 µM; 1,5 µM; dan 2,0 µM forward and reverse primer, and genomic DNA were used as templates, respectively 0.5; 1.0; 1,5; and 2.0 µ g/µ L. The results showed that the conditions of the PCR reaction largely determine the amplification process for the identification disease resistance gene marker of tiger shrimp, where annealing temperature 54 ºC, the concentration 1 µM of Primer MsatPm-F and MsatPm-R, and genomic DNA as much as 1 µg/µL provide best amplification because it produces the corresponding target, thick ribbon, and not occur mispriming.
Keywords : annealing, genomic DNA tiger shrimp, optimization, PCR, primer concentration.
1
INTRODUCTION
Development in Bioinformatics and the technique of polymerase chain reaction (PCR) can be used as an approach to develop a specific marker. PCR method is used to amplify specific regions of the DNA chain. Short chain oligonucleotide primer designed to hybridizy each end of the DNA chain at the target and then extend it on the opposite side of the DNA. To design a required primary data gene sequences that encode proteins similar to the gene to be amplified by PCR.
One important factor that affects the quality of PCR-based molecular detection is the selection of the appropriate primer
(Yowono, 2005). PCR primers are
oligonucleotides that act as initiation of
DNA molecule amplification. The
existence of the PCR primers, the target gene will be amplified during the PCR reaction. PCR amplification requires specific primers (sequences specific oligonukelotida), usually consists of 10-20 nucleotides and is designed based on the conserved region of the genome. The longer the primer, the more specific the region amplified. Designing a good primer should consider some specific rules, which shows the amount of amplicon, primer length, melting point or Tm, and do not form secondary structures such as dimers, cross-dimer, or hairpin (Dale and Schantz, 2002). The content of the oligonucleotide primer will determine the annealing temperature of the PCR reaction.
Mukherjee and Mandal (2009) have used DNA microsatellite markers to identify disease resistance of tiger shrimp with observed two populations tiger shrimp that are resistant to disease and can not stand white spot disease virus (WSSV, White Spot Syndrome Virus). The results indicate a difference in microsatellite DNA fingerprinting is very significant. In disease-resistant population, found only one microsatellite DNA band 317 bp, whereas the population is not resistant disease, there is an additional bands at 71 bp. Band at 71 bp was found in populations only
disease resistance. The discovery of DNA markers are resistant black tiger shrimp and WSSV disease resistance to disease, serve as the basis of DNA markers to determine disease resistance in tiger shrimp.
The concentration of DNA, primer length, base composition of primer, the concentration of Mg ions, and primer hybridization temperature should be carefully controlled in order to obtain DNA bands were intact and good. Optimization of the PCR process is necessary to produce the desired character. So far the optimization of PCR conditions for detection of DNA markers of disease resistance in black tiger shrimp has not been reported. Because it is necessary to develop methods, especially on the optimization of PCR conditions and optimization of the concentration of genomic DNA and primers to obtain
Extraction of genomic DNA of tiger shrimp is done using phenol-chloroform method that has been developed in grouper (Parenrengi et al., 2010). Muscle/meat from the pleopod 25-50 mg taken individually
Once the shrimp genomic DNA was isolated, the next process is the detection of DNA target. Detection sequences of DNA target performed by amplification of microsatellite DNA fragments using PCR
machine GenAmp 7200 (Applied
based on information from the Gene Bank
accession number AF077565.
Amplification was performed using PCR Kit PureTaq Ready To Go (RTG) beads. This kit contains 2.5 units of Taq polymerase, 10 mM Tris-HCl pH 9, 50 mM KCl, 1.5 mM MgCl2, and 200 µM dNTP-mix.
Optimization Of Annealing Temperature
PCR conditions optimized
annealing temperature at 50, 52, 54, and
56 ºC. PCR is conditioned by: Pre-denaturation 94 °C for 3 minutes,
followed by 35 cycles of (denaturation 94 °C 30 second , annealing 50, 52, 54, and 56 ºC, extension 72 ºC for 1 minute), and final extension 72 ºC for 3 minutes.
Optimizing Concentrations of Primer and Genomic DNA
Optimization of primer
concentrations and genomic DNA
performed to obtain the desired target gene. To determine the concentration of primer and the appropriate genomic DNA used
various concentrations of primer
concentration of 0,5 µM; 1,0 µM; 1,5 µM; dan 2,0 µM forward and reverse (stock concentration of primer is 50 ρmol/µL) and DNA genome as a template, respectively 0.5 µg; 1.0 µg; 1.5 µ g; and 2.0 µg (stock concentration 50 µg/µL). The concentration of primer and genomic DNA fragments that show good will be used for subsequent amplification process.
Analysis of Microsatellite DNA Markers of Disease Resistant
Amplification fragment of
microsatellite sequences performed using PCR with specific primers MsatPm-F and
MsatPm-R are designed based on
information from the Gene Bank accession number AF077565.1. PCR reactions using RTG-PCR kit pureTaq beads. PCR results are then separated using electrophoresis techniques . To know that the amplification of the target DNA fragments were
successful, 1 µL PCR product
electrophoresed on 2% agarose gel at a voltage of 50 volts for 1 hour and documented with a Gel Documentation System . The molecular weight of the DNA fragments were determined by using Low Range DNA Marker.
Microsatellite analysis to be used refers to the method that has been developed by Mukherjee and Mandal (2009). Analysis were performed with indicators of the presence of fragments at position 317 bp and 71 bp. Data presented by descriptive.
RESULTS AND DISCUSSION Genomic DNA Extraction
Genomic DNA was isolated from black tiger shrimp using phenol-chloroform method. Visualization of genomic DNA extraction results shown in Figure 1 .
Figure 1. Profiles of genomic DNA isolated from black tiger shrimp (1-10), DNA Marker λ/Hind III (M); arrows indicate the position of genomic DNA fragments.
Table 1. The concentration and purity of genomic DNA of tiger shrimp Sample
Purity Concentratio n (µg/mL) genomic
DNA
1,91
±0,04 116,02 ± 27,4
Genomic DNA isolated from black tiger shrimp showed good purity as suggested by Linacero et al., (1998) which states that the good purity of the genomic DNA marked with OD260/OD280 ratio ranged from 1.8 to 2.0. If the DNA molecule with OD260/OD280 ratio is less than 1.8 then there is contamination of the protein, whereas the phenol contamination
and other organic materials are
characterized by high values ratio of OD260/OD280 more higher than 2.0. The quality and quantity of DNA is very influential on the success of the PCR process. Low purity would inhibiting primer composition of bases in the DNA chain. Small size can reduce DNA primer template. Similarly, the amount of DNA that is too high will affect the results of amplification (Surandar and Imron, 2010).
Optimization of Annealing Temperature Annealing is one of the PCR process, where the primer will recognize and attach to the DNA target sequence. Annealing process on the DNA thread that
has been open requires optimum
temperature. Annealing temperatures used are generally 5 ºC lower than the melting temperature (Tm) (Dale and Schantz, 2002). Tm values can be calculated by multiplying the 2 ºC for each nucleotide adenine and thymine and 4 ºC for each nucleotide guanine and cytosine. The results show the optimization on the temperature 54 °C resulted in DNA bands clearer with a specific size other than the annealing temperature. Temperatures that are too high can lead to amplification does not occur. Instead the temperature is too low causing the primer attached to the side of the DNA that is not the homologs, the
consequences can be amplified many areas are not specific in its genome.
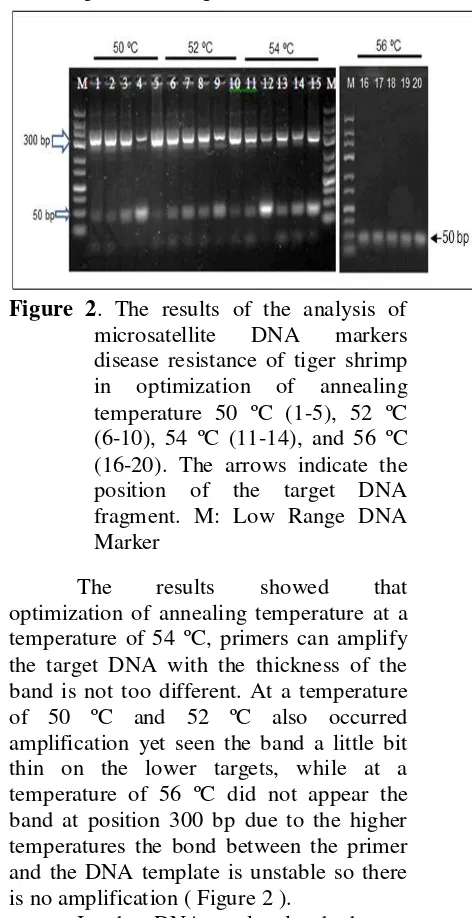
Figure 2. The results of the analysis of
microsatellite DNA markers
disease resistance of tiger shrimp in optimization of annealing temperature 50 ºC (1-5), 52 ºC (6-10), 54 ºC (11-14), and 56 ºC (16-20). The arrows indicate the position of the target DNA fragment. M: Low Range DNA Marker
The results showed that
optimization of annealing temperature at a temperature of 54 ºC, primers can amplify the target DNA with the thickness of the band is not too different. At a temperature of 50 ºC and 52 ºC also occurred amplification yet seen the band a little bit thin on the lower targets, while at a temperature of 56 ºC did not appear the band at position 300 bp due to the higher temperatures the bond between the primer and the DNA template is unstable so there is no amplification ( Figure 2 ).
double-stranded DNA separates into single strands. Tm values will determine primer annealing temperature needed to attach to the template DNA (Yowono, 2009).
According to Dale and Schantz (2002), the annealing process on the DNA thread is already open requires optimum temperature, because the temperature is too high can lead to amplification does not occur or the temperature is too low otherwise the primer cause attached to the other side of the genome that are not
homologs, consequently can not be
amplified many specific areas in the
genome. Annealing temperature is
determined based on the primers used are influenced by the length and composition of the primer .
Sambrook et al. (1998) states that the temperature settings greatly affect the process of amplification in a PCR reaction, because it will result in increase exponentially specific fragments of DNA targets. Products produced in the first cycle will act as a template in the next cycle. Tm values that are too low can cause the primer does not work at high temperatures, whereas the Tm values that are too high can cause the primer is not in the target area (mispriming) so that the products are not specific .
Optimizing of Primer Concentration Use primers with a concentration of 1 µM amplification results were better than the other concentrations. The use of higher concentrations of the primer causes fragments of the target DNA at position
300 bp becomes thinner even at
concentrations 3 µM and 4 µM looks very thin.
Similar results were reported by Abidin (2005), and Surandar and Imron (2010) that the use of high concentrations of the Primer causes not amplified fragment the target at high molecular weight. Muladno (2002) stated that the Primer concentration in the reaction is too high can cause primer attached to the 3 end is to complement.
Figure 3. The results of the analysis of microsatellite DNA markers in disease resistance of tiger shrimp
optimization of primer
concentration. Note: 1 (1 µg/µL), 2 (2 µ g/µ L), 3 (3 µ g/µ L), 4 (4 µ g/µ L), M (geneRuler Low Range DNA markers). The arrows indicate the position of the target DNA fragment.
Optimization of Genomic DNA Concentration
The concentration of genomic DNA allow the probability of amplification process. Primer will recognize appropriate
target DNA that occur subsequent
elongation, but the occurrence of rapid cycle DNA strands will make illegible or not recognizable perfectly, resulting in little fragments at a certain size and can also lead to misprime. The results of genomic
concentration optimization show
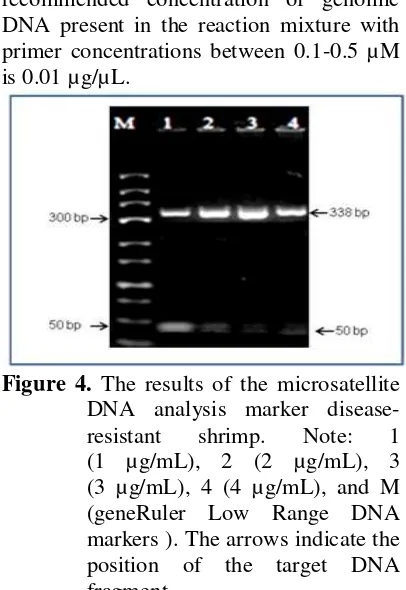
differences concentrations showed no difference in the pattern of fragments striking , especially in the higher molecular weight. However, at lower concentrations more clearly visible bands on the low bp (Figure 4). This suggests that the use 1 µg/µL of the genome DNA is considered the best for amplified the desease resistent gene marker.
weight. In Yowono (2005), the recommended concentration of genomic DNA present in the reaction mixture with primer concentrations between 0.1-0.5 µM is 0.01 µg/µL.
Figure 4. The results of the microsatellite DNA analysis marker
disease-resistant shrimp. Note: 1 (1 µg/mL), 2 (2 µg/mL), 3 (3 µg/mL), 4 (4 µ g/mL), and M (geneRuler Low Range DNA markers ). The arrows indicate the position of the target DNA fragment.
CONCLUSION
PCR reaction conditions determine
the amplification process for the
identification of disease-resistant tiger shrimp, where the optimal annealing temperature at 54 ºC, 1 µM primers
MsatPm-F and MsatPm-R primer
concentration and genomic DNA as much as 1 µg/µL gave the best amplification for generating the appropriate target, thick band, and does not happen mispriming.
ACKNOWLEDGEMENTS
This research was funded by the state budget of DIPA Research Institute for Coastal Aquaculture (RICA) Maros , Fiscal Year 2012 . Thanks go to the entire staff of researchers and technicians Biotechnology Laboratory RICA Maros, which has supported the implementation of this study.
REFERENCES
1. Abidin, G., 2005, Analysis of kinship of seaweed Kappaphycus alvarezii green and brown varieties
using Random Amplified
Polymorphic DNA methods, Thesis
Graduate, Program Brawijaya
University, Malang, 84 p.
2. Ash'ari, M. and Noer , A.S., 2005, MgCl concentration optimization and annealing temperature on the
process multifragmens mtDNA
amplification with the PCR method,
JKSA, 1 (8).
3. Asahida, T., Kobayasshi, K., Saitoh, and Nakayama, I., 1996, Tissue
preservation and total DNA
extraction from fish afternoon at ambient temperature using buffers containing high concentration of urea, Fisheries Sciences, 62 (5), 727-730.
4. Dale, J.W., and Schantz, M.V., 2002, From Genes to Genomes, University of Surrey, UK. 360 p. 5. Innis, M., and Dh Gelfand, 1990,
Optimization of PCR's, PCR
protocols Guade to Method and Application, Academic Press Inc. . P.3-12 .
6. Linacero, J., Rueda, Vazquez A.M., 1998, Quantification of DNA, 18-21, Isaac, G., Ingram, D.S.,
editors, Molecular Tools for
Screening Biodiversity, Plants and
Animals, Chapman and Hall,
London, Weinheim, New York, Tokyo, Melbourn, Madras .
7. Mukherjee, K. and Mandal, N.,
2009, A microsatellite DNA
markers developed for identifying disease resistant population of giant
black tiger shrimp, Penaeus
monodon, Word Aquaculture
Society, (2), 274-279.
8. Muladno, 2002, Regarding Genetic Engineering Technology, Young Entrepreneur Library, Bogor, 123 p. 9. Parenrengi, A., 2010, Increased
Tiger Shrimp Penaeus monodon
resistance to White Spot Syndrome
Virus Disease Through Gene
Transfer Penaeus monodon
School of Bogor Agricultural Institute.
10.Sambrook, J., and Russell, D.W., 2001, Ed. Molecular Cloning: A
Laboratory Manual 3rd Ed, Cold
Spring Harbor Laboratory Press, New York .
11.Sunandar, D., and Imron, 2010. Optimization of DNA template
Genome Pole Shrimp
Macrobrachium rosenbergii in the
process of PCR-RAPD, Proceedings of the Aquaculture Technology Innovation Forum.
12.Yowono T., 2005, Molecular