Analysis of Potato Farmer Satisfaction Towards
“X”
Fungicide in
Sumberbrantas Village, Bumiaji Sub-District, Batu City
Dwi Wulandari Agustyarini1*, Ratya Anindita2, Condro Puspo Nugroho2
Department of Social Economics, Faculty of Agriculture, University of Brawijaya, Jl. Veteran Malang 65145, Jawa Timur, Indonesia
Received: 29 May 2017; Revised: 6 July 2017; Accepted: 14 July 2017
ABSTRACT
The objectives of this research are to determine the decision making process in using “X” fungicide, the level of farmers’ satisfaction, and the loyalty level of the farmers towards “X” fungicide. The research was carried out in Sumberbrantas Village, Batu City. The determination of the respondents was conducted by using a simple random sampling with a total of 40 respondents. The methods used in this research were descriptive analysis for the decision-making process and for the loyalty level of the farmers, importance performance analysis (IPA), and customer satisfaction index (CSI). The result of decision-making process shows that farmers have decided to use “X” fungicide because the quality and active ingredients within while the IPA method shows that the efficiency of fungicide and the fact that there are no side effects on the plant become the top priority. On the one hand, the result of CSI method shows that 78,57% of the farmers are satisfied with “X” fungicide. As a whole, farmers have entered the habitual buyer level.
Keywords: fungicide; satisfaction; loyalty
How to cite: (Agustyarini, Anindita, & Nugroho, 2017)
Agustyarini, D. W., Anindita, R., & Nugroho, C. P. (2017). Analysis of Potato Farmer Satisfaction Towards “ X ” Fungicide in Sumberbrantas Village , Bumiaji Sub-District , Batu City. HABITAT,
28(2), 37–45. https://doi.org/10.21776/ub.habitat.2017.028.2.6
1. Introduction
Potato is one of the horticultural plants which contains high carbohydrate. Currently, potatoes have a good economic value because it is not only consumed in the form of vegetables but also served in various types of processed products such as french fries, potato chips, frozen potatoes, and so on. However, potato farmers experience constraints in potato cultivation. Phytophthora infestans fungus, in that case, become the constraints of the farmers in the cultivation so that they use a fungicide as a solution to overcome the fungus attack.
The plague of Phytophthora Infestans
encouraged the farmers to use fungicide as a solution. "X" fungicide becomes one of the fungicides that continues to be used by the farmers in every growing season. Nevertheless, there are lots of farmers who combine the “X” fungicide with other brands. Farmers always
mixed the “X” fungicide with other fungicides
to be applied. Based on the research conducted by (Yuantari, Widiarnako, and Sunoko, 2013) farmers do not pay attention to the label when mixing the solution, they mix it only by trial and error and experience of a friend. Farmers mix the fungicides with others because they feel that their yield is deficient. The mixing, in this case, is influenced by the quality and attributes offered.
The research from (Susila, Sumarwan, and Kirbrandoko, 2014) said that the quality of the products could have a considerable influence on consumer satisfaction. The results also supported by the research of (Suwarni and Mayasari, 2011) in (Susila, Sumarwan, and Kirbrandoko, 2014) that the quality of the product can affect customer loyalty. That way, product quality can affect customer satisfaction and loyalty. This is because customer satisfaction has a significant and positive relationship with customer loyalty (Mustikarini and Simanjuntak, 2014). Therefore, in order not to disappoint farmers, an improved performance
---
*)Corresponding Author.
is needed so that farmers do not mix fungicides with others.
In addition to not harming farmers, performance improvements are also important to retain customers. The brands of the fungicide are various in the markets. So, if farmers are not satisfied with the brand used today, farmers can switch to other brands. (Sudarti and Atika, 2012) stated that the increasingly fierce competition among companies leads the consumer to has an alternative decision on the purchase. Hence, the number of products in circulation becomes a benefit for farmers.
Farmers’ satisfaction in the use of
fungicides is influenced by the performance of the attributes. Farmers will be satisfied if the performance of the attributes can be more or equal to their expectations. The performance of the attributes has great benefits for farmers because some attributes are a major consideration in the use of "X" fungicide. Research on the retrieval process has been done by other researchers. Based on the research of (Shofianah, Ahmad, and Sunarti, 2014), the product attributes which consist of price, quality, design, and warranty have a significant influence on the decision-making process. Therefore, product quality and other product attributes are very important to be noticed by the company. If the expected attributes are in line with the perceived outcome, farmers will be satisfied and repurchased the product so that they would be loyal.
Potato farmers in Sumberbrantas Village have used the "X" fungicide for a long time. However, they still mixed the solution with other products even though the "X" fungicide already contained two different active ingredients. Due to this phenomenon, this research is important to do. Thus, the purpose of this study can be formulated (1) to know the decision-making process of the farmers in
choosing the “X” fungicide to
control Phytophthora infestans fungus on potato; (2) to analyze farmers’ satisfaction towards “X” fungicide; (3) to analyze farmers’ loyalty level in using "X" fungicide.
2. Research Methods
2.1. Location Determination Method The research was conducted in Sumberbrantas Village, Bumiaji Sub-district, Batu City. It was based on Sumberbrantas Village that being the center of potato
production. In addition, most of the farmers in
that village use the “X” fungicide for their
potatoes.
2.2. Sample Determination Method
In order to determine the respondents, a probability sampling method is used in this study. According to (Sugiyono, 2015), probability sampling is a method of determining respondents that provide equal opportunity for each member to be sampled. Respondents used in the study were potato farmers who used the "X" fungicide and joined the Farmer Group (Gabungan Kelompok Tani). Thus, the determination of the respondents was managed by using a simple random sampling technique. The sampling was done randomly (simple random sampling) because the members are a homogeneous population. The determination of the samples was set by using Slovin formula.
n = 𝑁
1+𝑁𝑒2 ...(1) Based on the calculations with an error rate of 15%, a total sample of 37,11 was obtained so that it was rounded up to 40 samples. This was supported by the statement of Sugiyono (2015) that the minimum number of samples used in a research should be 30 people or more.
2.3. Data Collection Method
The collection of the data was performed with two data types namely primary data and secondary data. The primary data was collected by interviews with the farmers by using questioner while the secondary data was obtained from BPS Batu City, Sumberbrantas Village Office, reference books, journals, and previous research.
2.4. Data Analysis
2.4.1.Description of Decision-Making Process
The decision-making process is the stage of the farmers starting from the introduction of needs to the decision of buying and post-purchase feelings. In this study, a descriptive qualitative analysis was used to describe the decision-making process of potato farmers
towards the “X” fungicide. The research on
2.4.2. Analysis of Farmers’ Satisfaction a. IPA (Importance Performance
Analysis)
IPA is an analytical tool used to determine the degree of correspondence between the level of importance and the level of attributes performance of "X" fungicide by using a Likert scale. Likert scale was used as quantitative measurement scale for the level of importance and the level of product performance (Simamora, 2002). Here are the steps to find the level of compliance between those two levels:
1) The first stage is to calculate the level of importance and the level of performance of each attribute. Then, the results are average of importance and performance to be a barrier in the Cartesian diagram of each attribute.
4) The last stage is to map each attribute on the Cartesian diagram by using the scores in the second stage.
The measurement of farmers’ satisfaction
by using IPA has been done by previous researchers. (Widyastuti, 2014) and (Mustikarini and Simanjuntak, 2014) have conducted a measurement of farmers’ satisfaction with the quality of the waitress and products by using IPA. According to Rangkuti (2006) in (Widyastuti, 2014), the core of the IPA analysis is the level of consumer interest measured in relation to the performance of a given company to produce such qualified products as well as high service.
b. CSI (Customer Satisfaction Index) Customer Satisfaction Index (CSI) is used to determine the overall level of farmers' satisfaction. The level of farmers’ satisfaction will be known by looking at the level of importance of the product attributes (Wicaksana, Muhaimin, and Koestiono, 2013). Here are the steps in calculating customer satisfaction by using CSI:
1) Determine the value of Mean Importance Score (MIS) and Mean Satisfaction Score (MSS). This value is derived from the average level of importance of each farmer.
2) Calculate the Weight Factors (WF) which change the average value of the importance test so that the total WF value is 100%.
3) Calculate the Weight Score (WS), which is a value obtained by multiplying the average value of the performance level of each attribute by WF in each attribute. 4) Calculate the Total Weight (WT), is
adding the WS of all the product attributes.
5) Calculate the CSI.
The previous research conducted by (Wicaksana, Muhaimin, and Koestiono, 2013), (Mustikarini and Simanjuntak, 2014) and (Diyahya and Sukiyono, 2016) explained that
farmers’ satisfaction level can be performed by
using CSI analysis.
2.4.3.Farmers Loyalty Analysis
Farmer's loyalty is determined by using a descriptive analysis method. According to (Sugiyono, 2015), the descriptive analysis method is used to analyze the data by describing or depicting the collected data without any intention to make a conclusion that applies to the public. Similarly, the research of (Hutabarat, Sumaryo, and Situmorang, 2013) assumed that the data collection of farmers loyalty measurement is tabulated and analyzed to describe of what is being investigated.
According to (Durianto, Sugiarto, and Sitinjak, 2001), a Likert scale on each variable is used to measure customer loyalty. The variables on farmers loyalty consist of switcher buyer, habitual buyer, satisfied buyer, liking the brand, and committed buyer. Then, the score will be processed to obtain the average value to
know the level of farmers’ loyalty. After
knowing the average response of the farmers, then, the number of farmers who enter each level of loyalty will be calculated. The calculation method is determined by the following formula:
Loyalty Level =
Respond" strongly agree" + Respond "agree"
Total Respondents x100%...(2)
However, the results from Durianto's theory show that the total percent of farmers loyalty level is not 100% if it is summed. The theory, thus, is improved by (Hutabarat, Sumaryo, and Situmorang, 2013). After calculating the level of farmers loyalty with
obtain a 100% level of loyalty. The trick is as
The decision-making process is the stage of the farmers before they have the decision to use a product. Decision-making process is needed to find the main factors that farmers decided to choose particular fungicide. In addition, the result of the decision-making process can be known in the feeling of the farmers after they use the product. The decision-making process begins with the introduction of needs, information search, alternative evaluation, purchasing decisions, and post-purchase. Here is the description of the farmer's decision-making process:
a. The introduction of needs
Farmers in Sumberbrantas Village do this potato cultivation as a source of income. However, in potato cultivation, the farmers also experience a problem which is the plague of Phytophthora infestans fungus. That way, fungicide acts as a solution to overcome the epidemic disease. Farmers hope that by using fungicides, that can reduce and eliminate fungal diseases in potato plants. Thus, the use of fungicide becomes a habit in potato cultivation. That way, farmers need a fungicide. b. Search Information
Potato farmers need a fungicide to overcome the plague of Phytophthora infestans
fungus, Therefore, farmers need a lot of information to know the right fungicide for their plants. Based on the results of the research, 80% of the information comes from the external factors which are farm shop and company while the other 20% is obtained through the internal factors namely parents and friends.
c. Alternative Evaluation
After they get the information, the next step is to filter the information obtained. Each brand has its own advantages and disadvantages. At the alternative evaluation stage, farmers compare each information even though the price must be more expensive than other brands. The "X" fungicide becomes a consideration among other fungicides by the potato farmers because there are advantages of this fungicide. This
“X” fungicide contains more than two active ingredients.
d. Purchasing Decisions
The results from alternative evaluation lead the farmers to their purchase decisions. The farmers in Sumberbrantas Village decide to use
the “X” fungicide as the main fungicide because
it has better quality with two active and synthetic ingredients. In making a purchase, 92,5% farmers in Sumberbrantas Village have a planned purchase that they do the purchase when it comes to the planting season. Meanwhile, 7,5% of them said that they buy the product depending on the situation; whenever they need to do the spray. In addition, farmers choose to buy fungicides at the nearest farm shop and pay behind which means that they take the goods first and will be paid after the harvest.
e. Post-purchase
After using the "X" fungicide, farmers feel either satisfied or dissatisfied. Based on the results of the study, 67,5% of the farmers are satisfied while 2,5% of them are dissatisfied after using the "X" fungicide. Moreover, 30% of other farmers feel quite satisfied when they use the fungicide. Farmers in this category do not experience disappointment but also do not feel an ultimate satisfaction with the "X" fungicide. If the price of the product increases, most farmers will still buy the "X" fungicide. This is in line with the research conducted by (Ameriana, 2008) that farmers do not affect the price in the purchase of the pesticides. This is because the pesticides are used as a collateral for the plants so that the plants stay alive and are not experiencing a failure in the harvest.
3.2. Farmers’ Satisfaction
3.2.1.IPA (Importance Performance Analysis)
Table 1. Compatibility Degree of Fungicide Attributes
Dimensions Attributes
Importance Level
Performance Level
Conformity Level
∑Yi Y ∑Xi X Tki
Performance The efficacy of the product in overcoming the fungus
189 4,73 137 3,43 72,49
Characteristics Package variations 108 2,70 110 2,75 101,86
Reliability
Fungicides are not easy to precipitate
178 4,45 173 4,33 97,19
No side effects on the plant 154 3,85 137 3,43 88,96
Aesthetics
Information on active ingredient contents
139 3,48 177 4,43 127,34
Usage information 128 3,20 149 3,73 116,41
Durability Expiration date 124 3,10 158 3,95 127,42
Serviceability Availability 180 4,50 192 4,70 106,67
Perceived quality Price 140 3,50 132 3,30 106,06
Trade name 146 3,65 172 4,30 117,81
Company name 128 3,20 186 4,65 145,31
Total 41,63 43,08
Average value 109,77
Quadrant Limit 3,67 3,92
Based on Table 1 above, it shows the level of importance and performance of each attribute as well as the suitability of each attribute level. According to Indriwinangsih and Sudayanto (2007) in (Diyahya and Sukiyono, 2016), if the level of conformity is 80% to 100%, the performance of the product attributes can be said to be in line with consumer expectations but it still needs to be improved. Subsequently, if the level of compliance is more than 100%, the performance of the attributes is said to already meet the consumer expectations. In Table 1, most attributes have more than 100% conformity. However, there are still three attributes that are not in accordance with the farmer's expectations such as the efficacy of the product in overcoming the fungus, the precipitation level of the fungicide, and the side effects.
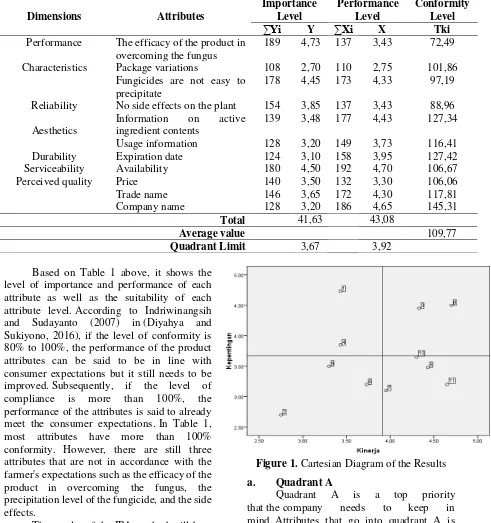
The results of the IPA method will be a barrier in Cartesian (x, y) diagram. The Cartesian diagram is used to determine the position of the attributes that need to be improved or maintained. Based on the calculation, each attribute has a coordinate point of x = 3,92 and y = 3,67. The cartesian diagram can be seen in Figure 1.
Figure 1. Cartesian Diagram of the Results a. Quadrant A
Quadrant A is a top priority that the company needs to keep in mind. Attributes that go into quadrant A is considered important by the farmers, while in fact there are still performance attributes that are not in accordance with the expectations. Therefore, the attributes that go into this quadrant need to be fixed. The attributes included in quadrant A are as follows: 1) The efficacy of the product in
overcoming the fungus
of the attributes is still not in line with their expectations because the product is not strong enough in overcoming the fungus. By that, many farmers are mixing the product with others.
2) The side effects on the plants
Based on the interview, the “X” fungicide has side effects on plants. In fact, if
you only use the “X” fungicide, the plant will
be yellow and the growth will be slowed down. This condition is quite disturbing to farmers. Therefore, these attributes go into quadrant A and need to be repaired as it interferes the plants.
b. Quadrant B
Quadrant B is a quadrant whose attributes must be maintained by the company because the perceived performance of the farmers is in line with its expectations. Attributes in this quadrant are considered important by farmers and the performance is appropriate. So, the attributes that are in this quadrant need to be preserved to
maintain farmers’ satisfaction. Attributes that
fit into this quadrant are:
1) The fungicide which is not easily precipitate
“X” fungicide is a flour-typed
fungicide. Therefore, the ease of mixing and precipitation are considered very important for farmers. The farmers see that these attributes
are in line with their expectations. The “X”
fungicide is very easy to be mixed and not easy to precipitate.
2) Fungicide Availability
The availability of the product is in line with the expectation that the fungicide is always available in store and easy to get. The availability of products is considered important for farmers because the "X" fungicide becomes a must-have fungicide in every growing season.
c. Quadrant C
Quadrant C is a quadrant whose attributes are perceived as less important by farmers. In addition, the performance of these attributes is also considered to be low or less satisfactory. However, although the attributes in this quadrant seem to be less important, it also needs to be repaired by the company. The attributes in this quadrant are:
1) Packaging
The packaging of “X” fungicide in the
market is the only one which is the 400grams package. Farmers stated that with the 400grams
package, it is easier for farmers to use because one package can be used directly for one spraying. However, we found that some farmers are still not satisfied with the packaging provided; some farmers expect a larger size. Farmers assume that if the packaging is bigger, the price of the fungicide can be slightly cheaper. However, packaging for farmers does not affect activities in potato cultivation so that a packaging size is not an important thing for farmers.
2) Usage information
The use of fungicides is clearly stated on the packaging but the perceived performance is still lacking. This is because the recommended dosage on the packaging also still lacking. If you follow the advice, the product will not affect the plant. The way of use is also considered less important for farmers because they think that it is the same as using another fungicide. So, it can be said that farmers rely on experience in using fungicides.
3) Price
Price is felt to be less important for farmers because farmers just want to get good quality. The farmers say that even though the price is low but the quality is less good, it will cause big losses due to a failure in the performance is considered excessive by farmers. However, the importance of these attributes is considered low by the farmers. Attributes that fit into this quadrant is not necessary to repair or improve the performance, such as:
ingredients is very influential on the plant. Perceived performance is that the information is very clear and in accordance with the farmer's expectations.
2) Expiration date
The expiration date, in this case, has an excessive performance. Farmers do not pay attention and do not consider the importance of expiration date. They only buy fungicides every growing season. If the planting season has changed, farmers will provide a new fungicide but still use the rest of the previous planting season. Thus, it can be said that the expiration date is considered less important for farmers. However, the performance of "X" fungicide has greatly exceeded the farmer's expectations. Farmers assured that the "X" fungicide can be used at any time if the packaging is not opened. This is evidenced by some farmers who once experienced an excess in the inventory in one growing season.
3) Company name and trade name
The name of the company also felt to be less important by most farmers. Farmers in this
group are farmers who believe in the recommendation of the farm shop and peer friends. They only see the results felt by peer friends. If the quality is good and in accordance with the expectation, farmers will use the product. Farmers do not pay much attention to the companies that produce it as well as to the trade name. Companies do not pay attention to the trade name because farmers already believe in a farm shop that always recommends the same product. However, the performance of company name and trade name is very appropriate: a very famous company and a very easy to remember trade name.
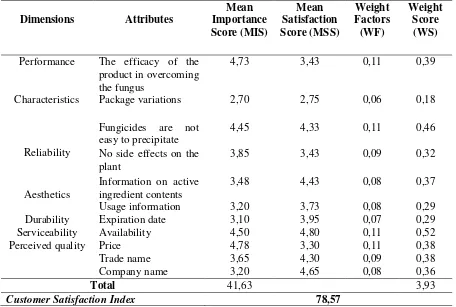
3.2.2. CSI (Customer Satisfaction Index) Farmers' satisfaction in the use of "X" fungicide was measured by using CSI analysis method. The objective of this method is to find the overall farmers' satisfaction towards "X" fungicide. In this analysis, the level of farmers’ satisfaction can be seen by looking at the importance and performance of product attributes related to the analysis of IPA.
Table 2. Customer Satisfaction Index Value Calculation
Dimensions Attributes
Mean Importance Score (MIS)
Mean Satisfaction Score (MSS)
Weight Factors (WF)
Weight Score (WS)
Performance The efficacy of the product in overcoming the fungus
4,73 3,43 0,11 0,39
Characteristics Package variations 2,70 2,75 0,06 0,18
Reliability
Fungicides are not easy to precipitate
4,45 4,33 0,11 0,46
No side effects on the plant
3,85 3,43 0,09 0,32
Aesthetics
Information on active ingredient contents
3,48 4,43 0,08 0,37
Usage information 3,20 3,73 0,08 0,29
Durability Expiration date 3,10 3,95 0,07 0,29
Serviceability Availability 4,50 4,80 0,11 0,52
Perceived quality Price 4,78 3,30 0,11 0,38
Trade name 3,65 4,30 0,09 0,38
Company name 3,20 4,65 0,08 0,36
Total 41,63 3,93
Customer Satisfaction Index 78,57
Based on the calculation in Table 2, the
CSI show farmers’ satisfaction index by
78,57%. The satisfaction value of 78,57% falls into the range of 66% to 88%. This means that,
wrote that the value within the range of 66<CSI<80 indicates that the farmers’ satisfaction is on the satisfied criteria. While on the other hand, the remaining 21,43% of potato farmers are still not satisfied with the attributes of "X" fungicide. Farmers' satisfaction rate on the satisfaction criteria is not enough. This means that companies need to increase the
farmers’ satisfaction up to 100% so that farmers
feel very satisfied.
Farmers’ satisfaction can be increased if
the company improves the shortcomings of the product quality. Therefore, the results of the IPA analysis are related to the CSI analysis. In
order to increase farmers’ satisfaction, the
company needs to improve the product attributes that have not been in accordance with
farmers’ expectations that can be seen from the
IPA and Cartesian diagram. 3.3. Farmers loyalty
The loyalty of the farmers is the attachment of farmers on a product so that they continue to use the product in every need. The information of farmers loyalty level is needed to increase the selling. As a matter of fact,
farmers’ satisfaction and loyalty have a positive
relationship. This is evidenced by the research conducted by (Mustikarini and Simanjuntak, 2014) that there is a significant positive relationship between satisfaction and loyalty towards pesticide so that the more satisfied the farmers, the more loyal the farmers to the brands of pesticides.
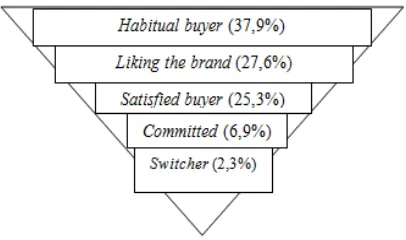
Farmer's loyalty to a product can be seen from the level of loyalty. According to (Durianto, Sugiarto and Sitinjak, 2001), the level of farmers loyalty is in the order from small to large, namely switcher buyer, habitual buyer, satisfied buyer, liking the brand, and committed buyer. Based on the results of research, the level of farmers loyalty to "X" fungicide is not in accordance with the theory of Durianto. This can be seen in Figure 3 that the level of farmers loyalty of committed buyers and the habitual buyer does not match the theory. Both levels are exchanged.
In Figure 2, the habitual buyer is at the top level and has the greatest percentage. Farmers in this level are farmers who are not disappointed with the product and are accustomed to the "X" fungicide.
Figure 2. Farmers’ Loyalty Level
Farmers are accustomed to the “X”
fungicide because of the limitations of product availability and that farmers have been satisfied since the first time of using the product. Although farmers do not feel disappointed and continue to use the "X" fungicide, the company needs to improve the quality of the product so that farmers are not only accustomed but also love the brand.
Whereas, at the lowest level, there is a switcher buyer. In this level, there are farmers who are very loyal to one fungicide brand because of a matter of a price. Based on the research, there are 2,3% of farmers in the category of switcher buyer. This means that only a few farmers choose to change brands because of a low price. The farmers pay more attention to the quality of the product because of its effect on their plants. Therefore, farmers have no effect on either cheap or expensive price. The fact that switcher buyer is on the bottom is very profitable for the company because farmers are not easy to change brands if there are cheaper products in the market.
4. Conclusion
Based on the results of the study, it can be concluded that the decision-making process of the farmers in the purchase of "X" fungicide is started with the problem of fungus plague. Then, farmers get the information through the farm shop and company. Thus, this makes farmers decided to buy the "X" fungicide and then feel satisfied with the product.
Farmers’ satisfaction is measured by
using IPA method in which this indicates that 109,77% of the performance is in line with the
farmers’ expectations. However, it is still
necessary to improve the attributes in quadrant A. Based on the measurement by using CSI
indicates that farmers are satisfied with "X" fungicide.
Overall, the level of farmers loyalty to "X" fungicide lies on habitual buyer level by 82,5% because, since the beginning of the use, farmers are not disappointed and become accustomed to this day.
Daftar Pustaka
Ameriana, M. (2008) ‘Perilaku Petani Sayuran
dalam Penggunaan Pestisida Kimia’, J.
Hort, 18(1), pp. 95–106.
Diyahya, I. and Sukiyono, K. (2016) ‘Lubuk
Pinang Kabupaten Mukomuko Analysis of Satisfaction Level Corn Farmers to Their Marketing Institution Services in Subdistrict of Lubuk Pinang District of
Mukomuko’, Agrisep, 16(1), pp. 45–58.
Durianto, D., Sugiarto and Sitinjak, T. (2001)
Strategi Menaklukkan Pasar Melalui Riset Ekuitas dan Perilaku Merek. Jakarta: PT.Gramedia Pustaka Utama.
Hutabarat, T. G., Sumaryo, G. and Situmorang,
S. (2013) ‘Analisis Loyalitas Petani
terhadap Benih Padi Unggul di Kecamatan Seputih Raman Kabupaten
Lampung Tengah’, Jurnal Ilmu-Ilmu
Agribisnis, 1(3), pp. 210–217.
Mustikarini, F. and Simanjuntak, M. (2014)
‘Kepuasan dan Loyalitas Petani Padi
Terhadap Pestisida’, 7(2), pp. 93–102.
Nurmalina, R. (2015) ‘Pest Control Operator
Pada Pt Bayer Indonesia Analysis the Impact of Product Quality and Customer Service on Satisfaction and Loyalty of Pest Control Operators in Pt Bayer
Indonesia’, Widyariset, 18(1), pp. 1–12.
Permasih, J., Widjaya, S. and Kalsum, U. (2014) ‘Proses Pengambilan Keputusan dan Faktor-faktor yang mempengaruhi Penggunaan Benih Jagung Hibrida oleh Petani di Kecamatan Adiluwih
Kabupaten Pringsewu’, 2(4), pp. 372–
381.
Shofianah, E., Ahmad, F. and Sunarti (2014)
‘Pengaruh Atribut Produk terhadap
Keputusan Pembelian’, 9(1).
Simamora, B. (2002) Panduan Riset Perilaku Konsumen. Jakarta: PT.Gramedia Pustaka Utama.
Sudarti, K. and Atika, I. (2012) ‘Menciptakan
Kepuasan dan Loyalitas Pelanggan
Melalui Citra dan Service Recovery’, Menciptakan kepuasan dan loyalitas pelanggan melalui citra dan Service recovery, 19(1), pp. 93–109.
Sugiyono (2015) Metode Penelitian Kuantitatif, Kualitatif, dan R7D. Bandung: Alfabeta.
Susila, B., Sumarwan, U. and Kirbrandoko
(2014) ‘Analisis Kepuasan Konsumen
Terhadap Brand Switching Behavior
Minuman Teh dalam Kemasan’, 7(3), pp.
193–201.
Wicaksana, B., Muhaimin, A. and Koestiono,
D. (2013) ‘Analisis Sikap dan Kepuasan
Petani dalam Menggunakan Benih Kentang Bersertifikat (Solanum tuberosum L.)(Kasus di Kecamatan Bumiaji, Kota Batu)’, Habitat, 2(3), pp. 184–193.
Widyastuti, E. (2014) ‘Ketahanan Pangan Kabupaten Magelang Tahun 2014’, Jurnal Riset Manajemen, 1(2), pp. 148– 167.
Yuantari, M. G. C., Widiarnako, B. and
Sunoko, H. R. (2013) ‘Tingkat
Pengetahuan Petani dalam Menggunakan Pestisida ( Studi Kasus di Desa Curut Kecamatan Penawangan
Kabupaten Grobogan )’, Seminar